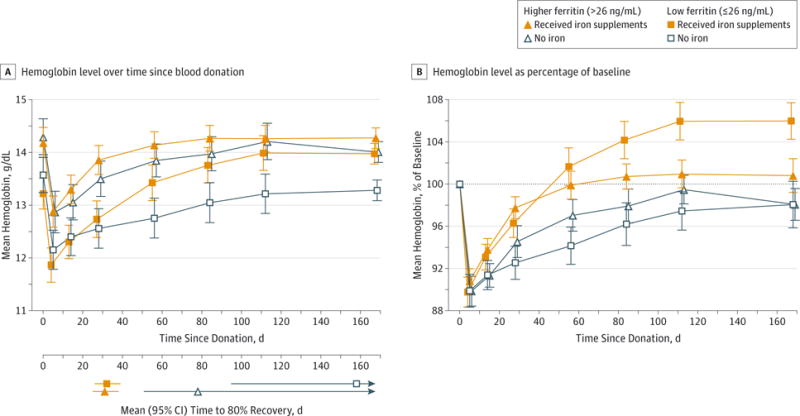
Figure 2. Time to Hemoglobin Recovery According to Treatment and Baseline Ferritin Level.

A, Mean hemoglobin for each group vs time since donation. Time “0” is the day of donation. B, Hemoglobin expressed as a percentage of initial hemoglobin value. Hemoglobin recovery was significantly higher than baseline in the low-ferritin group (≤26 ng/mL) who took iron (mean, 106.0%; 95% CI, 104.3%–107.7%; P < .001) and significantly lower than baseline in the higher-ferritin group (>26 ng/mL) who took no iron (mean, 98.1%; 95% CI, 96.6%–99.6%; P = .02). Dotted line indicates 100% of initial hemoglobin value; error bars, 95% confidence intervals.
