

Abstract
Background
Progressive subcortical changes are known to occur in Huntington's disease (HD), a hereditary neurodegenerative disorder. Less is known about the occurrence and cohesion of whole brain grey matter changes in HD.
Objectives
We aimed to detect network integrity changes in grey matter structural covariance networks and examined relationships with clinical assessments.
Methods
Structural magnetic resonance imaging data of premanifest HD (n = 30), HD patients (n = 30) and controls (n = 30) was used to identify ten structural covariance networks based on a novel technique using the co-variation of grey matter with independent component analysis in FSL. Group differences were studied controlling for age and gender. To explore whether our approach is effective in examining grey matter changes, regional voxel-based analysis was additionally performed.
Results
Premanifest HD and HD patients showed decreased network integrity in two networks compared to controls. One network included the caudate nucleus, precuneous and anterior cingulate cortex (in HD p < 0.001, in pre-HD p = 0.003). One other network contained the hippocampus, premotor, sensorimotor, and insular cortices (in HD p < 0.001, in pre-HD p = 0.023). Additionally, in HD patients only, decreased network integrity was observed in a network including the lingual gyrus, intracalcarine, cuneal, and lateral occipital cortices (p = 0.032). Changes in network integrity were significantly associated with scores of motor and neuropsychological assessments. In premanifest HD, voxel-based analyses showed pronounced volume loss in the basal ganglia, but less prominent in cortical regions.
Conclusion
Our results suggest that structural covariance might be a sensitive approach to reveal early grey matter changes, especially for premanifest HD.
Abbreviations: HD, Huntington's disease; CAG, cytosine-adenine-guanine; HTT, Huntingtin; TMS, Total Motor Score; UHDRS, Unified Huntington's Disease Rating Scale; TFC, Total Functional Capacity; MMSE, Mini Mental State Examination; SDMT, Symbol Digit Modality Test; TMT, Trail-Making Test; MNI, Montreal Neurological Institute; ICA, Independent Component Analysis; VBM, Voxel-Based Morphometry
Keywords: Huntington's disease, Structural MRI, Grey matter, Structural covariance networks, Voxel-based morphometry
Highlights
-
•
Identification of anatomical networks in Huntington's disease (HD).
-
•
Independent component analysis was used to examine structural covariance networks.
-
•
HD patients showed changes in subcortical and cortical covariance networks.
-
•
A network-based approach is sensitive to reveal early grey matter changes.
1. Introduction
Huntington's disease (HD) is an autosomal dominant inherited neurodegenerative disorder, caused by a cytosine-adenine-guanine (CAG) trinucleotide repeat expansion on chromosome four in the Huntingtin (HTT) gene (The Huntington's Disease Collaborative Research Group, 1993). The clinically manifest phase of the disease is characterized by motor disturbances, cognitive decline and psychiatric symptoms (such as apathy, depression, irritability, and obsessive-compulsive behavior), with a mean age at onset of 30 to 50 years (Roos, 2010).
HD gene carriers that have been tested positive for the CAG expansion are diagnosed as manifest HD based on the presence of typical motor disturbances that mainly involve chorea, dystonia, bradykinesia and rigidity (Roos, 2010).
Recent neuroimaging studies revealed pronounced neuropathological changes in subcortical structures, which primarily involve atrophy of the caudate nucleus and putamen (Aylward, 2014). This decline in striatal volume is already detectable in premanifest gene carriers, years before onset of motor disturbances (Paulsen et al., 2008, Tabrizi et al., 2009, van den Bogaard et al., 2011). Local subcortical grey matter volume changes in HD are commonly examined using a voxel-based approach (Douaud et al., 2006, Gómez-Ansón et al., 2009, Hobbs et al., 2010, Kassubek et al., 2005, Peinemann et al., 2005, Ruocco et al., 2008, Thieben et al., 2002), but only few neuroimaging studies have investigated the occurrence of volume changes in the cerebral cortex. Still, neuropathological studies on HD report the presence of widespread cortical atrophy in addition to striatal atrophy (De la Monte et al., 1988). Reported voxel-wise subcortical volume changes in HD are, however, more prominent than cortical changes and the amount of cortical changes varies across voxel-based studies (Dogan et al., 2013, Whitwell and Josephs, 2007).
As voxel-based methods, such as voxel-based morphometry (VBM) analysis, provide whole-brain results for individual regions by studying voxels separately, a multivariate network-based analysis might give more information about inter-regional dependencies between grey matter voxels. As neurodegeneration is probably a network-based process involving several brain regions and is not regional specific (Rombouts et al., 2009), examining such approach might be particularly interesting in HD. Recently, a novel technique is developed to study disease-specific inter-regional network changes in grey matter by using structural covariance networks independent of a-priori defined regions (Hafkemeijer et al., 2014, Xu et al., 2009). Structural covariance networks are based on the observation that grey matter regions in the brain co-vary in morphometric characteristics. Therefore, structural covariance networks might be a valuable tool in investigating the topological organization of the brain (Hafkemeijer et al., 2014).
Previous studies in premanifest HD showed that cognitive impairment and psychiatric symptoms can present prior to motor disturbances (Lemiere et al., 2004, Paulsen et al., 2008). Additionally, subcortical changes are already detectable in this stage of the disease (Aylward et al., 2004, Tabrizi et al., 2013). Whether or not abnormal grey matter changes are present in premanifest HD, we hypothesize that we may be able to reveal morphological characteristics that vary reciprocally between cortices or between the cortex and the subcortical grey matter regions using structural covariance networks. Such changes in a given patient population address for abnormality in the reciprocal relationship that is due to disturbance in normal development or aging. Using structural covariance networks in such an unrestricted exploratory way can give more insight into the pathophysiological processes underlying HD.
Network integrity scores can be defined as the strength of an individuals' expression in each identified anatomical network and can therefore indirectly provide information about grey matter changes. Network integrity scores can change as covariance can diminish when the existing correlation drops due to the variation within a normal range. Therefore, network integrity can change regardless of atrophy and might provide a more sensitive biomarker for tracking disease progression than direct measurement of volume changes in HD.
Thus, the aim of this study is to investigate network integrity changes in grey matter structural covariance networks in HD and examine the relationship between the identified networks and clinical assessments. Furthermore, we compared our inter-regional findings with regional volumetric voxel-based analysis on the same data, as this approach is most often used to examine volume loss in HD (Dogan et al., 2013).
2. Materials
2.1. Participants
Thirty premanifest gene carriers (pre-HD), 30 HD patients and 30 healthy controls who participated in the TRACK-HD study at the Leiden University Medical Center study site, were included. Both pre-HD and HD patients required a positive genetic test with 40 CAG repeats or more. Participants were considered pre-HD with a total motor score (TMS) of 5 or less on the motor assessment of the Unified Huntington's Disease Rating Scale (UHDRS) (Huntington Study Group, 1996) and a disease burden score (age × [CAG repeat length − 35.5]) of > 250 (Penney et al., 1997). HD patients were included with an UHDRS-TMS score > 5 and a Total Functional Capacity (TFC) score greater than or equal to 7 points. Partners and gene-negative relatives were recruited as healthy controls. The control group was age and gender matched to the combined pre-HD and HD patients. The Medical Ethical Committee of the Leiden University Medical Center approved this study and written informed consent was obtained from all participants. For additional details about the study design and exclusion criteria, (Tabrizi et al., 2009).
2.2. Clinical assessments
The UHDRS-TMS was used to measure the degree of motor disturbances, ranging from 0 to 124, with higher scores indicating more increased motor impairment. The TFC assesses global impairments in daily functioning, ranging from 0 to 13, with lower scores indicating more impaired function. Cognitive scores included the total scores of the Mini Mental State Examination (MMSE), Symbol Digit Modality Test (SDMT), Stroop word reading test and Trail-Making Test (TMT) A and B. The TMT score was derived by subtracting the completion time of TMT-A from TMT-B, thus minimizing the potential effect of motor speed and disturbances. For more details on all clinical assessments (Tabrizi et al., 2009).
2.3. MRI image acquisition
From January until August 2008, all participants underwent structural magnetic resonance imaging (MRI) scanning. Quality control of all images was performed by IXICO, London, United Kingdom. Imaging was performed on a 3 Tesla MRI scanner (Philips Achieva, Best, the Netherlands) using a standard 8-channel whole-head coil. Three-dimensional T1-weighted images were acquired with the following parameters: TR = 7.7 ms, TE = 3.5 ms, flip angle = 8°, FOV 24 cm, matrix size 224 × 224 cm and 164 sagittal slices to cover the entire brain with a slice thickness of 1.0 mm with no gap between slices. This resulted in a voxel size of 1,07 mm × 1,07 mm × 1,0 mm.
2.4. Data analysis
2.4.1. Image post-processing
All T1-weighted images were analyzed using the software provided by FMRIB's software library (FSL, version 5.0.8, Oxford, United Kingdom) (Smith et al., 2004).
First, all non-brain tissue was removed from structural T1-weighted images using a semi-automated brain extraction tool implemented in FSL (Smith, 2002). Before being aligned to the 2 mm MNI (Montreal Neurological Institute)-152 standard space image (Jenkinson et al., 2002) using non-linear registration (Andersson et al., 2007), voxel-based morphometry (VBM) analysis was used as implemented in FSL (Ashburner and Friston, 2000). First, tissue-type segmentation was performed. The segmented images have values that indicate the probability of a given tissue type (i.e. grey matter, white matter or cerebrospinal fluid). To correct for the partial volume effect (i.e. voxels containing more than one tissue type), the tissue type segmentation was carried out with partial volume estimation. The segmented images have values that indicate the probability of a given tissue type. The resulting grey matter segmented images were averaged to create a study-specific grey matter template and ‘modulated’ to correct for local enlargements and contractions due to the non-linear component of the spatial transformation (Good et al., 2001). During the modulation step, each voxel of every registered grey matter image was multiplied by the Jacobian of the warp field. This defines the direction (larger or smaller) and the amount of modulation. The modulated grey matter images were finally smoothed with an isotropic Gaussian kernel with a sigma of 3 mm.
For the network-based data-driven analysis, Multivariate Exploratory Linear Optimized Decomposition into Independent Components (MELODIC) (Beckmann et al., 2005, Beckmann and Smith, 2004) was used with the modulated grey matter images of all participants as a four-dimensional dataset. This statistical technique with independent component analysis (ICA) defines fully automated spatial component maps of maximal statistical independence, which is commonly used to study functional network integrity. When applied on structural grey matter images, this method defines spatial components based on the co-variation of grey matter patterns among all participants (Hafkemeijer et al., 2014, Segall et al., 2012, Xu et al., 2009). Then, ICA provides for each participant a score (‘network integrity score’), which can be negative or positive, describing the strength of the individual expression in each network (Beckmann and Smith, 2004, Segall et al., 2012), with high scores indicating strong individual expression of the identified network.
In general, there is no consensus on the optimal number of components, which may be depending on the data size and the research question (Cole et al., 2010). In our study, choosing less than ten components caused loss of spatial information due to merging of components, whereas selecting more components created additional components consisting of considerable noise. Therefore, we choose to set the number of independent components in our study to ten components. This number is consistent with previous studies of brain networks, in which eight to ten components are most often applied (Cole et al., 2010, Hafkemeijer et al., 2014). A standard threshold level of 0.5 was used to describe significance of individual voxels within a spatial map. This indicates that the probability of a voxel being a signal component is greater than the probability of a voxel being noise.
To investigate voxel-wise group differences in grey matter volume, VBM analysis was performed. Here, the modulated grey matter images were analyzed using a general linear model in FSL for statistical inference.
Voxel-wise non-parametric permutation testing with 5000 permutations was performed using FSL randomise (Winkler et al., 2014). Further, the Threshold-Free Cluster Enhancement (TFCE) technique was used (Smith and Nichols, 2009), to correct for multiple comparisons with a p-value < 0.05 as significant threshold.
Brain structures were identified using the Harvard-Oxford atlas integrated in FSL.
For each participant, the mean voxels' grey matter density value was calculated using the identified anatomical regions that showed significant grey matter volume changes as a mask.
2.4.2. Statistics
Statistical analyses were performed using the Statistical Package for Social Sciences (SPSS for Mac, version 23, SPSS Inc.). Differences in demographic and clinical variables between groups were assessed using analysis of variance (ANOVA), χ2 and Kruskall-Wallis tests for continuous, categorical and skewed data respectively.
For group comparisons, separate linear regression analysis was performed in each network with correction for age and gender using the network integrity scores as dependent variable. The analysis was performed to compare controls with gene carriers (i.e. pre-HD and HD patients separately). All independent variables were entered in one block. Furthermore, correlations between clinical assessments and genetic markers (i.e. CAG repeat length and disease burden) with the anatomical networks were assessed using linear regression analysis in pre-HD and HD patients.
For the VBM analysis, a design matrix for a general linear model was constructed in FSL to compare grey matter differences between controls and pre-HD and HD patients separately using two-tailed t-statistics, with age and gender as covariates to correct for confounding effects. To correct for multiple comparisons with family wise error, the Threshold-Free Cluster Enhancement (TFCE) technique was used (Smith and Nichols, 2009), with a p-value < 0.05 as significant threshold.
Linear regression analysis in HD gene carriers was performed to assess the relationship between clinical assessments and genetic markers with grey matter density values based on the mean value of the significant voxels of the VBM analysis.
In this observational study, the identified anatomical networks, grey matter density values, and cognitive tasks that were assessed share a mutual dependency. Considering it is not clear for which dependency to correct, we therefore present our correlational findings with clinical assessments uncorrected for multiple comparisons. As a result, to prevent type 2 errors, the interpretation of slight significant findings will be with caution. The significance threshold was set at a p value < 0.05.
3. Results
3.1. Demographic characteristics
Demographic and clinical data of all participants are shown in Table 1. There was a significant difference between groups for all clinical measures. Age, gender, handedness and education level did not differ between groups. There was no difference in CAG repeat length in both pre-HD and HD patients.
Table 1.
Demographic and clinical characteristics.
| Controls | Pre-HD | HD | p-value | |
|---|---|---|---|---|
| Number of participants | 30 | 30 | 30 | |
| Gender (male/female) | 14/16 | 12/18 | 9/21 | 0.411 |
| Age (years) | 48.9 (8.4, 35–65) | 43.7 (7.9, 26–62) | 47.9 (10.3, 31–64) | 0.060 |
| Handedness—right (%) | 25 (83.3%) | 26 (86.7%) | 25 (83.3%) | 0.339 |
| Education level (1–6) | 3.43 (1.1) | 3.83 (1.1) | 3.2 (1.4) | 0.229 |
| CAG repeat length | N/A | 43.4 (2.4, 40–51) | 44.1 (2.4, 40–49) | 0.217 |
| Disease burden * | N/A | 331.3 (65.5) | 396.1 (73.1) | 0.001 |
| Disease duration (years) | N/A | N/A | 4.0 (3.6, 0–13) | N/A |
| UHDRS—TMS (0–124) | 2.5 (0–7) | 2.4 (0–4) | 21.9 (6–45) | < 0.001 |
| TFC score (0 − 13) | 12.9 (10 − 13) | 12.6 (10–13) | 10.3 (7–13) | < 0.001 |
| SDMT (number correct) | 48.0 (17–71) | 50.0 (20–72) | 38.1 (16–57) | < 0.001 |
| Stroop (number correct) | 98.3 (69–129) | 92.7 (58–120) | 81.2 (47–111) | < 0.001 |
| TMT (seconds) | 38 (12–81) | 55.7 (7–108) | 88.1 (16–252) | 0.006 |
| MMSE | 29.1 (26–30) | 28.9 (25–30) | 27.2 (20 − 30) | 0.002 |
Data are mean (SD, range) or number (%). ANOVA was used for age, CAG repeat length, disease burden, UHDRS-TMS, SDMT and Stroop. χ2-test was used for gender, handedness and education level. Kruskal-Wallis test was used for TFC score, MMSE and TMT.
Abbreviations: HD = Huntington disease; N/A = Not applicable; CAG = cytosine, adenine, guanine; UHDRS-TMS = Unified Huntington's Disease Rating Scale-Total Motor Score; TFC = Total Functional Capacity score; SDMT = Symbol Digit Modality Test; TMT = Trail Making Test; MMSE = Mini Mental State Examination. * Disease burden score = age × (CAG length − 35.5) by Penney et al. (1997).
3.2. Voxel-based morphometry analysis
Regional volumetric voxel-based analysis was performed to assess voxel-wise differences between HD gene carriers and controls. In pre-HD, significant local grey matter volume reductions in the basal ganglia, mainly in the putamen, nucleus accumbens and caudate nucleus (Fig. 1A and Table 2) was found compared to controls. Cortical volume changes in pre-HD were limited to the insular cortex (p = 0.018) and a small region containing the planum temporale, parietal operculum cortex and posterior supramarginal gyrus (p = 0.045).
Fig. 1.

Regional grey matter volume changes in HD. Voxel-based morphometric analysis showed regional grey matter volume changes in premanifest gene carriers (A) and Huntington's disease patients (B) compared to controls. The grey matter changes are overlaid on sagittal, transversal and coronal slices of MNI-152 standard T1-weigthed images. Corresponding MNI x-, y- and z-coordinates are displayed. The threshold for display is p < 0.05 (corrected using familywise error). The color scale bar represents T-scores.
Table 2.
Results of voxel-based morphometry analysis.
| Cluster size | Anatomical region | MNI coordinates |
T-score | p-value | ||
|---|---|---|---|---|---|---|
| x | y | z | ||||
| Premanifest gene carriers | ||||||
| 1126 | Left putamen | − 32 | − 16 | − 6 | 5.39 | 0.005 |
| Left caudate nucleus | − 20 | 14 | 8 | 4.25 | 0.013 | |
| Left accumbens | − 6 | 12 | 2 | 4.14 | 0.015 | |
| Insular cortex | − 28 | 6 | 10 | 4.49 | 0.018 | |
| 1018 | Right caudate nucleus | 14 | 8 | 6 | 5.78 | 0.001 |
| Right thalamus | 14 | − 8 | 18 | 4.92 | 0.003 | |
| Right putamen, right pallidum | 28 | − 16 | 8 | 3.99 | 0.025 | |
| 10 | Planum temporale | − 46 | − 36 | 16 | 4.47 | 0.045 |
| Parietal operculum cortex | ||||||
| Posterior supramarginal gyrus | ||||||
| HD patients | ||||||
| 61,398 | Caudate nucleus | 16 | 10 | 8 | 12.29 | 0.001 |
| Putamen, pallidum | 24 | − 4 | 8 | 5.17 | 0.001 | |
| Postcentral gyrus | − 18 | − 36 | 70 | 3.28 | 0.001 | |
| Precentral gyrus | − 14 | − 22 | 60 | 2.98 | 0.001 | |
| Supplementary motor cortex | 10 | − 22 | 58 | 3.22 | 0.001 | |
| Lateral occipital cortex | − 46 | − 72 | 4 | 3.96 | 0.001 | |
| 11 | Frontal pole | 22 | 44 | 18 | 4.24 | 0.041 |
Anatomical regions that showed significant grey matter volume changes in Huntington's disease compared to controls using voxel-based morphometry analysis. Regions were identified using the cluster tool and the Harvard-Oxford Subcortical and Cortical Structural Atlases in FSL. The most significant local maxima are presented with T-statistics and a Threshold-Free Cluster Enhancement (TFCE) family-wise error corrected p-value.
In HD patients, grey matter volume reductions were more distributed across the brain (Fig. 1B and Table 2). VBM analysis showed subcortical volume loss in the caudate nucleus, putamen and pallidum. Significant cortical grey matter changes were primarily located in the pre- and postcentral gyrus, the supplementary motor cortex and the lateral occipital cortex.
3.3. Anatomical networks and group comparisons
Ten grey matter anatomical networks were identified in all participants (Fig. 2 and Table 3). Two structural covariance networks, the caudate nucleus network (network B) and the hippocampal network (network D), revealed a significant association in both pre-HD and HD patients compared to controls, meaning network integrity is reduced in both gene carrier groups compared to controls (Fig. 2B, D and Table 4). The caudate nucleus network includes the nucleus accumbens, pallidum, putamen, and precuneous. The hippocampal network is further comprised of the parahippocampal gyrus, cerebellum, pallidum, and planum polare. One other network, the intracalcarine network (network E), showed only a significant change in network integrity in HD patients compared to controls, but not in pre-HD (Fig. 2E and Table 4). This network includes the precuneous, cuneal and lateral occipital cortices and lingual gyrus. There were no significant group differences in network integrity in the 7 other identified networks (Fig. 2A,C, F–J and Table 4). These networks include: anterior cingulate gyrus (network C), temporal gyrus (network F), lateral occipital cortex (network H), precuneous (network I), lingual gyrus (network J) and two cerebellar networks (networks A and G).
Fig. 2.
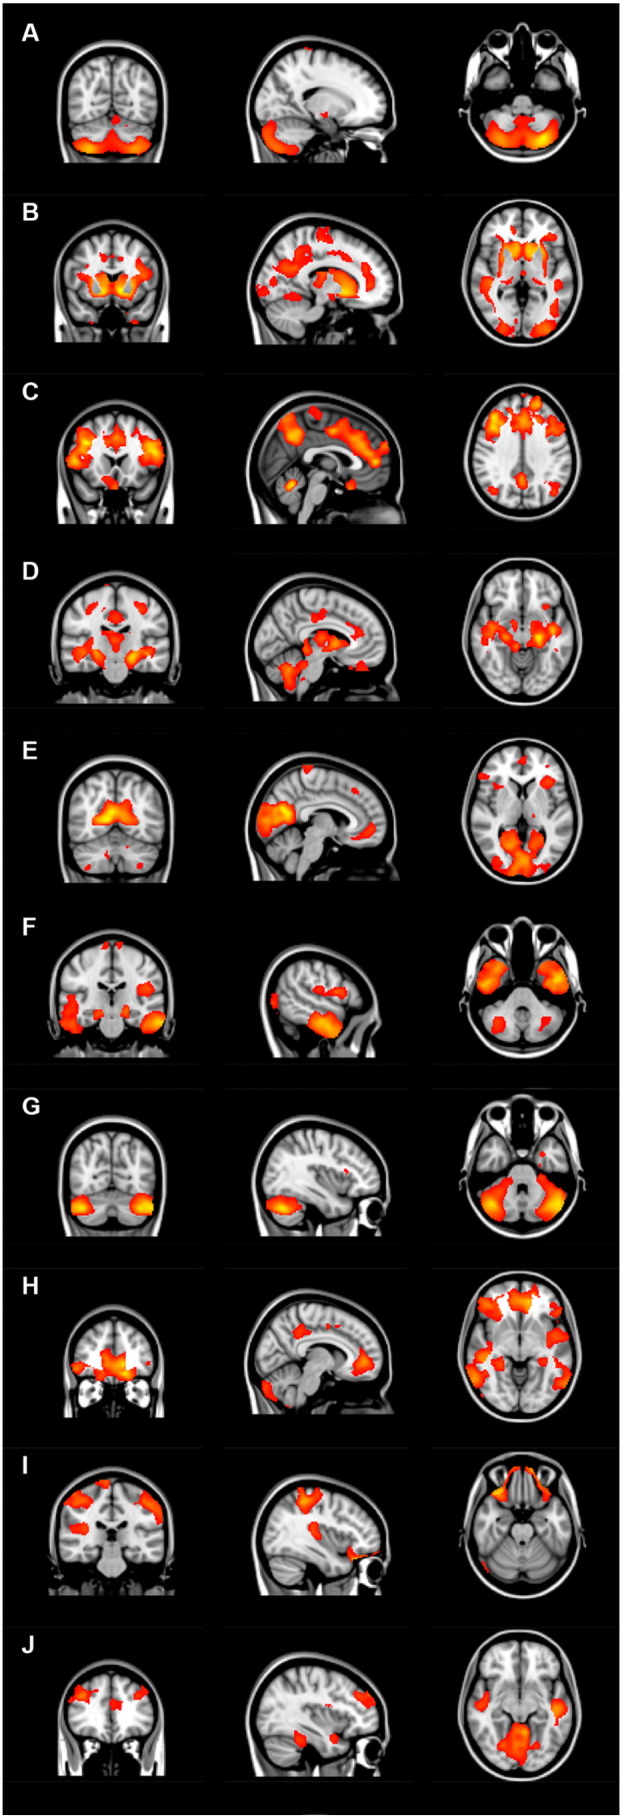
Overview of structural covariance networks. The ten identified anatomical networks are based on the structural covariance of grey matter among all participants. The networks are overlaid on sagittal, transversal and coronal slices of MNI-152 standard T1-weigthed images.
Table 3.
Identified anatomical brain networks.
| Brain cluster | Voxel size | Max T | MNI coordinates |
|||
|---|---|---|---|---|---|---|
| x | y | z | ||||
| Network A | Cerebellum | 12,110 | 16 | − 28 | − 76 | − 46 |
| Right putamen, right pallidum, right hippocampus and right amygdala | 233 | 4.66 | 28 | − 24 | − 4 | |
| Postcentral gyrus and precentral gyrus | 50 | 4.08 | 16 | − 32 | 80 | |
| Network B | Caudate nucleus, nucleus accumbens, pallidum, putamen and Precuneous | 37,999 | 7.55 | − 10 | 10 | − 4 |
| Anterior cingulate cortex | 349 | 3.4 | 16 | 44 | 4 | |
| Cerebellum | 189 | 2.25 | 22 | − 56 | − 60 | |
| Network C | Anterior cingulate cortex, supplementary motor cortex and middle and inferior frontal gyrus | 19,616 | 4.24 | 10 | − 4 | 44 |
| Precuneous, superior parietal lobule, lateral occipital cortex, posterior cingulate cortex, postcentral gyrus | 4747 | 4.06 | − 10 | − 62 | 48 | |
| Cerebellum | 2156 | 3.97 | 2 | − 58 | − 22 | |
| Superior and middle temporal gyrus | 649 | 2.93 | 42 | − 28 | 0 | |
| Network D | Hippocampus, parahippocampal gyrus, cerebellum, pallidum and planum polare | 16,112 | 6.66 | − 22 | − 24 | − 14 |
| Postcentral gyrus and precentral gyrus, superior parietal lobule, angular gyrus and supramarginal gyrus | 1012 | 3.91 | − 30 | − 28 | 50 | |
| Posterior and anterior cingulate gyrus, supplementary motor cortex | 881 | 3.46 | 4 | − 26 | 38 | |
| Insular cortex, caudate nucleus, frontal orbital cortex | 504 | 3.88 | 32 | 24 | − 4 | |
| Network E | Intracalcarine cortex, precuneous, cuneal cortex, lateral occipital cortex and lingual gyrus | 11,288 | 6.76 | 12 | − 64 | 8 |
| Frontal medial cortex, paracingulate cortex and subcallosal cortex | 833 | 3.26 | 10 | 52 | − 6 | |
| Frontal operculum cortex | 595 | 3.34 | − 38 | 26 | 8 | |
| Postcentral gyrus and precentral gyrus | 439 | 3.42 | − 10 | − 34 | 80 | |
| Cerebellum | 438 | 3.37 | 26 | − 48 | − 42 | |
| Thalamus | 196 | 3.2 | − 14 | − 28 | − 4 | |
| Network F | Middle and inferior temporal gyrus, temporal fusiform cortex | 7272 | 5.48 | 54 | − 10 | − 22 |
| Lingual gyrus, posterior cingulate gyrus, intracalcarine cortex and occipital fusiform gyrus | 3391 | 4.4 | − 14 | − 50 | 0 | |
| Frontal operculum cortex, precentral gyrus, parietal operculum cortex and frontal orbital cortex | 2432 | 3.86 | − 30 | 22 | 14 | |
| Superior frontal gyrus and paracingulate gyrus | 662 | 4.08 | 16 | 32 | 62 | |
| Cerebellum | 145 | 2.54 | 36 | − 62 | − 38 | |
| Network G | Cerebellum | 4555 | 9.34 | − 40 | − 66 | − 36 |
| Postcentral gyrus | 182 | 3.33 | 70 | − 4 | 12 | |
| Network H | Lateral occipital cortex, central opercular cortex, planum polare, inferior frontal gyrus, and supramarginal gyrus | 10,329 | 4.18 | − 54 | − 66 | 24 |
| Superior and middle temporal gyrus and angular gyrus | 8011 | 4.57 | 44 | − 26 | 0 | |
| Frontal medial cortex, paracingulate gyrus, frontal operculum cortex and insular cortex | 7214 | 5.32 | − 14 | 48 | − 16 | |
| Precuneous and cingulate cortex | 1721 | 3.62 | − 10 | − 40 | 44 | |
| Cerebellum | 885 | 2.91 | 4 | − 90 | − 34 | |
| Network I | Precuneous | 3337 | 3.58 | − 10 | − 52 | 56 |
| Precentral gyrus, Herschl's gyrus and central opercular cortex | 2608 | 3.87 | 52 | 0 | 30 | |
| Frontal orbital cortex | 2593 | 5.87 | 32 | 28 | − 26 | |
| Postcentral gyrus | 2518 | 3.99 | − 46 | − 34 | 50 | |
| Superior parietal lobule | 2289 | 4.65 | 40 | − 38 | 52 | |
| Cerebellum | 620 | 3.59 | − 26 | − 54 | − 42 | |
| Network J | Lingual gyrus, cerebellum, parahippocampal gyrus, and occipital fusiform gyrus | 5661 | 5.88 | 2 | − 78 | − 18 |
| Supramarginal gyrus, opercular cortex and postcentral gyrus | 4074 | 4.13 | 68 | − 36 | 38 | |
| Middle and inferior temporal gyrus | 2459 | 4.28 | − 48 | − 20 | − 10 | |
| Superior and middle frontal gyrus | 1629 | 4.29 | 44 | 38 | 32 | |
| Paracingulate gyrus | 591 | 3.59 | − 14 | 42 | 16 | |
Each anatomical network is divided into brain clusters, using a cluster tool integrated in FSL. Voxel size and MNI (Montreal Neurological Institute)-152 standard space image x-, y- and z-coordinates of each cluster are presented. Max T is the maximum T statistic of each local maximum. Structures displayed in bold are the largest structures identified in each anatomical network. Anatomical brain structures were identified using the Harvard-Oxford Atlas implemented in FSL.
Table 4.
Differences per anatomical network between controls compared to premanifest gene carriers and HD patients.
| Network | Unstandardized B (95% CI) | Standardized β | R2 | p-value | |
|---|---|---|---|---|---|
| A—Cerebellum | Premanifest Manifest |
− 0.003 (− 0.010 to 0.003) − 0.005 (− 0.011 to 0.001) |
− 0.148 − 0.227 |
0.141 0.153 |
0.269 0.079 |
| B—Caudate nucleus | Premanifest Manifest |
− 0.009 (− 0.015 to − 0.003) − 0.023 (− 0.029 to − 0.018) |
− 0.402 − 0.718 |
0.174 0.551 |
0.003 < 0.001 |
| C—Anterior cingulate cortex | Premanifest Manifest |
− 0.001 (− 0.009 to 0.007) − 0.001 (− 0.008 to 0.006) |
− 0.028 − 0.035 |
0.274 0.185 |
0.816 0.778 |
| D—Hippocampus | Premanifest Manifest |
− 0.008 (− 0.014 to − 0.001) − 0.009 (− 0.014 to − 0.004) |
− 0.300 − 0.376 |
0.168 0.330 |
0.023 0.001 |
| E—Intracalcarine cortex | Premanifest Manifest |
− 0.004 (− 0.011 to 0.002) − 0.007 (− 0.013 to − 0.001) |
− 0.177 − 0.281 |
0.143 0.118 |
0.180 0.032 |
| F—Temporal gyrus | Premanifest Manifest |
− 0.001 (− 0.007 to 0.004) − 0.002 (− 0.008 to 0.005) |
− 0.066 − 0.068 |
0.130 0.077 |
0.616 0.604 |
| G—Cerebellum | Premanifest Manifest |
0.002 (− 0.004 to 0.009) 0.003 (− 0.003 to 0.009) |
0.094 0.121 |
0.072 0.085 |
0.492 0.357 |
| H—Lateral occipital cortex | Premanifest Manifest |
0.000 (− 0.007 to 0.007) − 0.001 (− 0.008 to 0.006) |
− 0.017 − 0.044 |
0.034 0.015 |
0.902 0.745 |
| I—Precuneous | Premanifest Manifest |
0.003 (− 0.004 to 0.010) − 0.005 (− 0.011 to 0.001) |
0.127 − 0.216 |
0.033 0.057 |
0.361 0.110 |
| J—Lingual gyrus | Premanifest Manifest |
− 0.003 (− 0.010 to 0.005) − 0.004 (− 0.010 to 0.002) |
− 0.105 − 0.181 |
0.078 0.145 |
0.446 0.155 |
β = standardized Beta coefficient. Controls were compared to pre-HD and HD patients with adjustment for age and gender influences. Significant p-values (uncorrected p < 0.05) are displayed in bold.
3.4. Correlations of structural changes with clinical assessments
The caudate nucleus network, hippocampal network and intracalcarine network were selected to further assess the relationship with clinical scores, as these anatomical networks showed significant differences between controls and HD gene carriers. Six clinical assessments were analyzed in the HD gene carrier group and consisted of motor, functional and cognitive scores. CAG repeat length and disease burden score were used as a measurement of genetic burden in HD gene carriers. The caudate nucleus network showed a significant correlation with the TFC score and the UHDRS total motor score (Table 5). This means that a higher motor score is associated with a reduction in network integrity for this specific network. Significant correlations were also found with the caudate nucleus network and both CAG repeat length and disease burden score, meaning that a larger CAG repeat length and higher disease burden score are associated with a reduction in network integrity scores. Furthermore, all cognitive assessments showed a significant correlation with this network, i.e. the SDMT score, Stroop word reading test, TMT score and MMSE. The hippocampal network revealed no significant correlations with any of the clinical assessments or the measures of genetic burden. Two clinical assessments showed significant correlations with the intracalcarine network, the TFC score and the TMT score (Table 5). Furthermore, the disease burden score also showed a significant correlation with this network.
Table 5.
Correlations between changes in structural covariance networks and clinical assessments.
| Network B Caudate nucleus network |
Network D Hippocampus network |
Network E Visuomotor network |
Voxel-based grey matter volume changes |
|||||
|---|---|---|---|---|---|---|---|---|
| β | p-value | β | p-value | β | p-value | β | p-value | |
| UHDRS-TMS | − 0.519 | < 0.001 | 0.057 | ns | − 0.160 | ns | − 0.525 | < 0.001 |
| TFC | 0.329 | 0.002 | 0.019 | ns | 0.272 | 0.037 | 0.437 | < 0.001 |
| SDMT | 0.544 | < 0.001 | 0.152 | ns | 0.151 | ns | − 0.520 | < 0.001 |
| Stroop word reading | 0.410 | 0.001 | 0.171 | ns | 0.047 | ns | 0.330 | 0.003 |
| TMT | − 0.420 | 0.001 | − 0.109 | ns | − 0.258 | 0.049 | − 0.520 | < 0.001 |
| MMSE | 0.341 | 0.008 | 0.036 | ns | − 0.025 | ns | 0.348 | 0.002 |
| CAG repeat length | − 0.578 | < 0.001 | − 0.012 | ns | − 0.294 | ns | − 0.564 | < 0.001 |
| Disease burden | − 0.474 | < 0.001 | − 0.034 | ns | − 0.263 | 0.046 | − 0.452 | < 0.001 |
Significant correlations of motor, functional and cognitive assessments and genetic burden with structural covariance networks and voxel-based grey matter volume changes in HD gene carriers are presented.
Abbreviations: ns = not significant; β = standardized Beta coefficient; UHDRS-TMS = Unified Huntington's Disease Rating Scale-Total Motor Score; TFC = Total Functional Capacity score; SDMT = Symbol Digit Modality Test; TMT = Trail Making Test; MMSE = Mini Mental State Examination; CAG = cytosine, adenine, guanine; disease burden score = age × (CAG length − 35.5) by Penney et al. (1997).
The identified voxel-based anatomical regions of grey matter volume changes in HD were additionally used to assess relationships with clinical assessments in HD gene carriers. Overall, grey matter density values were significantly lower in manifest HD compared to controls and pre-HD (F(2,87) = 24.1, p < 0.001). For all clinical motor, functional and cognitive assessments, there was a significant correlation with grey matter density values in HD gene carriers (Table 5).
4. Discussion
In this study, we showed that identification of structural covariance networks revealed early grey matter changes in premanifest gene carriers and HD patients. In total, ten anatomical networks were identified in all participants. The regions of grey matter changes were located in two specific structural covariance networks, in which we found network integrity changes in both pre-HD and HD patients. One of these networks contained the basal ganglia, precuneous and anterior cingulate cortex, whereas the other network comprised of the hippocampus, parahippocampal gyrus, cingulate, insular, and sensorimotor cortices, superior parietal lobule, angular gyrus and frontal orbital cortex. One other network, the intracalcarine network, only showed a significant change in network integrity in HD patients, not in pre-HD, compared to controls. The other seven networks involving the cerebellum, temporal and frontal lobes showed no significant differences in network integrity between controls and pre-HD or HD patients.
The mean network integrity score describes the strength of group expression in each network with higher scores indicating strong group expression of the identified network.
Our findings suggest that there is a progressive increasing change of network integrity in grey matter structures from the premanifest phase, when motor symptoms are not yet present, to the manifest stage of the disease.
Network integrity changes found in both pre-HD and HD patients were located in a network containing the precuneous and anterior cingulate cortex. These structures are involved in motor planning, visuospatial processing, and cognitive attention and control (Cavanna, 2006, Wenderoth et al., 2005). As these motor and cognitive functions are known to be affected in HD (Lemiere et al., 2004, Tabrizi et al., 2013), this can explain the strong associations we found in HD gene carriers between this network and performances on motor and cognitive tasks. The identified hippocampal network comprised of cortical structures involved in working memory performance, emotion processing and motor control. Although we showed evidence for change in network integrity in this network in pre-HD and HD patients, there were no significant correlations with clinical assessments. One possible explanation might be that we assessed cognitive tasks that are not designed to measure the domains of working memory and emotion processing. Another possible explanation could be that changes in network integrity precede the clinical decline.
In HD, network-based analysis has been applied in one other recent study that investigated structural covariance networks in brain regions that are functionally related (Minkova et al., 2016). Here, in all pre-specified motor, working memory, cognitive flexibility, and social-affective networks there were no differences between controls and pre-HD observed (Minkova et al., 2016). In our study, however, we found evidence for early grey matter volume changes in two structural covariance networks in pre-HD compared to controls. This difference might be explained by the fact that we used patterns of co-variation in whole brain grey matter of the participants and were not restricted to pre-defined brain regions.
Further, we assessed correlations with our identified anatomical networks and genetic markers, such as CAG repeat length and disease burden. We found that a larger CAG repeat length and higher disease burden score in HD gene carriers were associated with a reduction in network integrity scores of the caudate nucleus network, suggesting that genetic markers might have an effect on the rate of disease progression. This is consistent with previous studies showing a larger CAG repeat length is associated more widespread atrophy (Gómez-Ansón et al., 2009, Penney et al., 1997, Ruocco et al., 2008).
In general, grey matter structural covariance networks showed to spatially overlap with resting-state functional connectivity networks (Seeley et al., 2009, Segall et al., 2012). It is suggested that the topological organization of anatomical networks reflect the pattern of functional organization of different networks, thus, regions that co-vary in grey matter volume may also be part of the same functional network (Montembeault et al., 2012, Seeley et al., 2009). The identified anatomical networks in our study also show similarity with resting state functional connectivity networks found in early HD patients in previous studies (Dumas et al., 2013, Poudel et al., 2014, Wolf et al., 2014).
Visual comparison of our identified networks with results from previous functional neuroimaging studies in HD show spatial overlap between the caudate nucleus network (B) and the functional striatal network, the anterior cingulate cortex network (C) and the executive control network, the hippocampal network (D) and the frontoparietal network, the intracalcarine network (E) and the functional visuomotor network, the temporal gyrus network and the functional medial temporal network, the lateral occipital network (H) and the default mode network, the precuneous network (I) and the sensorimotor network, the lingual gyrus network (J) and the auditory network, and the structural cerebellar networks (A and G) and the functional cerebellar network. Yet, more studies are needed to gain more knowledge about the relationship between structural networks and functional connectivity in HD.
To investigate whether identifying structural covariance networks is an effective approach to examine grey matter changes in HD, regional voxel-based analysis was additionally performed on the same data.
In pre-HD, previous voxel-based analysis studies revealed volume loss in the prefrontal cortex (Hobbs et al., 2010), insular cortex and parietal lobe (Gómez-Ansón et al., 2009). This is consistent with our regional analysis that showed limited cortical volume loss in pre-HD, located in the insular cortex, planum temporale, parietal operculum cortex and posterior supramarginal gyrus. However, our network-based analysis revealed that changes were also located in other brain regions like the precuneous, cingulate and sensorimotor cortices, and the parahippocampal gyrus. These results are consistent with previous studies on cortical thinning in early clinical disease stages (Rosas et al., 2005, Rosas et al., 2008). For the voxel-based regions that showed volume loss in HD gene carriers, mean grey matter density values were calculated and correlated with scores of clinical assessments. We found significant correlations between grey matter density values and motor, functional and cognitive assessments, as well as CAG repeat length and disease burden. Comparable significant correlations with these clinical assessments were also found in the caudate nucleus network, suggesting that network-based analysis is also sensitive in detecting correlations with clinical measures. Using univariate VBM, however, these correlations are based on voxel-wise differences in grey matter density. Therefore, it is difficult to directly compare the sensitivity of the univariate VBM approach with a multivariate network approach, based on the correlation with clinical assessments.
Nevertheless, based on the current results and previous reports, network-based analyses using structural covariance network with spatially independent regions might be a sensitive method in detecting early grey matter changes in HD as network integrity can change regardless of atrophy. Also, cognitive dysfunctions might not only be caused by localized brain damage, but of a impaired brain network as well (Hafkemeijer et al., 2016).
Still, more studies are needed to determine if structural covariance networks are reliable to be used as a standardized method for grey matter changes in HD.
4.1. Strengths and limitations
The strength of this current study lies in detecting whole brain networks by using the anatomical relationship between spatially distributed brain regions as covariance networks without using pre-defined regions of interest or analyzing voxels separately.
However, this study has a cross-sectional design, so a longitudinal follow-up study is preferred to further assess the relationship with disease progression. Additionally, larger sample sizes might provide more information about associations with clinical assessments. Another limitation of this study is the number of components or networks used in our analysis, which was chosen arbitrary (Cole et al., 2010). When choosing the number of components it is important to take into account that the sensitivity to detect regional effects can be affected and thus might influence outcomes (Hafkemeijer et al., 2014).
5. Conclusions
This study identified spatially independent grey matter regions that form different structural networks based on the co-variance of grey matter in healthy controls, pre-HD and HD patients. Our findings suggest that changes in grey matter volume are widespread, involve several brain regions, and are already detectable in the premanifest stage of the disease. Potentially, structural covariance networks might develop into an early biomarker for identifying grey matter changes in HD that could be used in future clinical trials. Additionally, it is important to understand large-scale anatomical networks in a neurodegenerative disorder like HD, as this might provide new insights into underlying cortical pathophysiological processes, which are still poorly understood.
Financial disclosures
E. Coppen reports that the institution received payment for the conduct of the TRACK-HD study by the CHDI Foundation, Inc.
J. van der Grond reports no disclosures.
A. Hafkemeijer reports grants outside the submitted work from the Netherlands Initiative Brain and Cognition (NIHC), a part of the Netherlands Organization for Scientific Research (NWO), grant number 05613010.
S. Rombouts reports no disclosures.
R. Roos reports that the institution received payment for the conduct of the TRACK-HD study by the CHDI Foundation, Inc. and reports receiving payment from the Gossweiler Foundation and Teva Pharma outside the submitted work.
Acknowledgements
This study was supported by the CHDI/High Q Foundation Inc., a not for profit organization dedicated to finding treatments for Huntington's disease.
The authors would like to thank Prof S. Tabrizi, global principal investigator for the Track-HD study and clinical site principal investigator for University College London. The authors also would like to thank all the Track-HD investigators for collecting the data and all patients and their relatives who participated in this study. Furthermore, the authors would like to thank M. Jacobs, MSc for advising on the content of this manuscript.
Contributor Information
Emma M. Coppen, Email: E.M.Coppen@lumc.nl.
Jeroen van der Grond, Email: j.van_der_grond@lumc.nl.
Anne Hafkemeijer, Email: a.hafkemeijer@lumc.nl.
Serge A.R.B. Rombouts, Email: s.a.r.b.rombouts@lumc.nl.
Raymund A.C Roos, Email: r.a.c.roos@lumc.nl.
References
- Andersson J.L.R., Jenkinson M., Smith S. FMRIB Technical Report TRO7JA2. 2007. Non-Linear Registration Aka Spatial Normalisation. [Google Scholar]
- Ashburner J., Friston K.J. Voxel-based morphometry—the methods. NeuroImage. 2000;11:805–821. doi: 10.1006/nimg.2000.0582. [DOI] [PubMed] [Google Scholar]
- Aylward E.H. Magnetic resonance imaging striatal volumes: a biomarker for clinical trials in Huntington's disease. Mov. Disord. 2014;29:1429–1433. doi: 10.1002/mds.26013. [DOI] [PMC free article] [PubMed] [Google Scholar]
- Aylward E., Sparks B., Field K., Yallapragada V., Shpritz B., Rosenblatt A., Brandt J., Gourley L., Liang K., Zhou H., Margolis R., Ross C. Onset and rate of striatal atrophy in preclinical Huntington disease. Neurology. 2004;63:66–72. doi: 10.1212/01.wnl.0000132965.14653.d1. [DOI] [PubMed] [Google Scholar]
- Beckmann C.F., Smith S.M. Probabilistic independent component analysis for functional magnetic resonance imaging. IEEE Trans. Med. Imaging. 2004;23:137–152. doi: 10.1109/TMI.2003.822821. [DOI] [PubMed] [Google Scholar]
- Beckmann C.F., DeLuca M., Devlin J.T., Smith S.M. Investigations into resting-state connectivity using independent component analysis. Philos. Trans. R. Soc. 2005;360:1001–1013. doi: 10.1098/rstb.2005.1634. [DOI] [PMC free article] [PubMed] [Google Scholar]
- Cavanna A.E. The precuneus: a review of its functional anatomy and behavioural correlates. Brain. 2006;129:564–583. doi: 10.1093/brain/awl004. [DOI] [PubMed] [Google Scholar]
- Cole D.M., Smith S.M., Beckmann C.F. Advances and pitfalls in the analysis and interpretation of resting-state FMRI data. Front. Syst. Neurosci. 2010;4:1–15. doi: 10.3389/fnsys.2010.00008. [DOI] [PMC free article] [PubMed] [Google Scholar]
- De la Monte S., Vonsattel J., Richardson E. Morphometric demonstration of atrophic changes in cerebral cortex, white matter and neostriatum in Huntington's disease. J. Neuropathol. Exp. Neurol. 1988;47:516–525. doi: 10.1097/00005072-198809000-00003. [DOI] [PubMed] [Google Scholar]
- Dogan I., Eickhoff S.B., Schulz J.B., Shah N.J., Laird A.R., Fox P.T., Reetz K. Consistent neurodegeneration and its association with clinical progression in Huntington's disease: a coordinate-based meta-analysis. Neurodegener. Dis. 2013;12:23–35. doi: 10.1159/000339528. [DOI] [PMC free article] [PubMed] [Google Scholar]
- Douaud G., Gaura V., Ribeiro M.J., Lethimonnier F., Maroy R., Verny C., Krystkowiak P., Damier P., Bachoud-Levi A.C., Hantraye P., Remy P. Distribution of grey matter atrophy in Huntington's disease patients: a combined ROI-based and voxel-based morphometric study. NeuroImage. 2006;32:1562–1575. doi: 10.1016/j.neuroimage.2006.05.057. [DOI] [PubMed] [Google Scholar]
- Dumas E.M., van den Bogaard S.J.A., Hart E.P., Soeter R.P., van Buchem M.A., Van Der Grond J., Rombouts S.A.R.B., Roos R.A.C. Reduced functional brain connectivity prior to and after disease onset in Huntington's disease. NeuroImage Clin. 2013;2:377–384. doi: 10.1016/j.nicl.2013.03.001. [DOI] [PMC free article] [PubMed] [Google Scholar]
- Gómez-Ansón B., Alegret M., Muñoz E., Monté G.C., Alayrach E., Sánchez A., Boada M., Tolosa E. Prefrontal cortex volume reduction on MRI in preclinical Huntington's disease relates to visuomotor performance and CAG number. Parkinsonism Relat. Disord. 2009;15:213–219. doi: 10.1016/j.parkreldis.2008.05.010. [DOI] [PubMed] [Google Scholar]
- Good C., Johnsrude I., Ashburner J., Henson R., Friston K., Frackowiak R. A voxel-based morphometric study of ageing in 465 normal adult human brains. NeuroImage. 2001;14:21–36. doi: 10.1006/nimg.2001.0786. [DOI] [PubMed] [Google Scholar]
- Hafkemeijer A., Altmann-Schneider I., de Craen A.J.M., Slagboom P.E., van der Grond J., Rombouts S.A.R.B. Associations between age and gray matter volume in anatomical brain networks in middle-aged to older adults. Aging Cell. 2014;13:1068–1074. doi: 10.1111/acel.12271. [DOI] [PMC free article] [PubMed] [Google Scholar]
- Hafkemeijer A., Möller C., Dopper E.G.P., Jiskoot L.C., van den Berg-Huysmans A.A., van Swieten J.C., van der Flier W.M., Vrenken H., Pijnenburg Y.A.L., Barkhof F., Scheltens P., van der Grond J., Rombouts S.A.R.B. Differences in structural covariance brain networks between behavioral variant frontotemporal dementia and Alzheimer's disease. Hum. Brain Mapp. 2016;988:978–988. doi: 10.1002/hbm.23081. [DOI] [PMC free article] [PubMed] [Google Scholar]
- Hobbs N.Z., Henley S.M.D., Ridgway G.R., Wild E.J., Barker R.A., Scahill R.I., Barnes J., Fox N.C., Tabrizi S.J. The progression of regional atrophy in premanifest and early Huntington's disease: a longitudinal voxel-based morphometry study. J. Neurol. Neurosurg. Psychiatry. 2010;81:756–763. doi: 10.1136/jnnp.2009.190702. [DOI] [PubMed] [Google Scholar]
- Huntington Study Group Unified Huntington's disease rating scale: reliability and consistency. Mov. Disord. 1996;11:136–142. doi: 10.1002/mds.870110204. [DOI] [PubMed] [Google Scholar]
- Jenkinson M., Bannister P., Brady M., Smith S. Improved optimization for the robust and accurate linear registration and motion correction of brain images. NeuroImage. 2002;17:825–841. doi: 10.1016/s1053-8119(02)91132-8. [DOI] [PubMed] [Google Scholar]
- Kassubek J., Juengling F.D., Ecker D., Landwehrmeyer G.B. Thalamic atrophy in Huntington's disease co-varies with cognitive performance: a morphometric MRI analysis. Cereb. Cortex. 2005;15:846–853. doi: 10.1093/cercor/bhh185. [DOI] [PubMed] [Google Scholar]
- Lemiere J., Decruyenaere M., Evers-Kiebooms G., Vandenbussche E., Dom R. Cognitive changes in patients with Huntington's disease (HD) and asymptomatic carriers of the HD mutation—a longitudinal follow-up study. J. Neurol. 2004;251:935–942. doi: 10.1007/s00415-004-0461-9. [DOI] [PubMed] [Google Scholar]
- Minkova L., Eickhoff S.B., Abdulkadir A., Kaller C.P., Peter J., Scheller E., Lahr J., Roos R.A., Durr A., Leavitt B.R., Tabrizi S.J., Klöppel S. Large-scale brain network abnormalities in Huntington's disease revealed by structural covariance. Hum. Brain Mapp. 2016;37:67–80. doi: 10.1002/hbm.23014. [DOI] [PMC free article] [PubMed] [Google Scholar]
- Montembeault M., Joubert S., Doyon J., Carrier J., Gagnon J.F., Monchi O., Lungu O., Belleville S., Brambati S.M. The impact of aging on gray matter structural covariance networks. NeuroImage. 2012;63:754–759. doi: 10.1016/j.neuroimage.2012.06.052. [DOI] [PubMed] [Google Scholar]
- Paulsen J.S., Langbehn D.R., Stout J.C., Aylward E., Ross C.A., Nance M., Guttman M., Johnson S., MacDonald M., Beglinger L.J., Duff K., Kayson E., Biglan K., Shoulson I., Oakes D., Hayden M. Detection of Huntington's disease decades before diagnosis: the predict-HD study. J. Neurol. Neurosurg. Psychiatry. 2008;79:874–880. doi: 10.1136/jnnp.2007.128728. [DOI] [PMC free article] [PubMed] [Google Scholar]
- Peinemann A., Schuller S., Pohl C., Jahn T., Weindl A., Kassubek J. Executive dysfunction in early stages of Huntington's disease is associated with striatal and insular atrophy: a neuropsychological and voxel-based morphometric study. J. Neurol. Sci. 2005;239:11–19. doi: 10.1016/j.jns.2005.07.007. [DOI] [PubMed] [Google Scholar]
- Penney J., Vonsattel J.P., MacDonald M., Gusella J.F., Myers R.H. CAG repeat number governs the development rate of pathology in Huntington's disease. Ann. Neurol. 1997;41:689–692. doi: 10.1002/ana.410410521. [DOI] [PubMed] [Google Scholar]
- Poudel G.R., Egan G.F., Churchyard A., Chua P., Stout J.C., Georgiou-Karistianis N. Abnormal synchrony of resting state networks in premanifest and symptomatic Huntington disease: the IMAGE-HD study. J. Psychiatry Neurosci. 2014;39:87–96. doi: 10.1503/jpn.120226. [DOI] [PMC free article] [PubMed] [Google Scholar]
- Rombouts S.A.R.B., Damoiseaux J.S., Goekoop R., Barkhof F., Scheltens P., Smith S.M., Beckmann C.F. Model-free group analysis shows altered BOLD FMRI networks in dementia. Hum. Brain Mapp. 2009;30:256–266. doi: 10.1002/hbm.20505. [DOI] [PMC free article] [PubMed] [Google Scholar]
- Roos R.A.C. Huntington's disease: a clinical review. Orphanet J. Rare Dis. 2010;5:40. doi: 10.1186/1750-1172-5-40. [DOI] [PMC free article] [PubMed] [Google Scholar]
- Rosas H.D., Hevelone N.D., Zaleta A.K., Greve D.N., Salat D.H., Fischl B. Regional cortical thinning in preclinical Huntington disease and its relationship to cognition. Neurology. 2005;65:745–747. doi: 10.1212/01.wnl.0000174432.87383.87. [DOI] [PubMed] [Google Scholar]
- Rosas H.D., Salat D.H., Lee S.Y., Zaleta A.K., Pappu V., Fischl B., Greve D., Hevelone N., Hersch S.M. Cerebral cortex and the clinical expression of Huntington's disease: complexity and heterogeneity. Brain. 2008;131:1057–1068. doi: 10.1093/brain/awn025. [DOI] [PMC free article] [PubMed] [Google Scholar]
- Ruocco H.H., Bonilha L., Li L.M., Lopes-Cendes I., Cendes F. Longitudinal analysis of regional grey matter loss in Huntington disease: effects of the length of the expanded CAG repeat. J. Neurol. Neurosurg. Psychiatry. 2008;79:130–135. doi: 10.1136/jnnp.2007.116244. [DOI] [PubMed] [Google Scholar]
- Seeley W.W., Crawford R.K., Zhou J., Miller B.L., Greicius M.D. Neurodegenerative diseases target large-scale human brain networks. Neuron. 2009;62:42–52. doi: 10.1016/j.neuron.2009.03.024. [DOI] [PMC free article] [PubMed] [Google Scholar]
- Segall J.M., Allen E.A., Jung R.E., Erhardt E.B., Arja S.K., Kiehl K., Calhoun V.D. Correspondence between structure and function in the human brain at rest. Front. Neuroinform. 2012;6:1–17. doi: 10.3389/fninf.2012.00010. [DOI] [PMC free article] [PubMed] [Google Scholar]
- Smith S.M. Fast robust automated brain extraction. Hum. Brain Mapp. 2002;17:143–155. doi: 10.1002/hbm.10062. [DOI] [PMC free article] [PubMed] [Google Scholar]
- Smith S.M., Nichols T.E. Threshold-free cluster enhancement: addressing problems of smoothing, threshold dependence and localisation in cluster inference. NeuroImage. 2009;44:83–98. doi: 10.1016/j.neuroimage.2008.03.061. [DOI] [PubMed] [Google Scholar]
- Smith S.M., Jenkinson M., Woolrich M.W., Beckmann C.F., Behrens T.E.J., Johansen-Berg H., Bannister P.R., De Luca M., Drobnjak I., Flitney D.E., Niazy R.K., Saunders J., Vickers J., Zhang Y., De Stefano N., Brady J.M., Matthews P.M. Advances in functional and structural MR image analysis and implementation as FSL. NeuroImage. 2004;23:S208–S219. doi: 10.1016/j.neuroimage.2004.07.051. [DOI] [PubMed] [Google Scholar]
- Tabrizi S.J., Langbehn D.R., Leavitt B.R., Roos R.A.C., Durr A., Craufurd D., Kennard C., Hicks S.L., Fox N.C., Scahill R.I., Borowsky B., Tobin A.J., Rosas H.D., Johnson H., Reilmann R., Landwehrmeyer B., Stout J.C. Biological and clinical manifestations of Huntington's disease in the longitudinal TRACK-HD study: cross-sectional analysis of baseline data. Lancet Neurol. 2009;8:791–801. doi: 10.1016/S1474-4422(09)70170-X. [DOI] [PMC free article] [PubMed] [Google Scholar]
- Tabrizi S.J., Scahill R.I., Owen G., Durr A., Leavitt B.R., Roos R.A.C., Borowsky B., Landwehrmeyer B., Frost C., Johnson H., Craufurd D., Reilmann R., Stout J.C., Langbehn D.R. Predictors of phenotypic progression and disease onset in premanifest and early-stage Huntington's disease in the TRACK-HD study: analysis of 36-month observational data. Lancet Neurol. 2013;12:637–649. doi: 10.1016/S1474-4422(13)70088-7. [DOI] [PubMed] [Google Scholar]
- The Huntington's Disease Collaborative Research Group A novel gene containing a trinucleotide repeat that is expanded and unstable on Huntington's disease chromosomes. Cell. 1993;72:971–983. doi: 10.1016/0092-8674(93)90585-e. [DOI] [PubMed] [Google Scholar]
- Thieben M.J., Duggins A.J., Good C.D., Gomes L., Mahant N., Richards F., McCusker E., Frackowiak R.S.J. The distribution of structural neuropathology in pre-clinical Huntington's disease. Brain. 2002;125:1815–1828. doi: 10.1093/brain/awf179. [DOI] [PubMed] [Google Scholar]
- van den Bogaard S.J.A., Dumas E.M., Acharya T.P., Johnson H., Langbehn D.R., Scahill R.I., Tabrizi S.J., Van Buchem M.A., Van Der Grond J., Roos R.A.C. Early atrophy of pallidum and accumbens nucleus in Huntington's disease. J. Neurol. 2011;258:412–420. doi: 10.1007/s00415-010-5768-0. [DOI] [PMC free article] [PubMed] [Google Scholar]
- Wenderoth N., Debaere F., Sunaert S., Swinnen S.P. The role of anterior cingulate cortex and precuneus in the coordination of motor behaviour. Eur. J. Neurosci. 2005;22:235–246. doi: 10.1111/j.1460-9568.2005.04176.x. [DOI] [PubMed] [Google Scholar]
- Whitwell J.L., Josephs K.A. Voxel-based morphometry and its application to movement disorders. Parkinsonism Relat. Disord. 2007;13:S406–S416. doi: 10.1016/S1353-8020(08)70039-7. [DOI] [PubMed] [Google Scholar]
- Winkler A.M., Ridgway G.R., Webster M.A., Smith S.M., Nichols T.E. Permutation inference for the general linear model. NeuroImage. 2014;92:381–397. doi: 10.1016/j.neuroimage.2014.01.060. [DOI] [PMC free article] [PubMed] [Google Scholar]
- Wolf R.C., Sambataro F., Vasic N., Depping M.S., Thomann P.A., Landwehrmeyer G.B., Süssmuth S.D., Orth M. Abnormal resting-state connectivity of motor and cognitive networks in early manifest Huntington's disease. Psychol. Med. 2014;1–16 doi: 10.1017/S0033291714000579. [DOI] [PubMed] [Google Scholar]
- Xu L., Groth K.M., Pearlson G., Schretlen D.J., Calhoun V.D. Source-based morphometry: the use of independent component analysis to identify gray matter differences with application to schizophrenia. Hum. Brain Mapp. 2009;30:711–724. doi: 10.1002/hbm.20540. [DOI] [PMC free article] [PubMed] [Google Scholar]