Abstract
Background:
Point-of-care (POC) testing of HbA1c is used as a time-efficient tool to improve treatment and management planning for diabetes in the clinic setting. HbA1c values are the basis for monitoring ongoing response to treatment and to make adjustments to diabetes therapy. Yet, there is ongoing controversy as to the accuracy of POC assays. Diabetes is a lifelong disease, so comparability of results over a long period of time is needed to follow the response to treatment.
Methods:
We compared the Afinion™ automated boronate affinity assay and the DCA Vantage immunoassay-based POC techniques to the Tosoh G8 and Bio-Rad Variant II ion-exchange high-performance liquid chromatography (HPLC) central laboratory methods in a study lasting 3 years. College of American Pathology Survey results and American Proficiency testing were utilized to assess the external validity of the POC techniques.
Results:
Despite high correlations among the 4 techniques, there were significant and variable differences obtained over time. The Biorad values varied from 0.1 to 0.4% higher than the Afinion values. The DCA results were usually higher than the Afinion values, but fell below the Afinion results in the last 6 months of our study. Both POC techniques gave systematically lower values than the Tosoh measurements, and both the POC and the central laboratory measurements showed variable differences from the National Glycohemoglobin Standardization Program values over the duration of this study.
Conclusions:
All who rely on POC methods as well as on central laboratory measurement of HbA1c must understand the potential limitations of these assays. The assessment of diabetes blood sugar control should proceed from the evaluation of HbA1c combined with review of plasma glucose and of self-monitored blood glucose values.
Keywords: HbA1c, point of care, HPLC
With evolving laboratory technology and, in particular, miniaturization of processes and reduction in required sample size, point-of-care (POC) measurement has become a key modality to provide rapid information needed for clinical decisions. Benefits of POC testing include greater convenience, immediate feedback to patient and physician at the time of a clinical visit, elimination of repeat visits to review and act on laboratory results, and improvement in patient motivation, with greater patient satisfaction.1-4 HbA1c levels provide a long-term gauge of the success of treatment. A trial which compared immediate feedback of HbA1c results to delayed laboratory results for patients with type 1 and 2 diabetes attending an academic diabetes center found significant improvement in glycemic control at 6 and 12 months with the POC procedure,5 and a similar study in an urban primary care clinic arrived at the same conclusion.6 A primary care study among patients receiving active insulin titration (weekly monitoring) showed POC HbA1c testing resulted in a greater proportion achieving HbA1c < 7.0% compared to those who had central laboratory measurement of HbA1c.7 In a long-term study lasting 5 years at the University of Texas, the average HbA1c dropped from 8.1 ± 1.8% to 7.4 ± 1.5% after introduction of POC testing in their diabetes center in comparison to no reduction in the Family Medicine Clinic which used central laboratory HbA1c measurements.8
Yet, despite the benefits of POC HbA1c, there has been active controversy as to the accuracy of the assays.9,10 A 2010 study found that 6 of 8 POC devices did not meet standards,11 and a repeat study in 2014 reported that 3 of 7 devices still failed performance criteria.12 Nevertheless, there are 2 POC techniques, the Afinion boronate affinity method and the DCA Vantage immunoturbidometric procedure, which have consistently performed well on comparison testing.13-16 These 2 techniques have also been compared to one another. In a study of 700 pediatric patients, each subject’s HbA1C was measured locally using the Afinion and DCA devices, and by a central laboratory (University of Minnesota) using a Tosoh high-performance liquid chromatography (HPLC) method. In the patient samples measured at the 7 clinic sites, the Afinion generated higher A1C results than the HPLC (mean difference = +0.15, P < .001), while the DCA produced lower values (mean difference = −0.19, P < .001). These differences were felt to be clinically insignificant. Yet, even with these 2 well validated POC devices, there have been criticisms including lot to lot variation and nonlinearity of results.9,17-19
There have been continued efforts to standardize the HbA1c assay. Early studies showed that the many methods used to measure HbA1c produced disparate results.20 The National Glycohemoglobin Standardization Program (NGSP) was implemented in 1996 to standardize HbA1c results to those of the Diabetes Control and Complications Trial/ United Kingdom Prospective Diabetes Study (DCCT/UKPDS), which used an HPLC technique as the gold standard assay.21 This program is used to certify manufacturers of HbA1c methods as traceable to the DCCT.22 For HbA1c standardization, a network of reference laboratories is calibrated to the DCCT Reference values. The NGSP network consists of the central primary reference laboratory (CPRL), 3 primary reference laboratories (PRLs), and 7 secondary reference laboratories (SRLs). PRLs and SRLs are located both in Europe, Japan, and the United States.23 The CPRL method is the DCCT/EDIC (Diabetes Control and Complications Trial/Epidemiology of Diabetes Interventions and Complications) Bio-Rex 70 HPLC reference method. The PRLs, which use the same method as the CPRL, function as backup laboratories. The SRLs use a variety of commercial methods based on ion-exchange HPLC immunoassay, boronate-affinity HPLC, or capillary electrophoresis. NGSP compliant network laboratories are monitored monthly by using 10 pooled whole blood samples frozen at -700 C spanning the range of 4%-10%. These calibrators are compared monthly to each other and to the original DCCT reference. This reference has been shown to be consistent over 30 years using overlapping frozen hemolysates.24 To pass the NGSP monitoring exercise, the standard deviation of the difference between sample replicates must not exceed 0.229% HbA1c. In addition, the mean of the differences between an individual network laboratory and the CPRL must not exceed 0.35% HbA1c. The function of the NGSP is to standardize HbA1c and ensure that results from clinical laboratories match those of the DCCT. The NGSP assists manufacturers with calibrating their assays, has a formal certification process and monitors performance of HbA1c testing in the field via the College of American Pathologists (CAP) survey which uses fresh whole blood. This program has been successful in reducing variability in HbA1c results.
In the clinical setting, the value of HbA1c is in comparing the degree of cumulative hyperglycemia experienced by the individual patient at serial points in time to guide changes in the therapeutic regimen. It is essential to have comparability of values over extended time periods. The use of POC devices to measure HbA1c is widespread in diabetes clinics, so we need to know how well POC devices perform over the long-term course of treatment. We assessed the reliability of 2 POC HbA1c assay techniques in a real world clinic setting over a 3-year period, comparing the results to 2 central laboratory techniques.
Materials and Methods
We compared results obtained with the 2 most commonly used POC techniques, the Axis-Shield Afinion hemoglobin A1c device (Afinion) boronate affinity assay and the DCA Vantage immunoturbidometric procedure (DCA) on unselected samples from patients participating in various clinical research protocols. All patients agreed to participate in these protocols and provided signed informed consent. HbA1c determinations in these protocols were performed by large central labs typically using either the Tosoh G8 HPLC Analyzer or the Bio-Rad Variant II, both ion exchange HPLC techniques. The central lab samples were obtained from 4 ml venous blood samples. Microliter volumes were withdrawn from these samples and assayed using both POC techniques. The use of these small blood samples was approved by the Creighton Institutional Review Board and did not require separate additional consent. All HbA1c samples were subjected to simultaneous assay with the Afinion and the DCA procedures as well as the central lab technique utilized for the various protocols. Results throughout are expressed as percentage HbA1c.
Axis Shield Afinion Hemoglobin A1c Measurement
Afinion™ HbA1c is a fully automated boronate affinity assay for the determination of the percentage of hemoglobin A1c in human whole blood.25 A 1.5 µl blood sample is introduced into the Test Cartridge which is placed in the chamber of the Afinion AS100 Analyzer where it is automatically diluted and mixed with a solution which lyses erythrocytes, releasing hemoglobin. This sample mixture is transferred to a blue labeled boronic acid conjugate, which binds to the cis-diols of glycated hemoglobin. This reaction mixture is soaked through a filter membrane which collects conjugate-bound and unbound hemoglobin (glycated and nonglycated hemoglobin). Excess conjugate is removed with a washing reagent. The Analyzer reflectance meter separately measures the blue (glycated hemoglobin) and the red (total hemoglobin) color intensities. The ratio of the 2 color intensities is proportional to the percentage of HbA1c in the sample.
DCA Vantage POC HbA1c Technique
The DCA Vantage, unlike the Afinion method, is immunoassay based.26 A 1 µl whole blood sample is added to the reagent cartridge which is inserted into the DCA Vantage™ Analyzer. Within the cartridge, potassium ferricyanide oxidizes hemoglobin in the sample to methemoglobin which complexes with thiocyanate to form thiocyanmethemoglobin. The Analyzer spectrophotometer measures the intensity of the light transmitted by thiocyanmethemoglobin. The extent of color development at 531 nm is proportional to the concentration of total hemoglobin in the sample. A synthetic polymer containing multiple copies of the immunoreactive portion of HbA1c is used to cause agglutination of latex coated with HbA1c specific mouse monoclonal antibody. This agglutination causes increased scattering of light, measured as an increase in absorbance at 531 nm. HbA1c in whole blood specimens competes for the limited number of antibody-latex binding sites causing an inhibition of agglutination which is measured as a decrease in absorbance. The HbA1c concentration is then quantified using a calibration curve of absorbance versus HbA1c concentration.
The Tosoh Automated Glycohemoglobin Analyzer HLC-723G8
This is an HPLC technique using nonporous ion exchange.27 The analyzer dilutes the whole blood specimen (3 uL) and then injects a small volume of this specimen onto the TSKgel G8 Variant HSi column. Separation is achieved by utilizing differences in ionic interactions between the cation exchange group on the column resin surface and the hemoglobin components. The hemoglobin fractions (designated as A1a, A1b, F, LA1c+, SA1c, A0, and H-V0, H-V1, HV2) are subsequently removed from the column by performing a step-wise elution using varied salt concentrations in the Variant Elution Buffers. The separated hemoglobin components pass through an LED photometer flow cell which measures changes in absorbance at 415 nm. The analyzer integrates each peak. The total area of the A1c peak is divided by the sum of the total areas of all peaks to compute the HbA1c percentage.
The Bio-Rad Variant II Turbo Hemoglobin A1c
The Bio-Rad Variant II likewise utilizes an ion-exchange HPLC.28 The samples are automatically diluted and injected into the analytical cartridge. The Variant II Turbo Chromatographic Station (VCS) dual pumps deliver a programmed buffer gradient of increasing ionic strength to the cartridge, where the hemoglobins are separated based on their ionic interactions with the cartridge material similar to the Tosoh procedure. The absorbance at 415 nm is measured and the peak ratio of HbA1c to total Hemoglobin is calculated.
POC Control Procedures
The Afinion and DCA procedures are packaged in specific kits, manufactured in lots, with control samples provided. These control samples have been measured by the manufacturer, and average values with permissible upper and lower bounds are provided. Controls were run in our lab in replicate for each lot. In addition, our laboratory participated in the Lab Advantage Program of the American Proficiency Institute.29 This program provides control samples as “unknowns.” These unknowns are typically samples with either a high or a low value. Different samples are provided for each analytic technique. We assay these unknowns in replicate and send the results for evaluation to the Program which analyzes the results provided by many laboratories and reports a mean and a permissible range for each separate technique. The College of American Pathologists (CAP) carries out surveys of NGSP certified techniques using reference standards as part of the NGSP protocol at the reference lab network. The difference in assay values from the reference values is termed the “bias” of the assay. The bias calculation is performed for 3 levels of pooled fresh blood samples: a low, midrange and high. The CAP survey analysis is performed twice annually with 5 different sample groups.
Results
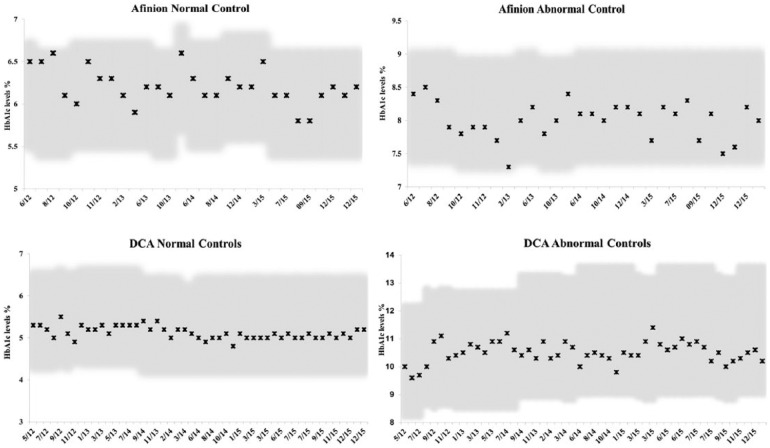
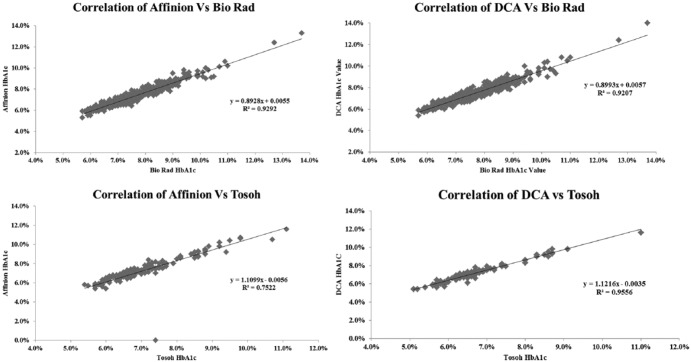
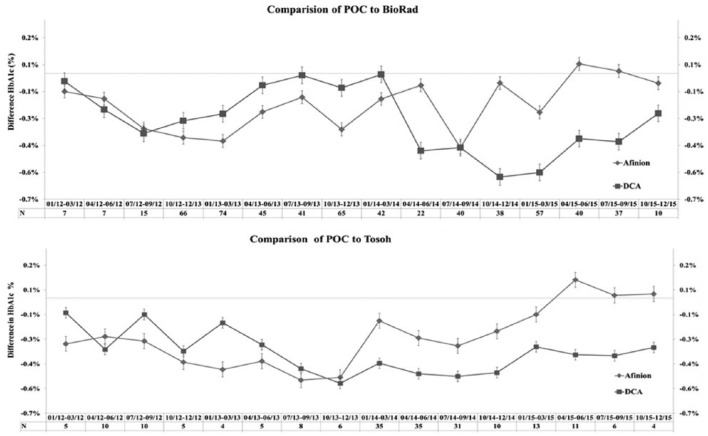
Our results for control samples for the 2 POC techniques were well within the established permissible deviation for each assay (Figure 1), and results submitted to the American Proficiency quality assurance program were in range at all times in the 3-year course of our study (Figure 2). There was a high correlation between values obtained on the DCA Vantage and the Afinion devices (Figure 3), and the 2 POC techniques showed high correlation with the 2 central lab techniques (Figure 4). Despite the high correlations, there were clear differences in the values obtained on individual samples with the 2 POC devices, and the values also differed from the central lab techniques. Furthermore, these differences were quite variable over time. The Biorad values varied from 0.1 to 0.4% higher than the Afinion values (Figure 5a). The DCA results were usually higher than the Afinion values; except in the last 6 months of our study, the DCA measurements fell below the Afinion results, and as much as 0.6% lower than the Biorad values. Both POC techniques gave systematically lower values than the Tosoh measurements (Figure 5b).
Figure 1.
Normal and abnormal control values for the POC assays. (a) Afinion normal control values. The values obtained for each control lot are plotted for each date assayed. The permissible range supplied by the manufacturer is the shaded area. (b) Afinion abnormal control values. (c) DCA normal control values. (d) DCA abnormal control values.
Figure 2.
Proficiency test results for Afinion and DCA POC devices. Two different unknown samples (A) and (B) are provided by the American Proficiency Institute for each analysis period. These samples are run in replicate and the results are sent to the central lab. At each time point, the measurements were within the range defined by the upper and lower bound of the unknown samples. (a, b) DCA device. (c, d) Afinion device. The shaded area is the permissible range.
Figure 3.
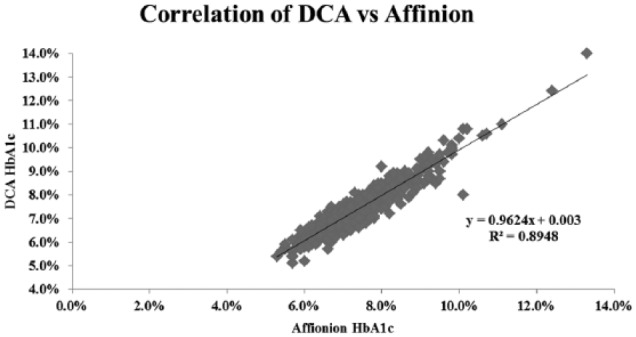
Correlation of HbA1c results determined with the Afinion to those with the DCA techniques. There was a strong linear correlation throughout the A1c range (R2 = .89, N = 616).
Figure 4.
Correlation of Afinion and DCA values with Tosoh and Biorad determinations. (a) Afinion versus Tosoh measurements (R2 = .75, N = 167). (b) Afinion versus Biorad measurements (R2 = .93, N = 449). (c) DCA versus Tosoh measurements (R2 = .96, N = 167). (d) DCA versus Biorad measurements (R2 = .92, N = 449).
Figure 5.
Comparison of HbA1c values on Afinion and DCA to central lab values. (a) Afinion (diamond) and DCA (square) values were compared for each sample with the Biorad results over each 3-month period. The difference (either positive or negative) from the Biorad result for each sample is graphed for the 2 techniques. The number of total samples (N) for each 3-month comparison is listed. (b) Comparison of Afinion and DCA values to Tosoh results.
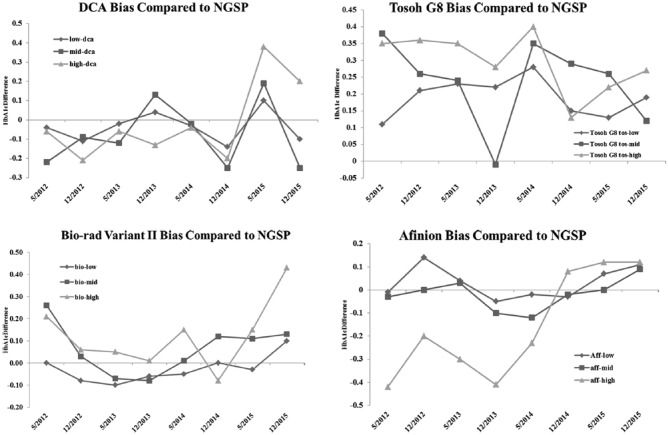
We graphed the published bias values for the 2 POC and the 2 central lab techniques. During the 3-year time period of our study, the reported bias values for the DCA and the Afinion techniques were quite variable (Figure 6). The Afinion values for the low and midrange HbA1c samples were always within 0.1% of the NGSP reference, but the high range samples went from as low as 0.4% less than the acceptable range at the beginning of our study to a positive value at the end. During the same period, the DCA comparisons to the CAP sample results from the NGSP varied from as much as 0.15% higher for the midrange samples to 0.25% lower. However, in the last period of our comparison, the DCA results for all samples were uniformly lower than the CAP sample results, consistent with the drop in HbA1c values we observed in our comparison with the Afinion and 2 central lab procedures. This significant variability in bias results was not, however, limited to the POC techniques. The 2 central laboratory techniques also showed highly variable bias levels. The Tosoh bias was uniformly and systematically elevated, but, even so, the values were not consistent. At certain time points, the Tosoh HbA1c values for all 3 NGSP levels were as much as 0.4% higher than the reference techniques. The bias from the NGSP values for the Biorad technique were not as great but were less uniform than the Tosoh comparison and were quite variable over time. During the initial period of our comparisons, the Biorad bias was as high as 0.25% positive for all levels. Later, the Biorad bias became negative before rising again toward the end of our study (Figure 6).
Figure 6.
Bias for the 2 POC techniques and the 2 central lab techniques as compared to the NGSP. The NGSP compares values obtained with each commercial technique to the results of testing fresh whole blood samples, tracing back to the standard HPLC technique. The difference from the standard technique is considered the “bias” of the sample. The bias is reported for a low, midrange, and a high HbA1c sample. The bias levels are published twice annually. We plotted the bias results over time for the 2 techniques. (a) Afinion bias. (b) DCA bias. (c) Biorad bias. (d) DCA bias.
Discussion
POC HbA1c testing has become essential to management of diabetes patients in clinical practices as a quantitative index of the success of treatment. Given the importance of HbA1c measurement, it is imperative that the values be reliable, validated and controlled. The NGSP has worked with the College of American Pathologists to tighten proficiency-testing requirements. As a result of these efforts, variability of HbA1c results among clinical laboratories has been considerably reduced. In 2014, the requirement for certification of the many different techniques used clinically is that values fall within ±6% of the reference standard values. Although the elaborate NGSP standardization procedures have been successful in reducing bias, this is still fairly large tolerance. From the viewpoint of a practicing physician, the most significant clinical measure is not the value at any given time point but, rather, the change in HbA1c as a result of diabetes management over time. Although various techniques may provide different absolute results, these differences should not affect treatment decisions, provided that one maintains a single assay technique with consistent and reproducible results over time. Our goal was to determine the longitudinal performance of POC testing of HbA1c. We chose to compare the POC results for the 2 techniques considered most reliable to 2 frequently utilized central laboratory procedures.
We found that there was significant variability in the values obtained over time. This variability was evident in comparing the 2 techniques to one another and to the 2 central lab procedures. Furthermore, the variability was corroborated by comparisons performed by the NGSP reference laboratories performed and reported independently by the CAP procedures, and the bias values were different for the low, midrange, and high values of the NGSP standards. However, we found that the 2 central lab procedures also showed significant bias values as compared to the NGSP controls. In fact, the Tosoh HPLC procedure gave systematically elevated results for all control levels throughout our observation period. The Biorad bias values wandered from positive to negative, and then the high range control returned to a high positive bias value at the end of our comparison period.
Our study is the longest duration comparison of HbA1c assay techniques to date. In a 10 month study, 121 young persons with Type 1 diabetes from 4 centers provided 450 paired samples for POC HbA1c and central laboratory-based HPLC HbA1c determinations.30 The 450 paired samples (median of 4 pairs/patient) were highly correlated (r = .97, P < .0001), as were time-specific and site-specific pairs (r = .94 to .98, P < .0001), but, as we have shown, correlation is not a sufficient criterion for evaluation of clinical validity. There was no assessment of bias of the 2 assays versus CAP PT (proficiency test) samples during the time period of the study.
We have now demonstrated that the 2 POC assays which are considered most reliable show significant differences in measured values which are variable over time. It would be easy to conclude that these assays are not as useful as standard central laboratory techniques were it not for the similarly variable bias results shown by the central lab methods with relation to the CAP PT samples over the same time course.
Conclusions
From the real world aspect of clinical practice, it is essential to closely monitor HbA1c values over time in relation to external standards. Reliance on controls supplied in assay kits is not sufficient to eliminate lot to lot variation. The estimates of bias obtained from the CAP-NGSP surveys are useful, but the tolerances to variation are large with respect to clinically meaningful change. The NGSP requires that the mean of the differences between an individual network laboratory and the CPRL must not exceed 0.35%, but an absolute value difference of 0.35% can translate to a worst case difference of ±0.7%. The basis for certification of manufacturer data is that 37 of 40 results for samples must fall within ± 6% of the secondary reference laboratory result for the samples. This margin of error could potentially be as large as 6% of a HbA1c value of 10%, thus a plus or minus range of 0.6%. It may be argued that, at such high levels, one can safely conclude that diabetes is poorly controlled and that the potential error is clinically insignificant. Conversely, if one accepts the American Diabetes Association target of 7% for control of diabetes, the error could be as great as 0.42%. For diagnosis of diabetes based on the arbitrarily chosen value of 6.5%, the difference in values could reach 0.39%. While this argument is based on a worst case scenario, it suggests caution in total reliance on HbA1c as a monitor of adequacy of diabetes control.
We routinely measure HbA1c with both the Afinion and the DCA Vantage in our clinical practice, also utilizing external assays for comparison on a routine basis to educate ourselves as to potential changes over time. Such an approach may be criticized as overkill and is clearly not cost effective. Yet, it is important that all those who rely on POC methods and, as we have seen, on central laboratory measurement as well, understand the potential limitations of these assays. However, in the United States, clinical offices using POC HbA1c are “waived” sites and are not required to participate in external proficiency testing. It is essential to be able to validate that a procedure accurately reflects clinically relevant results at any given point in time. One cannot be lulled into over confidence by results falling within periodic controls. In fact, as our results show, not even satisfactory results on various proficiency tests guarantee clinical invariance of values over time since there is a drift both upward and downward over the course of time. The assessment of diabetes control should proceed from the evaluation of HbA1c coupled with review of plasma glucose and of self-monitored blood glucose values. The clinician should be willing to question divergence of the assessments arising from comparison of HbA1c to glucose values as compared to HbA1c.
Footnotes
Abbreviations: CAP, College of American Pathologists; CPRL, central primary reference laboratory; HbA1c, hemoglobin A1c; HPLC, high-performance liquid chromatography; NGSP, National Glycohemoglobin Standardization Program; POC, point of care; PRL, primary reference laboratory; SRL, secondary reference laboratory; VCS, Variant II Turbo Chromatographic Station; DCCT/UKPDS, Diabetes Control and Complications Trial/ United Kingdom Prospective Diabetes Study; DCCT/EDIC, Diabetes Control and Complications Trial/Epidemiology of Diabetes Interventions and Complications.
Declaration of Conflicting Interests: The author(s) declared no potential conflicts of interest with respect to the research, authorship, and/or publication of this article.
Funding: The author(s) received no financial support for the research, authorship, and/or publication of this article.
References
- 1. Bubner TK, Laurence CO, Gialamas A, et al. Effectiveness of point-of-care testing for therapeutic control of chronic conditions: results from the PoCT in general practice trial. Med J Aust. 2009;190:624-626. [DOI] [PubMed] [Google Scholar]
- 2. St John A. The evidence to support point-of-care testing. Clin Biochem Rev. 2010;31:111-119. [PMC free article] [PubMed] [Google Scholar]
- 3. Laurence CO, Gialamas A, Bubner T, et al. Point of Care Testing in General Practice Trial Management Group. Patient satisfaction with point-of-care testing in general practice. Br J Gen Pract. 2010;60(572):e98-e104. [DOI] [PMC free article] [PubMed] [Google Scholar]
- 4. Crocker B, Lewandrowski EL, Lewandrowski N, Gregory K, Lewandrowski K. Patient satisfaction with point-of-care laboratory testing: report of a quality improvement program in an ambulatory practice of an academic medical center. Clin Chim Acta. 2013;424:8-11. [DOI] [PubMed] [Google Scholar]
- 5. Cagliero E, Levina EV, Nathan DM. Immediate feedback of HbA1c levels improves glycemic control in type 1 and insulin-treated type 2 diabetic patients. Diabetes Care. 1999;22(11):1785-1789. [DOI] [PubMed] [Google Scholar]
- 6. Miller CD, Barnes CS, Phillips LS, et al. Rapid A1c availability improves clinical decision-making in an urban primary care clinic. Diabetes Care. 2003;26(4):1158-1163. [DOI] [PubMed] [Google Scholar]
- 7. Kennedy L, Herman WH, Strange P, Harris A, GOAL AIC Team. Impact of active versus usual algorithmic titration of basal insulin and point-of-care versus laboratory measurement of HbA1c on glycemic control in patients with type 2 diabetes: the Glycemic Optimization with Algorithms and Labs at Point of Care (GOAL A1C) trial. Diabetes Care. 2006;29(1):1-8. [DOI] [PubMed] [Google Scholar]
- 8. Petersen JR, Finley JB, Okorodudu AO, Mohammad AA, Grady JJ, Bajaj M. Effect of point-of-care on maintenance of glycemic control as measured by A1C. Diabetes Care. 2007;30(3):713-715. [DOI] [PubMed] [Google Scholar]
- 9. Leca V, Ibrahim Z, Lombard-Pontou E, et al. Point-of-care measurements of HbA(1c): simplicity does not mean laxity with controls. Diabetes Care. 2012;35(12):e85. [DOI] [PMC free article] [PubMed] [Google Scholar]
- 10. Holmes EW, Erşahin C, Augustine GJ, et al. Analytic bias among certified methods for the measurement of hemoglobin A1c: a cause for concern? Am J Clin Pathol. 2008;129(4):540-547. [DOI] [PubMed] [Google Scholar]
- 11. Lenters-Westra E, Slingerland RJ. Six of eight hemoglobin A1c point-of-care instruments do not meet the general accepted analytical performance criteria. Clin Chem. 2010;56(1):44-52. [DOI] [PubMed] [Google Scholar]
- 12. Lenters-Westra E, Slingerland RJ. Three of 7 Hemoglobin A1c point-of-care instruments do not meet the general accepted analytical performance criteria. Clin Chem. 2014;60(8):1062-1072. [DOI] [PubMed] [Google Scholar]
- 13. Sánchez-Mora C, S, Rodríguez-Oliva M, Fernández-Riejos P, et al. Evaluation of two HbA1c point-of-care analyzers. Clin Chem Lab Med. 2011;49(4):653-657. [DOI] [PubMed] [Google Scholar]
- 14. Szymezak J1, Leroy N, Lavalard E, Gillery P. Evaluation of the DCA Vantage analyzer for HbA1c assay. Clin Chem Lab Med. 2008;46(8):1195-1198. [DOI] [PubMed] [Google Scholar]
- 15. Sølvik UØ1, Røraas T, Christensen NG, Sandberg S. Diagnosing diabetes mellitus: performance of hemoglobin A1c point-of-care instruments in general practice offices. Clin Chem. 2013;59(12):1790-1801. [DOI] [PubMed] [Google Scholar]
- 16. Petersen JR, Omoruyi FO, Mohammad AA, Shea TJ, Okorodudu AO, Ju H. Hemoglobin A1c: assessment of three POC analyzers relative to a central laboratory method. Clin Chim Acta. 2010;411(23-24):2062-2066. [DOI] [PubMed] [Google Scholar]
- 17. Dupuy AM, Badiou S, Elong-Bertard C, Bargnoux AS, Cristol JP. Analytical performance of the Axis-Shield Afinion for hemoglobin A1c measurement: impact of lot number. Clin Lab. 2014;60:369-376. [DOI] [PubMed] [Google Scholar]
- 18. Malkani S, Korpi-Steiner N, Rao LV. Reducing analytical variation between point-of-care and laboratory HbA1c testing. J Diabetes. 2013;5:192-196. [DOI] [PubMed] [Google Scholar]
- 19. Little RR. Analysis of the accuracy and precision of the Axis-Shield Afinion hemoglobin A1c measurement device. J Diabetes Sci Technol. 2012;6(2):387-388. [DOI] [PMC free article] [PubMed] [Google Scholar]
- 20. Weykamp CW, Penders TJ, Muskiet FA, van der Slik W. Effect of calibration on dispersion of glycated hemoglobin values as determined by 111 laboratories using 21 methods. Clin Chem. 1994;40:138-144. [PubMed] [Google Scholar]
- 21. DCCT Research Group. Feasibility of centralized measurements of glycated hemoglobin in the Diabetes Control and Complications Trial: a multicenter study. Clin Chem. 1987;33:2267-2271. [PubMed] [Google Scholar]
- 22. Little RR, Rohlfing CL, Sacks DB. Status of HbA1c measurement and goals for improvement: From chaos to order for improving diabetes care. Clin Chem. 2011;57:204-214. [DOI] [PubMed] [Google Scholar]
- 23. NGSP background information. Available at: www.ngsp.org/bground.asp. Accessed February 18, 2015.
- 24. Steffes M, DCCT/EDIC Research Group, et al. Hemoglobin A1c measurements over nearly two decades: sustaining comparable values throughout the Diabetes Control and Complications Trial and the Epidemiology of Diabetes Interventions and Complications Study. Clin Chem. 2005;51:753-758. [DOI] [PMC free article] [PubMed] [Google Scholar]
- 25. Afinion HbA1c quick guide. Available at: http://afinion.net/sites/default/files/publications. Accessed February 18, 2015.
- 26. Quantitative measurement of hemoglobin A1c on the DCA. Available at: www.healthcare.siemens.com/…/@poc/…/130890-gc1_dca_hba1c Accessed February 18, 2015.
- 27. Tosoh HbA1c analysis G8 brochure—Tosoh Bioscience. Available at: www.diagnostics.us.tosohbioscience.com/…/Unassigned/g8_brochure.pdf. Accessed February 18, 2015.
- 28. Variant II Turbo instrumentation. Available at: www.bio-rad.com/…/variant-ii-turbo-instrumentation. Accessed February 18, 2015.
- 29. American Proficiency Institute. Lab Advantage. Available at: www.labadvantage.org/what_is_lab…/american_proficiency_institute.asp. Accessed February 25, 2015.
- 30. Alleyn CR, Laffel LM, Volkening LK, et al. Comparison of longitudinal point-of-care and high-performance liquid chromatography HbA1c measurements in a multi-centre trial. Diabet Med. 2011;28(12):1525-1529. [DOI] [PMC free article] [PubMed] [Google Scholar]


