

Abstract
Background:
In 2014, an innovative blinded continuous glucose monitoring system was introduced with automated ambulatory glucose profile (AGP) reporting. The clinical use and interpretation of this new technology has not previously been described. Therefore we wanted to understand its use in characterizing key factors related to glycemic control: glucose exposure, variability, and stability, and risk of hypoglycemia in clinical practice.
Methods:
Clinicians representing affiliated diabetes centers throughout South Africa were trained and subsequently were given flash glucose monitoring readers and 2-week glucose sensors to use at their discretion. After patient use, sensor data were collected and uploaded for AGP reporting.
Results:
Complete data (sensor AGP with corresponding clinical information) were obtained for 50 patients with type 1 (70%) and type 2 diabetes (30%), irrespective of therapy. Aggregated analysis of AGP data comparing patients with type 1 versus type 2 diabetes, revealed that despite similar HbA1c values between both groups (8.4 ± 2 vs 8.6 ± 1.7%, respectively), those with type 2 diabetes had lower mean glucose levels (9.2 ± 3 vs 10.3 mmol/l [166 ± 54 vs 185 mg/dl]) and lower indices of glucose variability (3.0 ± 1.5 vs 5.0 ± 1.9 mmol/l [54 ± 27 vs 90 ± 34.2 mg/dl]). This highlights key areas for future focus.
Conclusions:
Using AGP, the characteristics of glucose exposure, variability, stability, and hypoglycemia risk and occurrence were obtained within a short time and with minimal provider and patient input. In a survey at the time of the follow-up visit, clinicians indicated that aggregated AGP data analysis provided important new clinical information and insights.
Keywords: advanced glucose sensing technologies, ambulatory glucose profile, flash glucose monitoring
Innovations in continuous glucose monitoring (CGM) have come to characterize the field of glucose sensing in diabetes and a number of such devices and software programs are available. It has been suggested that retrospective analysis of CGM patterns may be the key benefit of CGM.1,2 However, the adoption of CGM for clinical decision making and research remains elusive.3,4 Scheiner recently reviewed the advantages of, and problems with retrospective analysis of CGM data, suggesting that a structured approach to data interpretation may hold the key to future success.5
The FreeStyle Libre (ADC, Alameda, CA) flash glucose monitoring (FGM) system was introduced for diabetes care in 2 formats. In 2013, the patient format device was introduced in 7 European countries, which allows the individual with diabetes to “flash” the reader over the sensor to get the current (last minute) glucose value, the trend (last 15 minutes) and the previous 8 hours. In 2014 a second format, “Pro,” was introduced in South Africa and India. It uses the same sensor technology with different storage and communication facilities. The disposable sensor measures and stores glucose data only available when the reader held by the physician is passed (flashed) over the sensor. At that moment the physician can retrieve the current glucose reading as well as the glucose readings stored in the sensor for up to 14 days. Although when analyzed retrospectively this sensor therefore gives data very similar to a CGM device, its major difference to currently available blinded CGM, is that calibration is not necessary and that it is can be worn for up to 2 weeks. Thus 14 days of data can be collected entirely independent of any SMBG undertaken by the patient.
Description of Technology and validation
The FreeStyle Libre Pro (FSLP) system consists of 3 separate elements, the sensor, the reader, and the interpretive software. The sensor unit is a single use, self-adhesive 2 cm diameter disc with a 5 mm “wired enzyme” sensor filament protruding from the center of the underside. The filament is inserted into subcutaneous fat on the posterior surface of the upper arm with a simple applicator unit which introduces and then retracts a carrier needle for the sensor filament. After insertion, the sensor is activated by a near field communication (NFC) signal from a reader unit (resembling a standard blood glucose meter in shape and size). Following this, the sensor stores interstitial fluid glucose levels every 15 minutes for the patient wear time of 14 days. The data are stored on a memory chip within the sensor disc. At any time during the wear period, the information within the memory chip can be interrogated by the health professional using the reader unit, which incorporates secure NFC protocols. It can then either be displayed on the reader screen, or uploaded from the reader for viewing on a Windows PC or Mac. For the purposes of this project, information was read only at the end of the 14-day period, since the sensor stored the data and the subject did not require a reader.
Although utilizing the same chemical glucose oxidase mechanism for glucose measurement as CGM, the FreeStyle Libre uses osmium-based “wired enzyme sensors.” Because this sensor technology does not produce as much “drift” as earlier sensors and has a more stable response over time in glucose measurements, it can be calibrated at the time of manufacturing and does not require recalibration by the patient or clinician. In studies where data were compared after 14 days using factory-calibrated sensors or sensors with ongoing patient calibration, the difference in glucose values was negligible, but favoring the factory calibrated system.6
During the clinical evaluation described below, the software used by clinicians was the FSLP boxed software v1.0, which can be installed on either PC or Mac. The reader is connected to the computer via a USB connection and the software uses the reader as its memory (no data are transferred to the computer unless specifically saved). The software interrogates the recorded glucose data to produce an on-screen representation of the sensor performance, daily glucose profiles, an ambulatory glucose profile (AGP), a modified AGP with basic pattern recognition and a “clinical insights” commentary. These reports can be saved as pdf files and/or the raw time-stamped glucose data from the sensor can be saved in csv format for additional analysis using MS Excel. This was undertaken in this study to calculate glucose exposure, variability, stability, and duration of hypoglycemic events.
Figure 1 shows the graphic elements of an AGP with the individual day plots that comprise the AGP. The AGP software graphs the data by time without regard to date.7,8 Because the AGP (top panel) is graphed only by time of day, a number of statistical procedures can be used to characterize overall glycemic control. Since the area under the time curve measures exposure to a biological element, measurement of the area under the AGP median represents glucose exposure. To do this, the median curve is segmented into 24 one-hour segments (x-axis) with the hourly median serving as the height of the curve (y-axis). Each data stream is available as a numeric download as well as in csv format for analysis.
Figure 1.

AGP profile of a subject with type 1 diabetes.
Area under the curve (AUC) is therefore where i = hour of the day and P50i = the smoothed 50th percentile value for the ith hour of the day. Note, this value is displayed in mmol/l*24 hours.
Normalization of AUC is calculated by dividing the total by the number of hours for the time period (eg, for a 24-hour period, the hourly medians would be divided by 24). To determine the normalized waking and sleeping exposures, the times are demarked; the hourly medians in each category are summed and divided by the number of hours in each category.
Glucose variability is represented by the mean difference between the 25th and 75th percentile (shown in Figure 1 as the darkened area) and is known as the interquartile range (IQR). The outlier values are represented by the lighter area between the 10th and 90th percentile curves known as the interdecile range. Because these are frequency distributions, measures of glucose variability also provide the probability of values falling within these ranges. For example, there is a 50% probability that at any time period a glucose value will fall within the IQR and an 80% probability it will fall within the interdecile range. The data are simply reported in mmol/l.
Glucose stability is a measure of the moment-to-moment change in the glucose level as depicted on the AGP median curve segmented into hourly periods. The absolute difference between the hourly values is calculated, summed and divided by 24. The result is the average hourly change in the median. Reported in mmol/l/hour, it provides an indication of the level of stability in glycemic control. Because a higher number reflects greater glucose instability, it is sometimes referred to as a measure of instability.
Measures of hypo- and hyperglycemia are straightforward. After determining the cut-off points, (for the purposes of this experience, a blood glucose value <3.9 mmol/L [72 mg/dl] was used to define hypoglycemia and >10 mmol/L [180 mg/dl] as hyperglycemia), AGP calculates the percentage of values within, above, and below these values.
Study Design and Methods
With its national background of expertise in diabetes management,9 the CDE undertook a unique collaboration with the AGP Clinical Academy (Portsmouth Hospitals, NHS Trust). Together they initiated a clinical evaluation of the FSLP system along with AGP reporting, with the purpose of characterizing the glycemic control of the patients in terms of glucose exposure, variability, and stability as well as hypoglycemic experience defined as any episode where 2 or more successive values were below 3.9 mmol/l.
An HbA1c measurement taken at the time of the insertion of the sensor or within the preceding 2 weeks was recorded. All HbA1c measurements were performed by ion-exchange high-performance liquid chromatography (HPLC) using the Bio-Rad D10 and the assay is NGSP/DCCT aligned. To assess the perceived value of the Libre Pro download to the treating physician, each participating physician was required to fill in a simple questionnaire (Supplementary Figure 1) following analysis of the AGP download.
For the clinical evaluation of this novel technology within the South African context, 2 training periods were undertaken for all involved clinicians (physicians and diabetes nurse educators):
A 2-day basic introduction to the technology. This basic curriculum introduced FGM technologies, AGP construction and reporting structure and presented cases for group problem solving;
A 1-day “revision” program just prior to receipt of the sensor technology for clinical use. Local training programs centered on the CDE network of doctors. Basic education into interpretation of AGP data was made scalable through production of a training manual, which includes all of the slides plus accompanying narratives and case study materials.
Following the training, 16 clinics were selected to gain clinical experience with the technology and AGP analysis. Each clinic was provided with sensors and instructed to select patients representative of their practice, but in whom previous review of SMBG data had not revealed the cause underlying their dysglycemia. Following explanation of the experience, informed consent was obtained. The sensors were demonstrated and then placed on the upper arm. The HbA1c was recorded and the relevant history of diabetes was noted. The patients were instructed to continue their current treatment and SMBG schedule and to return with the sensor after 2 weeks. Clinicians were instructed to capture the stored data at the completion of the study using the FSLP reader and with FreeStyle Libre software to upload the data to their computer to review the AGP reports.
This was a real-life clinical experience exercise and no restrictions or inclusion/exclusion criteria were specified, as one of the reasons for this observational study was to gain experience in determining in which patients retrospective AGP might prove useful. The individual physicians were free to select any patients they felt might benefit from retrospective AGP. It was recognized that this may include individuals with both type 1 and type 2 diabetes, although no specific goals were set for numbers. Analysis of data was planned for the whole group and (if adequate numbers achieved) for type 1 and type 2 diabetes groups separately. In many of these patients SMBG was not being undertaken regularly enough to allow for therapeutic adjustments or in some cases the SMBG results and HbA1c results were inconsistent. None of the subjects had previous experience or exposure to CGM.
For purposes of group analysis, anonymous pdf and csv files were created from each sensor returned to the central facility and saved in secure files. These data could then be further analyzed for group traits according to diabetes type.
Results
Records on 73 patients were submitted for analysis (Figure 2).
Figure 2.
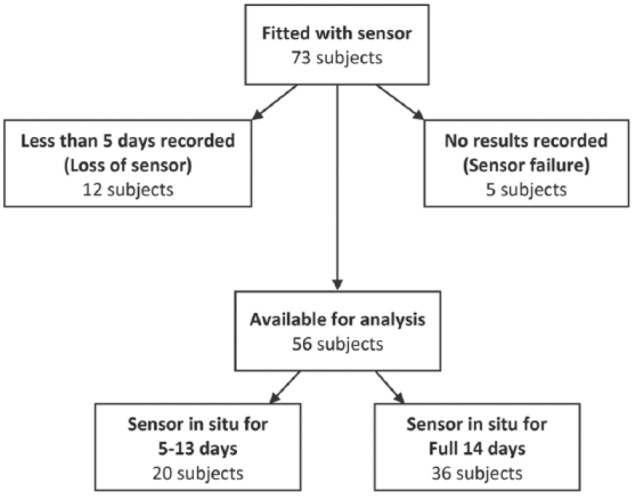
Flow chart of patient data available for analysis.
In 5 patients, the sensor did not record any results despite being in situ for 14 days (primary sensor failure rate of 6%). Twelve sensors had less than 5 days of data because of early removal or “falling off.” Information was relatively unclear on the reason for early removals, but appears to be primarily due to the sensor being rubbed off by clothing or trauma.
Of the remaining 56 patients with full sensor records for analysis, 6 of these patients did not have a current HbA1c and were consequently removed from analysis. Of the 50 patients with complete data, 70% had type 1 diabetes (60% M) of whom 25% were treated by pump therapy. These patients had a mean age of 31 ± 10 years and 15 ± 6 years average duration of diabetes. Of the patients with type 2 diabetes (65% M), 25% were treated with oral agents, 25% with insulin only and the remainder using combined insulin and oral agent therapies. Average age was 53 ± 13 years and duration of diabetes was 11 ± 4.9 years. Table 1 presents the summary data.
Table 1.
Comparisons Between Total Patient Group and Subjects With Either Type 1 or Type 2 Diabetes.
| Measure of exposure group | Laboratory HbA1c | HbA1c estimate | Mean glucose | AUC glucose (total) | AUC glucose (day) | AUC glucose (night) | IQR glucose | Glucose (in)stability | Time in target, 4-10 mmol/l | Time below 4 mmol/l |
|---|---|---|---|---|---|---|---|---|---|---|
| Unit | % | % | mmol/l, mg/dl | mmol/l/hr, mg/dl/hr | mmol/l/hr, mg/dl/hr | mmol/l/hr, mg/dl/hr | mmol/l, mg/dl | mmol/l/hr, mg/dl/hr | % of time | % of time |
| Total group | 8.4 (1.9) | 7.6 (1.7) | 9.8 (3) | 9.2 (2.7) | 9.8 (3.4) | 8.1 (3.0) | 4.2 (1.9) | 0.8 (0.4) | 32.6 (20.7) | 9.3 (10.1) |
| 176 (54) | 166 (49) | 176 (61) | 146 (54) | 76 (34.3) | 14.4 (7.2) | |||||
| Type 1 (n = 35) | 8.4 (2.0) | 7.9 (1.6) | 10.2 (3) | 9.7 (2.8) | 10.6 (3.2) | 8.1 (2.7) | 5.0 (1.9) | 0.9 (0.5) | 28.1 (15.7) | 9.0 (8.6) |
| 184 (54) | 175 (50) | 191 (58) | 146 (49) | 90 (34.2) | 16.2 (9) | |||||
| Type 2 (n = 15) | 8.5 (1.7) | 6.8 (2.1) | 9.2 (3) | 9.0 (2.4) | 9.2 (3.5) | 8.3 (3.8) | 3.0 (1.5) | 0.6 (0.3) | 33.1 (27.0) | 9.4 (11.2) |
| 166 (54) | 162 (43) | 166 (63) | 149 (68) | 54 (27) | 10.8 (5.4) |
Figures in parentheses are standard deviations. Measures: exposure (HbA1c, eHbA1c, mean BG, AUC); variability (IQR); and stability (time block AUC and instability).
While laboratory-measured HbA1c was similar between groups, estimated A1C (eA1C) calculated by the Libre software differed between groups by more than 1 percentage point. This was consistent with a difference of 1.1 mmol/l (19.8 mg/dl) in mean glucose values between groups. The normalized AUC (glucose exposure) followed the same trend. Glucose variability (IQR) revealed a 60% wider range for type 1 diabetes.
Despite similar laboratory HbA1c values, the AGPs revealed differences in glucose exposure by time of day between patients with type 1 and type 2 diabetes: (1) higher daytime and lower nighttime values in patients with type 1 diabetes, (2) lower glucose variability in patients with type 2 diabetes, and (3) lower measures of overall glucose instability in type 2 diabetes.
Evaluation of the incidence of hypoglycemia showed no significance difference between patients with type 1 and type 2 diabetes in terms of the percentage of time spent <3.9 mmol/l (72 mg/dl) (see Table 1). Among patients with type 1 diabetes, the percentage of time ranged from 0 to 34%. They experienced on average 1.1 ± 0.9 episodes each day with an average duration of 1.6 ± 0.9 hours. Only 2 of the patients with type 1 diabetes (6%) had no hypoglycemia. For patients with type 2 diabetes, the amount of time spent in hypoglycemia ranged from 0 to 21%, averaging 1 ± 1 episode each day with a mean duration of 1.3 ± 1.2 hours. Seven (47%) of the type 2 subjects experienced no hypoglycemia.
A graphic comparison of AGPs in 2 subjects, 1 with type 1 diabetes and the other with type 2 diabetes (with similar HbA1c) and whose data most closely represented the mean of each group is shown in Figure 3. Both patients were treated with multiple daily injections of insulin (MDI). Note that more typical of type 1 diabetes (bottom panel), the glucose variability is greater and the median curve (stability) is more oscillatory. Despite very close mean glucose levels (and eA1C), the profiles clearly show distinctive patterns.
Figure 3.

Representative daily glycemic patterns from patients with type 2 and type 1 diabetes (top and bottom panels, respectively).
Next, patients in each classification whose values came closest to ±1 standard deviation from the mean for exposure, variability, and stability were selected. These profiles are shown in Figure 4. The 4 selected patients were treated with MDI. Once again, it was noted that in general, patients with type 2 diabetes treated with insulin tended to have more stable and less variable profiles at similar levels of glycemic control. It was also noted that patients with type 1 or type 2 diabetes (left panels) at 1 standard deviation below the mean could mimic profiles that came close to those of patients with normal glucose metabolism.
Figure 4.

Individual patient AGP figures most closely representing 1 SD below (left panels) and 1 SD above (right panels) mean for glucose exposure, variability, and stability (type 2 diabetes top panels and type 1 bottom panels).
For each patient, we also compared the HbA1c recorded at the time the AGP was initiated with the estimated A1C calculated from the 2-week AGP data. The recorded HbA1c was correlated with the eA1C (r2 = .51, P < .001) (Figure 5). We found on average, the eA1C was 0.8% lower with the type 1 patients having the greater difference when compared to type 2 (1.5% vs 0.6%, respectively).
Figure 5.

Estimated A1C versus paired laboratory HbA1c for all subjects.
The physician participants were surveyed and any adverse patient reactions reported. Two patients (4%) reported an adverse reaction. One reported discomfort during insertion and another reported a minor infection at the insertion site. Looking at the clinical utility of the information, in patients with type 2 diabetes, 65% of the physicians reported that based on the information provided in the AGP report, they would have altered current therapy (see Supplementary Figure 1). In patients with type 1 diabetes, 75% of the physicians reported they would change therapy.
Discussion
Clinical decision making in chronic diseases in general, and diabetes specifically, are subject to clinical inertia. The willingness to allow things to remain as they are, rather than seek to improve them, can be overwhelming in the face of the daunting task of finding an effective therapy. An HbA1c of <7% might suggest adequate glycemic control. The AGP data provide us with a visualization of the actual glycemic exposure patterns behind HbA1c, at times disclosing persistent and significant hypoglycemia and/or hyperglycemia, as well as considerable glycemic variability. Each excursion from the patient’s target range possibly contributes to the development and progression of long-term complications,10 while portending possible acute complications such as hypoglycemic coma.
This clinical evaluation was the first use of FSLP in a large mixed population of individuals in different clinical settings. The clinicians were well prepared in terms of understanding both the technology and the interpretation of AGP reports. From the onset, this approach was novel as, in general, the use of any glucose monitoring technology and the interpretation of the related clinical reports are, for the most part, self-taught. In this clinical evaluation, we chose to prepare the clinicians systematically enabling future optimization of the technology and clinical reporting process.
The FSLP system has a number of apparent advantages over other available CGM systems. The sensor is light, small and nonobtrusive and, in most cases, stays in place for 14 days. It is painless to insert and does not need calibration with SMBG. The software allows for a consolidated overview of levels of glycemia and quantification of measured glucose exposure, variability, and stability. It was also able to report the incidence and duration of hypoglycemia in an easily interpretable manner. However, the 7% sensor failure rate needs to be addressed by the manufacturer, and the 16% lost through dislodging in day-to-day wear will need clinicians to ensure effective placement and protection.
In this limited clinical experience, we were able to characterize the glucose patterns in 50 patients treated by 16 physicians in different clinics throughout South Africa. Review of individual profiles pinpointed periods of hypo and hyperglycemia likely undetectable by SMBG or HbA1c. The study was observational and the AGP was performed on patients in routine clinical practice. While many of the physicians felt the data would help them optimize therapy, a follow-up of these patients to assess glycemic improvements after such optimization was not the purpose of this initial clinical experience with AGP. A formal longitudinal study to determine if the data obtained from AGP improves glycemic control is currently underway.
Most problematic was the association between the estimated A1c and the laboratory HbA1c. This could in part be explained by the Hawthorne effect, with patients becoming more aware of their dietary and other indiscretions with the knowledge that their blood glucose was being monitored continuously. It could also be explained as a dysynchonization between the timing of the assay and the 2 weeks of sensor use. However, more fundamentally, we believe that manner in which the estimated value is calculated may be the primary cause. The AGP produced using FSLP software reports the overall average glucose and then calculates the estimated A1c using the Nathan formula.11 Because the formula uses the calculated mean it includes the values in the hypoglycemia range (<3.9 mmol/L) whereas lab-based HbA1c does not. While individuals with long-term hyperglycemia may have up to 3-fold higher HbA1c than normal individuals, Morimoto and associates recently showed that individuals with the same incidence and duration of hypoglycemia (<70 mg/dL) have an equal probability of having high, intermediate or low HbA1c values.12
Conclusion
It is sadly a clinical reality that SMBG data, while often of great relevance, can for a number of diverse reasons often fall short of the mark in providing data that are robust enough to confidently make therapy dose adjustments to improve the overall glycemic profile of an individual. Although blinded CGM technology has been available for some years, its cost and complexity of analysis (requiring calibration adjustments) has limited its use primarily to research studies, with limited evidence of its benefit in routine clinical care. Real-time CGM by contrast has been shown to be well-accepted and of clinical importance to persons with diabetes who are actively involved in their self care and therapy dose adjustment, as long as used >70% of the time, making it an option with limited applicability through cost. This article represents the experience of a first use pilot of a novel blinded CGM device (the FSLP) worn for a single 2-week period in a purely clinical environment in individuals whose SMBG data have not proven helpful in making therapy dose adjustments. Despite initial unfamiliarity with the system, and the challenging clinical circumstances in which the device was tested, a single wear period provided information deemed valuable in therapy adjustment by the majority of clinicians in the majority of individuals. It thus offers the opportunity to improve the professional advice given in consultation around therapy dosing through episodic rather than continuous use. Further investigation into the ways in which such devices may inform the clinical consultation process around therapy adjustment, and the ways in which clinicians interpret and use the information thus hold out an opportunity for improved future outcomes to a potentially wide population group.
The experience with the Libre Pro and AGP analysis showed that (1) used in a systematic manner, new and novel technology can be useful; (2) a simple means to access and interpret the data are provided with AGP analysis; (3) a framework for standardized analysis that recognizes the full potential of this technology in terms of its ability to address important clinical questions needs to be provided. However, this observational study did not address the question as to whether knowing these data and using them to adjust therapy will actually improve glycemic control. This is the subject of a follow-up study currently being conducted. The additional useful information gleaned from the use of the AGP in this small pilot group of patient data sets raises questions regarding the utility of estimated versus laboratory HbA1c, which is also under further investigation.
Supplementary Material
Acknowledgments
The authors wish to express their appreciation for the participation of the CDE physicians and diabetes educators. In addition, they acknowledge the support of Abbott Diabetes Care for providing adequate FreeStyle Libre Pro readers and sensors to enable the study. Mr Michael Brown (clinical consultant and head of CDE Media and Publishing Division) reviewed and edited the manuscript.
Footnotes
Abbreviations: AGP, ambulatory glucose profile; AUC, area under the curve; CGM, continuous glucose monitoring; FGM, flash glucose monitoring, FSLP, FreeStyle Libre Pro; IQR, interquartile range; MDI, multiple daily injections of insulin; NFC, near field communication; SMBG, self-monitoring of blood glucose.
Declaration of Conflicting Interests: The author(s) declared the following potential conflicts of interest with respect to the research, authorship, and/or publication of this article: LAD received no financial support for the execution of this study. IC was supported by Abbott Diabetes Care as a physician-trainer. RM was supported by Abbott Diabetes Care as a physician-trainer.
Funding: The author(s) disclosed receipt of the following financial support for the research, authorship, and/or publication of this article: Libre FreeStyle Pro devices and sensors were supplied by Abbott Diabetes Care.
Supplemental Material: The supplementary material is available at http://dst.sagepub.com/supplemental
References
- 1. Pearson I, Bergenstal R. Fine-tuning control: pattern management versus supplementation. Diabetes Spectr. 2001;14:75-78. [Google Scholar]
- 2. Ritholz M, Atakov-Castillo A, Beste M, et al. Psychosocial factors associated with the use of continuous glucose monitoring. Diabet Med. 2010;27:1060-1065. [DOI] [PubMed] [Google Scholar]
- 3. Bergenstal R, Ahman AJ. Recommendations for standardizing glucose reporting and analysis to optimize clinical decision making in diabetes: the Ambulatory Glucose Profile (AGP). Diabetes Technol Ther. 2013;15(3):198-211. [DOI] [PubMed] [Google Scholar]
- 4. Mazze R, Akkerman B, Mettner J. An overview of continuous glucose monitoring and the ambulatory glucose profile. Minnesota Med. 2011;94(8):40-44. [PubMed] [Google Scholar]
- 5. Scheiner G. CGM retrospective data analysis. Diabetes Technol Ther. 2016;18(S2):14-22. [DOI] [PMC free article] [PubMed] [Google Scholar]
- 6. Hoss U, Budiman E, Liu H, Christiansen H. Continuous glucose monitoring in the subcutaneous tissue over a 14-day sensor wear period. Diabetes Sci Technol. 2013;7(5):1210-1219. [DOI] [PMC free article] [PubMed] [Google Scholar]
- 7. Mazze R, Strock E, Wesley D, et al. Characterizing glucose exposure for individuals with normal glucose tolerance using continuous glucose monitoring and ambulatory glucose profile (AGP) analysis. Diabetes Technol Ther. 2008;10(3):149-159. [DOI] [PubMed] [Google Scholar]
- 8. Shamoon H, Mazze R, Pasmantier R, Lucido D, Murphy J. Assessment of long-term glycemia in type I diabetes using multiple blood glucose values stored in a memory-containing reflectometer. Am J Med. 1986;80:1086-1092. [DOI] [PubMed] [Google Scholar]
- 9. Distiller LA, Brown MA, Joffe BI, Kramer BD. Striving for the impossible dream: a community-based multi-practice collaborative model of diabetes management. Diabet Med. 2010; 27:197-202. [DOI] [PubMed] [Google Scholar]
- 10. Brownlee M, Hirsch IB. Glycemic variability: a hemoglobin A1c-independent risk factor for diabetic complications. JAMA. 2006;295:1681-1687. [DOI] [PubMed] [Google Scholar]
- 11. Nathan DM, Kuenen J, Borg R, et al. Translating the hemoglobin A1C assay into estimated average glucose values. Diabetes Care. 2008;31(8):1473-1478. [DOI] [PMC free article] [PubMed] [Google Scholar]
- 12. Morimoto AL, Nishimura R, Tsujino D, Taki K, Tajima N, Utsunomiya K. Relationship among A1C, hypoglycemia, and hyperglycemia in Japanese with type 2 diabetes—results from continuous glucose monitoring data. Diabetes Technol Ther. 2011;13(6):667-670. [DOI] [PubMed] [Google Scholar]
Associated Data
This section collects any data citations, data availability statements, or supplementary materials included in this article.