Abstract
Background:
Effective glucose control in the intensive care unit (ICU) setting has the potential to decrease morbidity and mortality rates which should in turn lead to decreased health care expenditures. Current ICU-based glucose controllers are mathematically derived, and tend to be based on proportional integral derivative (PID) or model predictive control (MPC). Artificial intelligence (AI)–based closed loop glucose controllers may have the ability to achieve control that improves on the results achieved by either PID or MPC controllers.
Method:
We conducted an in silico analysis of an AI-based glucose controller designed for use in the ICU setting. This controller was tested using a mathematical model of the ICU patient’s glucose-insulin system. A total of 126 000 unique 5-day simulations were carried out, resulting in 107 million glucose values for analysis.
Results:
For the 7 control ranges tested, with a sensor error of ±10%, the following average results were achieved: (1) time in control range, 94.2%, (2) time in range 70-140 mg/dl, 97.8%, (3) time in hyperglycemic range (>140 mg/dl), 2.1%, and (4) time in hypoglycemic range (<70 mg/dl), 0.09%. In addition, the average coefficient of variation (CV) was 11.1%.
Conclusions:
This in silico study of an AI-based closed loop glucose controller shows that it may be able to improve on the results achieved by currently existing ICU-based PID/MPC controllers. If these results are confirmed in clinical testing, this AI-based controller could be used to create an artificial pancreas system for use in the ICU setting.
Keywords: artificial intelligence, closed loop control, cost savings, glucose, intensive care unit, knowledge-based system
The importance of glucose control in the intensive care unit (ICU) setting was first demonstrated by Furnary1 and later confirmed by Van den Berghe2 in a large, prospective, randomized control study. However, almost all of the clinical studies that have been published since then have struggled to achieve superior glucose control while avoiding the glucose metrics that actually increase mortality rates—hypoglycemia, hyperglycemia, variability, and low time in range.3-6 A Japanese study that utilized a closed loop glucose control system that minimized hypoglycemia while at the same time achieving a high percentage of time in range showed the true promise of effective glucose control.7 To achieve tight glucose control while at the same time minimizing glucose metrics that increase mortality rates, a closed loop system will need to be created. This system should mimic the workings of the native system which have been previously reviewed.8
To date, most attempts at creating a closed loop glucose control system for use in the ICU setting have utilized the standard engineering control techniques of proportional integral derivative (PID) or model predictive control (MPC).9-12 PID controllers typically control to a set point and are challenged by the fact they rely solely on insulin for control, thus they do not take advantage of the counter-regulatory effects of intravenous (IV) glucose. MPC controllers rely on a complex mathematical model of the glucose-insulin system. MPC model parameters are refitted every 1 to 4 hours, in an iterative fashion, based on the difference between the predicted and measured glucose level. Control recommendations are made from the resulting best fit model. MPC controllers can be designed to control to a set point or to a desired range and can employ both insulin and counter-regulatory IV glucose. Please refer to a recent review for a more thorough understanding of PID and MPC control methodologies.13
Other control methodologies, however, do exist, as shown by the MD-Logic Artificial Pancreas System.14 This system has been developed for type I diabetics and uses fuzzy logic, which is an AI technique, to capture the “lines of reasoning” of the diabetes specialists who created the controller. In a series of studies this AI-based controller has shown excellent potential in its ability to control type I diabetics.15,16 In 2015 Medtronic acquired worldwide licensing rights to this software with the stated intention of incorporating it into all of their future closed loop glucose control systems.
At their core, AI controllers seek to capture the human thought process by creating rules that mimic the exact reasoning used by humans. One example would be a logic rule that describes the low glucose suspend feature used by more advanced insulin pumps. Such a rule would take the form of: “if current glucose < (70 mg/dl) and current insulin flow > (0 units/hour) then next insulin flow = (0 units/hour).” While this example deals with a hypoglycemic state, such a logic-based system could be expanded on to cover all possible scenarios related to glucose control. This type of rule-based control system would be considered a Knowledge Based System.17
A typical knowledge-based system is created when a domain expert sits down with a knowledge engineer and explains to the engineer their lines of reasoning as to why they perform certain functions when trying to control the system at hand. The engineer then turns the lines of reasoning into a series of if-then rules that mimic the domain experts thinking. This type of control is considered forward chaining in that available data such as the desired glucose control range, current glucose level, glucose rate of change, current insulin dose and current dextrose/glucagon dose are considered antecedents that fulfill an if clause. An inference engine then searches the rules contained in the knowledge base of the control system until the rule matching the current antecedents is identified. The inference engine then applies the consequent or then clause of this rule, in an attempt to either maintain or return the system back toward the desired control range. Systems that are based on AI are either already in use or under current development and as such have already been accepted into the medical arena.18-20
Through utilization of 30 years of ICU experience and a deep understanding of the native glucose control system,8 one of the authors (LD) has designed an AI-based glucose controller for use in the ICU setting. A preliminary version of this controller has been previously published.21 This controller is a knowledge-based system, which is a form of AI. It is a forward chaining adaptive controller that has not been imparted with learning characteristics as its main use will be for brief periods of time (<7 days) on patients whose glucose-insulin dynamics are rapidly changing. It is a multiple input multiple output (MIMO) system that operates with a 10-minute cycle interval, however can switch to a 5-minute cycle interval during states of hypoglycemia or extreme glucose dynamics. In addition, it controls to a range decided by the user and requires no knowledge of patient inputs such as IV dextrose, meals, steroid use, and so on. On initialization its only inputs are starting glucose, patient weight, desired control range and the concentrations of insulin/dextrose solutions that are used in the control process. Glucose data will be expected to come from an indwelling vascular and/or interstitial glucose sensor(s). The system is shown in schematic form in Figure 1. In designing this system the developer served as both the domain expert and the knowledge engineer, thus avoiding any loss of knowledge during the translation process. This article presents the results of testing this unique AI-based glucose controller in a simulated ICU patient environment.
Figure 1.
Schematic representation of control method used in the simulation study. The knowledge base is formed by the rules in the controller. The inference engine decides which rules apply based on the data in the first box that is presented to the controller. The controller functions in an iterative fashion with a cycle length of 5/10 minutes.
Methods
The control rules of the AI-based glucose controller were programmed in LabVIEW. In addition, an accepted mathematical model of the ICU patient’s glucose-insulin system that was developed by Van Herpe, et al.22 was programmed in LabVIEW. The controller and ICU patient’s glucose-insulin system model were interfaced such that exogenous flows of insulin and dextrose, as directed by the controller, were incorporated into the mathematical model. The models existing exogenous flow of dextrose was left intact, so that the model could be perturbed through variable infusions of dextrose. The original Van Herpe model parameters, at baseline, are set to coincide with those of an “obese-low glucose tolerance patient group,” as their insulin resistance is felt to most closely resemble that seen in an ICU patient. To more closely approximate the real-life ICU setting, several of the model parameters were set to vary with time throughout each simulation.
The time variant parameters included insulin sensitivity, insulin half-life and insulin/glucose volume of distribution. A total of 4 insulin sensitivity curves, 3 insulin half-life curves and 3 volume of distribution curves were created using a cubic spline interpolation technique. In addition, simulations were also run whereby each of the above 3 parameters were left unchanged throughout the simulation, from the original Van Herpe model. The time variable parameter curves were based on previously published articles, meaning the variation of these parameters were kept within previously measured physiologic bounds.23-25 Although these variable curves were not derived from actual ICU patients, the clinical situation that could account for each of these curves is described in the supplement. Through combining the resulting 5 insulin sensitivity parameters, 4 insulin half-life parameters and 4 volumes of distribution parameters a total of 80 unique “patients” were created.
Each “patient” was simulated for a period of 5 days, which is equivalent to an average length of stay in an ICU setting. To perturb the model and thoroughly test the controller the following different test scenarios were used: (1) 3 different starting glucose values of 55, 120, and 200 mg/dl, (2) 7 different glucose control ranges of 70-110, 80-120, 85-125, 90-130, 95-135, 100-140, and 80-140 mg/dl, (3) 5 different variable exogenous dextrose infusions, (4) 3 glucose sensor errors (SEs) of ± 5, 10, and 15%, and (5) 5 glucose sensor bias of −10, –5, 0, 5, and 10 mg/dl. SE was applied by sampling every 5 to 10 in silico minutes from a probability density function, 26 where e denotes the SE for that particular trial, expressed as a decimal. The resulting pseudorandom number was added to unity and multiplied by the “true” value then added to the given bias for that trial to attain the upcoming input for the controller. This approach is not quite as sophisticated as the zero-mean residual and glucose-level-based approaches taken in Wilinska and Hovorka,27 though it can be shown that this approach sufficiently obfuscates the signal to demonstrate the resiliency of the AI controller to an imperfect input. The dextrose infusion, insulin sensitivity, insulin half-life and volume of distribution graphs/curves used to create the simulations are available in the supplementary material. During each of the unique simulations the SE and bias were not time variant. This testing resulted in 126,000 unique 5-day simulations, producing over 15 million hours of simulation time and approximately 107 million glucose values for analysis. The final altered Van Herpe model is noted in equations 1-4.
denotes the insulin sensitivity multiplier; means a decreased sensitivity and means an increased sensitivity to insulin as compared to the original model.
denotes the volume of distribution multiplier; means a decreased volume of distribution and means an increased volume of distribution as compared to the original model.
denotes the insulin half-life multiplier. It behaves in an inverse fashion; means a decreased half-life, and means an increased half-life as compared to the original model.
is the dextrose flow from the controller, adjusted to units of .
is the exogenous dextrose flow into the body used to perturb the system, for example from TPN or a meal. is not announced to the controller in any fashion.
The sum of these 2, , is analogous to in the original model.
is the insulin flow from the controller, adjusted to units of . is analogous to in the original model.
The parameters in the above model were not altered from the original Van Herpe model. Time variant insulin sensitivity, volume of distribution and insulin half-life are not accounted for in the original model, thus the , and factors were added as a means to impose a time variant effect on these parameters. For a more thorough review of the Van Herpe model, including parameter values, please refer to the original article.22
In addition to the above analysis, the AI-based controller was compared to no control in a smaller scale simulation.
Statistical Methods
For each of the unique 126,000 simulations the mean glucose value and coefficient of variation (CV) were determined. These 2 values are thus presented as median of the means with 25-75% interquartile range (IQR), as recommended by a prior publication.28 CV is used as a measure of dispersion. Hyperglycemic data are presented as percentage time in range. Hypoglycemic data are presented as percentage time in range and a cumulative distribution function graph. Percentage in range is the percentage of all glucose values, for the particular control range and SE, that resided within the control range being tested. All values are rounded to the nearest one-tenth, except for hypoglycemic percentages which are rounded to the nearest one-hundredth. For purposes of this study hypoglycemia is defined as blood glucose < 70 mg/dl and hyperglycemia as blood glucose > 140 mg/dL. Dextrose infusion number 5 is nonclinical in nature and was included only to “stress” the controller, thus its results will be presented independently.
To assess which control range produces the best overall results, a novel closed loop glucose controller scoring system was created. The total score ranges from −40 to 100. Negative scores are allowed to significantly penalize glucose values < 50 mg/dl. The elements of this scoring system are: (1) percentage values in range 70-140 mg/dl, (2) CV, (3) percentage values > 140 mg/dl, (4) distribution of values < 70 mg/dl. The entirety of the scoring system is available in the supplementary material.
One of the authors (JD) was responsible for programming the AI-based controller and ICU patient mathematical model in LabVIEW, and interfacing this with a Microsoft SQL database for purposes of running this large scale simulation. The glucose SE and bias produced inaccurate glucose values that were then fed into the glucose controller at each time step, throughout the course of each simulation. During the simulations the mathematical model was updated every 60 seconds. However, the models glucose value was only fed into the controller for purposes of adjusting the exogenous flows of insulin and/or dextrose as determined by the controller, after adjusting for SE and bias, every 5 to 10 minutes depending on whether the controller was in a 5- or 10-minute cycle interval.
Results
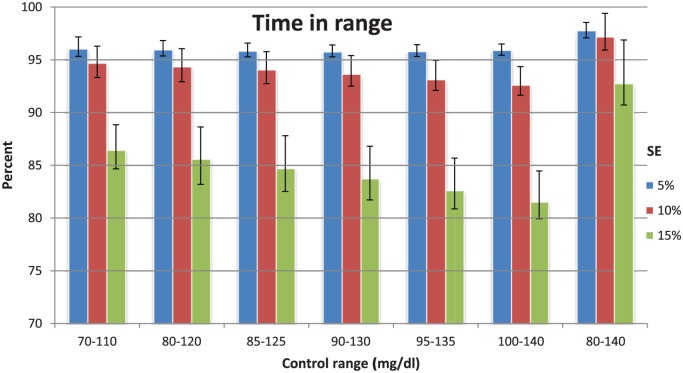
Figure 2 shows the percentage of values within the desired control range for each SE. Data are presented as median and IQR. With a SE of 10%, which is an accuracy rate 2 CE marked continuous blood-based glucose sensors have already achieved,29,30 the AI controller achieves rates in the range of 92.6-97.2%.
Figure 2.
Data are median values with IQR (25-75).
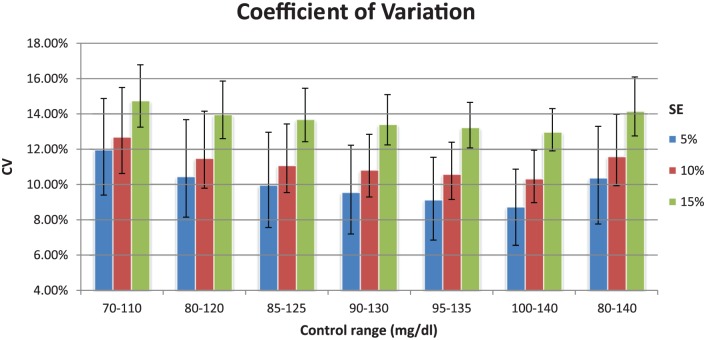
Figure 3 shows the CV as delineated by control range and SE. Data are presented as median and IQR. As would be expected, the CV increases within each control range as the SE increases. Note that the nadir of the CV, for each SE, occurs with control range 100-140 mg/dl.
Figure 3.
Median values with IQR (25-75).
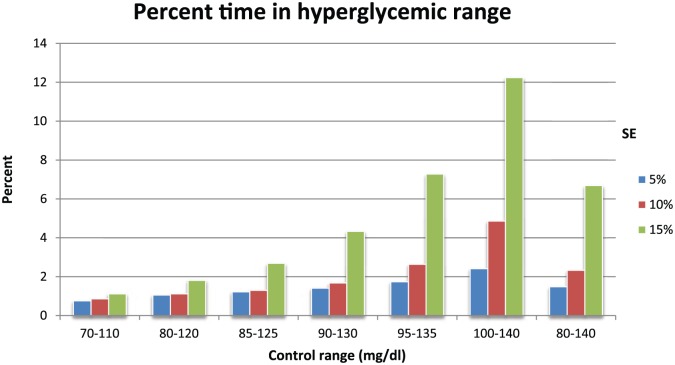
Figure 4 shows the percentage of values in the hyperglycemic range. As would be expected this value increases as the upper limit of the control range increases toward 140 mg/dl. The hyperglycemic rates were mostly <3%, except in cases where the upper limit of the control range was at or near 140 mg/dl and the SE was 15%.
Figure 4.
Percentage of all values for a given simulation that are in the hyperglycemic range (>140 mg/dl).
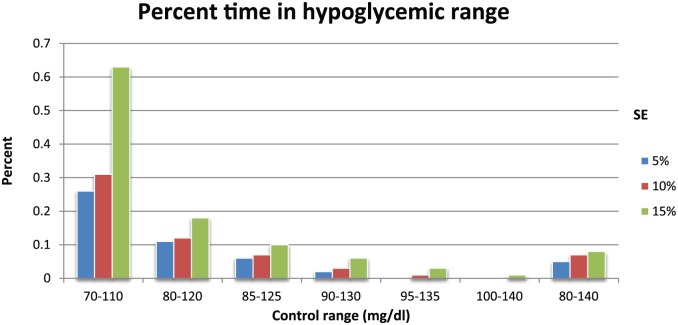
Figure 5 shows the percentage of values in the hypoglycemic range. As would be expected this value increases as the lower limit of the control range decreases toward 70 mg/dl, with the maximal value of 0.63% achieved with a control range of 70-110 mg/dl and SE of 15%. The majority of the values are <0.1%.
Figure 5.
Percentage of all values for a given simulation that are in the hypoglycemic range (< 70 mg/dl).
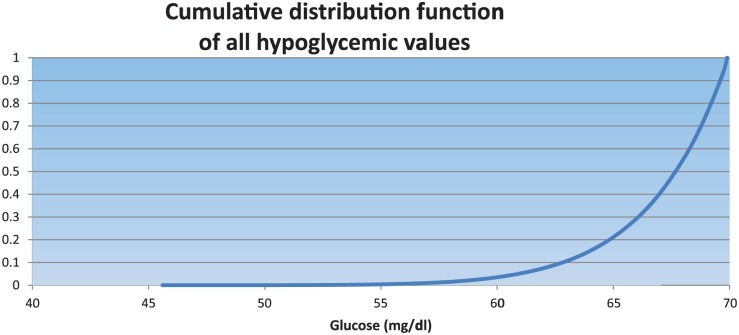
Figure 6 shows the cumulative distribution function plot of all hypoglycemic values. The median of all hypoglycemic values was 67.73 mg/dl (65.55-69.05).
Figure 6.
All simulations. For all hypoglycemic values, 95% are > 61 mg/dl. Time 0 values are excluded.
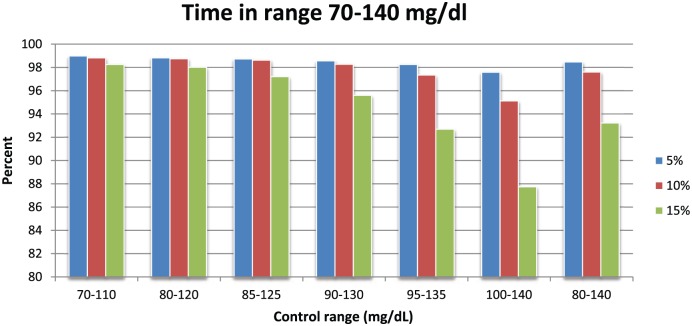
Figure 7 shows the percentage of values in the range of 70-140 mg/dl. For a SE of 10% the range was 95.1-98.8%.
Figure 7.
Percentage of all values for a given simulation that are in the 70-140 mg/dl range.
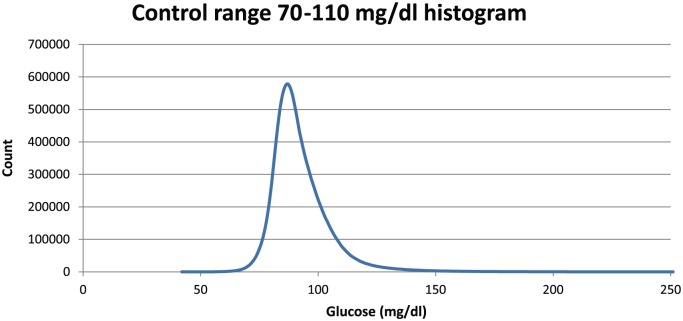
Figure 8 shows a histogram of glucose values for control range 70-110 mg/dl for all simulations run for this range. The controller’s extreme avoidance of hypoglycemia is manifested by the steep slope on the left side of this plot.
Figure 8.
Distribution of 11.6 million values for all 3 SEs combined. Peak occurrence is at 87 mg/dl. Time 0 values are excluded.
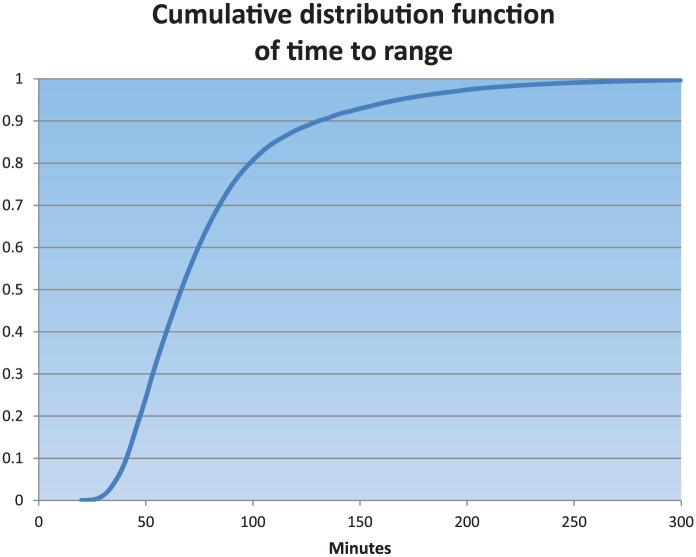
Figure 9 shows the cumulative distribution function plot of time to range when the starting glucose value was 200 mg/dl. Within 2 hours of starting the AI controller, 88% of the simulated patients were brought into range, regardless of the range being controlled to.
Figure 9.
All simulations with a starting glucose value of 200 mg/dl. For all simulations, 95% enter the given control range by 170 minutes.
Table 1 contains some of the above results for the fifth exogenous dextrose infusion, which is considered to be nonclinical in nature, and is utilized as a “stress test” of the glucose controller under study.
Table 1.
Results of “Stress Test” of Controller Using a Highly Variable Glucose Infusion to Perturb the System.
| Control range (mg/dl) | % time in range | CV | % time in hypoglycemic range (<70 mg/dl) | % time in range of 70-140 mg/dl | % time in hyperglycemic range (>140 mg/dl) |
|---|---|---|---|---|---|
| 70-110 | 84.8 (81.8-87.3) | 16.6 (15.7-17.8) | 1.59 | 96.5 | 2 |
| 80-120 | 83.6 (81.4-85.1) | 15.7 (14.9-16.6) | 0.41 | 96.7 | 2.9 |
| 90-130 | 81.8 (79.5-83.3) | 14.6 (14-15.4) | 0.04 | 95 | 5 |
| 100-140 | 80.8 (78.6-82.2) | 13.5 (12.9-14.1) | 0 | 90.2 | 9.8 |
Representative statistics for 4 control ranges when controller attempts to control a nonclinical, highly variable, exogenous dextrose infusion (#5 in supplement) with an SE of 10%. Percentage time in range and CV reported as median (25-75%), others as percentage of all glucose values in particular range.
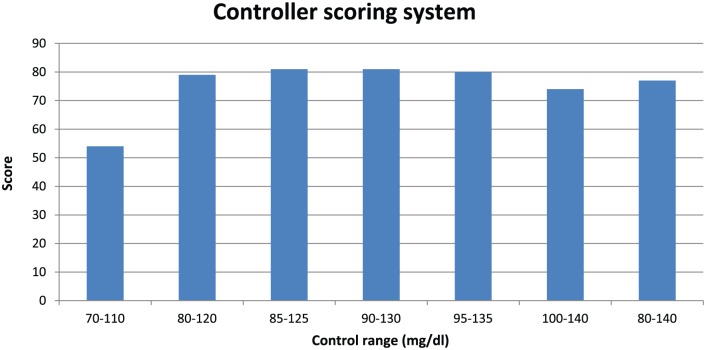
Figure 10 shows the results of the closed loop glucose controller scoring system as applied to all of the control ranges. Although all elements of this scoring system have been shown to correlate with clinical outcomes, this particular composite scoring system has not been shown to correlate with clinical outcomes.
Figure 10.
A composite score based on time in range 70-140 mg/dl, CV, time in hyperglycemic range (>140 mg/dl), and distribution of hypoglycemic values < 70 mg/dl.
Table 2 shows the comparison of the AI controller to no control.
Table 2.
Results of Comparison Study of No Control Versus AI Controller.
| Control method | % time in range | CV | % time in hypoglycemic range (<70 mg/dl) | % time in range of 70-140 mg/dl | % time in hyperglycemic range (>140 mg/dl) |
|---|---|---|---|---|---|
| No control | 5.1 (0.4-7.7) | 14.6 (12.3-16.5) | 0.19 | 20.4 | 79.4 |
| AI controller | 94.2 (92.1-96.9) | 11.6 (10.7-13) | 0.13 | 98.4 | 1.5 |
Representative statistics of no control versus AI controller for the following test scenario: control range 80-120 mg/dl, starting glucose 200 mg/dl, SE 10%, bias 0, all 4 clinical dextrose infusions (#s 1-4 in supplement) in all 80 in silico “patients.” Percentage time in range and CV reported as median (25-75%), others as percentage of all glucose values in particular range. See supplement for full explanation of this comparative study.
The controller was in a 5 minute cycle interval 30.2% of the time for all simulations combined. The controllers mean exogenous insulin dose across all simulations was 0.098 units/kg/hr. The controllers mean dextrose dose was 0.27 mg/kg/min, versus 3.2 mg/kg/min from the dextrose infusions used to “perturb” the system.
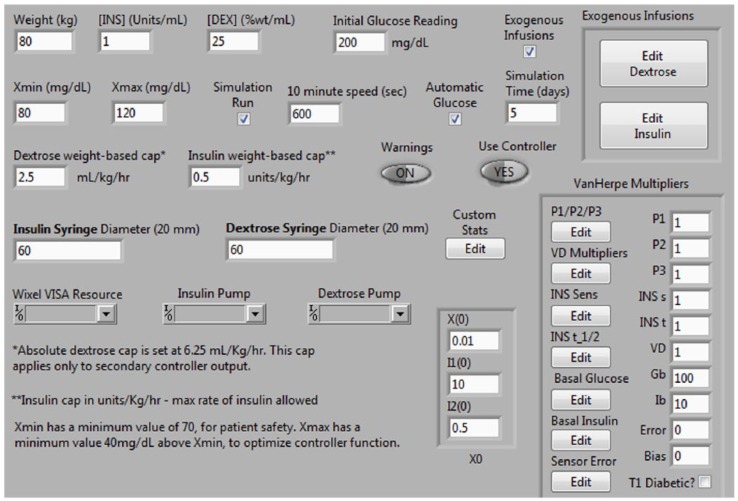
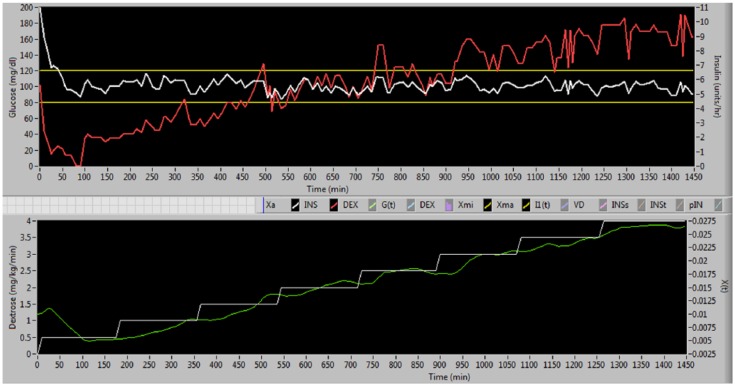
Figures 11 and 12 are screen shots from the simulator used in this study, and are presented for informational purposes only.
Figure 11.
Screen shot of simulator control panel. Although all of the Van Herpe model parameters can be adjusted in either a fixed or time variant fashion, for the purposes of this study only insulin sensitivity, insulin half-life, and volume of distribution were adjusted from the baseline parameters.22
Figure 12.
Screen shot of simulation with control range 80-120 mg/dl, starting glucose 200 mg/dl, SE 10%, bias 0, and dextrose infusion that starts at 0.5 mg/kg/min and increases by 0.5 mg/kg/min every 3 hours. In the upper panel the white line is glucose and the red line is insulin infusion. In the lower panel the white line is dextrose infusion and the green line is X(t) from Van Herpe model.
Discussion
The majority of efforts around glucose control are centered around developing an artificial pancreas for use in type I diabetic patients, however effective glucose control in the ICU setting also has the potential to significantly impact people’s lives given that there are tens of millions of ICU patients admitted annually throughout the world. In the U.S., ICU admissions account for 13.4% of inpatient dollars spent and 0.66% of the gross domestic product.31
Although the recently updated and FDA approved UVA-PADOVA simulator32 allows for expedited in silico testing of glucose controllers for type I diabetics, no similar FDA approved ICU simulator has been created which has hampered ICU glucose control efforts. However, given the enormous burden that ICU patients place on the national economy, the importance of such a simulator becomes self-evident. Through adaptation of the Van Herpe ICU minimal model we sought to create an early prototype of an ICU simulator, which we then used to test a novel AI-based glucose controller designed for use in the ICU setting.
Although the model used in this simulation is not as sophisticated as the S2013 UVA-PADOVA simulator model, in some sense it more closely mimics what occurs in a real-life ICU setting as the insulin sensitivity, insulin half-life and insulin/glucose volumes of distribution were set to be time variant in each patient. It should be noted that the range of the time variant curves for each of these 3 parameters were consistent with clinically relevant ranges, and that each curve was based on a clinically relevant situation as outlined in the supplementary material.
This early stage ICU model is deficient in many senses including lack of hepatic, renal, gut absorption, glucagon and endogenous glucose production related subsystems, and through use of simplistic glucose SE settings whereby the degree of SE and bias were fixed with each simulation, which is not consistent with a recent analysis of interstitial-based continuous glucose sensors.33 In addition, the starting glucose was chosen from 3 values instead of being randomly chosen from a probability distribution curve created from a large sample of actual ICU patients.34 Future modifications to the model will seek to incorporate those changes that are relevant to ICU patients and maintain consistency with the S2013 UVA-PADOVA simulator. Once a more complete model is developed it can be validated against a data set from ICU patients.
The AI-based controller that was tested in silico in this study shows potential promise toward achieving the goal of maximizing time in range while minimizing hypoglycemia, hyperglycemia and glucose variability.
This controller is especially suited toward eliminating severe hypoglycemia, as shown by no glucose values <45 mg/dl being recorded in 107 million values, and a typical rate of hypoglycemia (<70 mg/dl) of <0.1%. In addition, the rate of hyperglycemia (>140 mg/dl) with an SE of 10%, which should be achievable with current sensor technology, was < 3%.
The CVs were all typically <15%, with those measured with a glucose SE of 10% ranging from 10.3 to 12.7%. It has been shown in a prior study that CVs in this range can reduce mortality rates by at least 34% in both nondiabetic and diabetic patients, in the control ranges used in this study.35
When looking at averages across all 7 control ranges with an SE of 10%, the time in control range was 94.2% and the time in the 70-140 range was 97.8%. A recent clinical study showed that time in range of 70-140 mg/dl that was as high as seen in this in silico study reduced mortality rates by 46%.36 Effective glucose control, if ever achieved at the level shown in this study, will decrease mortality rates and save health care resources.37-44
When compared in silico to no control the AI-based controller shows superior results, which is not unexpected given the history of ICU patient hyperglycemia that was ignored prior to the Van den Berghe article,2 which raised the concept of even attempting glucose control.
Most traditional control experts are Electrical Engineers who tend to gravitate toward PID or MPC control methodologies. They tend to dismiss expert system controllers as they are not mathematically derived, but rather rely on heuristic reasoning. This study shows that when an AI-based controller is carefully designed by a domain expert8 who also has decades of clinical experience, that it may have the potential to improve on the results achieved by either PID or MPC controllers,45,46 although strictly speaking it is not valid to compare in silico results with clinical studies. Specifically, this simulation shows that this AI-based controller may be capable of achieving exceptional results, including (1) time in control range > 90%, (2) time in range 70-140 mg/dl > 95%, (3) severe hypoglycemia (<40 mg/dl) rate of 0, (4) hypoglycemia (40-69 mg/dl) rate < 0.1%, (5) CV < 13%, and (6) hyperglycemia (>140 mg/dl) rate < 3%.
Previous AI-based controllers have been based on fuzzy logic, which often employs look-up tables to determine partial truths. To our knowledge this is the first glucose controller that is based off of pure logic, with the basis for the logic being an in-depth study of the native glucose control system.8
While the results of this in silico study are encouraging, they will have to be confirmed in future studies in both animals and ICU patients to see if this AI-based glucose controller holds up to real-world settings.
Conclusion
An in silico analysis of a novel AI-based glucose controller designed for the ICU setting demonstrates its potential to maximize glucose time in range while at the same time minimizing the glucose metrics that increase mortality rates. Both animal and clinical testing will be required to validate these results.
Supplementary Material
Footnotes
Abbreviations: AI, artificial intelligence; CV, coefficient of variation; CE, Conformity European; ICU, intensive care unit; IQR, interquartile range; IV, intravenous; MPC, model predictive control; MIMO, multiple input multiple output; PID, proportional integral derivative; SE, sensor error; VA, Veterans Administration.
Declaration of Conflicting Interests: The author(s) declared the following potential conflicts of interest with respect to the research, authorship, and/or publication of this article: LD and JD are stock holders in Ideal Medical Technologies Inc.
Funding: The author(s) received no financial support for the research, authorship, and/or publication of this article.
Supplemental Material: The supplementary material is available at http://dst.sagepub.com/supplemental47
References
- 1. Furnary AP, Zerr KJ, Grunkemeier GL, Starr A. Continuous intravenous insulin infusion reduces the incidence of deep sternal wound infection in diabetic patients after cardiac surgical procedures. Ann Thorac Surg. 1999;67(2):352-360. [DOI] [PubMed] [Google Scholar]
- 2. Van den Berghe G, Wouters P, Weekers F, et al. Intensive insulin therapy in the critically ill patients. N Engl J Med. 2001;345(19):1359-1367. [DOI] [PubMed] [Google Scholar]
- 3. Devos P, Preiser J, Melot C. Impact of tight glucose control by intensive insulin therapy on ICU mortality and the rate of hypoglycemia: final results of the glucontrol study. Intensive Care Med. 2007;33(suppl 2):S189. [Google Scholar]
- 4. NICE-SUGAR Study Investigators, Finfer S, Chittock DR, et al. Intensive versus conventional glucose control in critically ill patients. N Engl J Med. 2009;360(13):1283-1297. [DOI] [PubMed] [Google Scholar]
- 5. Brunkhorst FM, Engel C, Bloos F, et al. Intensive insulin therapy and pentastarch resuscitation in severe sepsis. N Engl J Med. 2008;358(2):125-139. [DOI] [PubMed] [Google Scholar]
- 6. Wiener R, Wiener DC, Larson RJ. Benefits and risks of tight glucose control in critically ill adults: a meta-analysis. JAMA. 2008;300(8):933-944. [DOI] [PubMed] [Google Scholar]
- 7. Takehiro O, Yasuo S, Tatsuaki S, et al. Intensive versus intermediate glucose control in surgical intensive care unit patients. Diabetes Care. 2014;37:1516-1524. [DOI] [PubMed] [Google Scholar]
- 8. DeJournett L. Essential elements of the native glucoregulatory system, which, if appreciated, may help improve the function of glucose controllers in the intensive care unit setting. J Diabetes Sci Technol. 2010;4(1):190-198. [DOI] [PMC free article] [PubMed] [Google Scholar]
- 9. Wintergerst K, Deiss D, Buckingham B, et al. Glucose control in pediatric intensive care unit patients using an insulin-glucose algorithm. Diabetes Technol Ther. 2007;9(3):211-222. [DOI] [PubMed] [Google Scholar]
- 10. Bequette B. Analysis of algorithms for intensive care unit blood glucose control. J Diabetes Sci Technol. 2007;1(6):813-824. [DOI] [PMC free article] [PubMed] [Google Scholar]
- 11. Chase J, LeCompte A, Shaw G, et al. A benchmark data set for model based glycemic control in critical care. J Diabetes Sci Technol. 2008;2(4):584-594. [DOI] [PMC free article] [PubMed] [Google Scholar]
- 12. Leelarathna L, English S, Thabit H, et al. Feasibility of fully automated closed-loop glucose control using continuous subcutaneous glucose measurements in critical illness: a randomized controlled trial. Crit Care. 2013;17:R159. [DOI] [PMC free article] [PubMed] [Google Scholar]
- 13. Lunze K, Singh T, Walter M, Brendel M, Leonhardt S. Blood glucose control algorithms for type I diabetic patients: a methodological review. Biomed Signal Processing Control. 2013;8(2):107-119. [Google Scholar]
- 14. Atlas E, Nimri R, Miller S, Grunberg E, Phillip M. MD-Logic artificial pancreas system—a pilot study in adults with type 1 diabetes. Diabetes Care. 2010;33:1072-1076. [DOI] [PMC free article] [PubMed] [Google Scholar]
- 15. Miller S, Nimri R, Atlas E, Grunberg E, Phillip M. Automatic learning algorithm for the MD-Logic artificial pancreas system. Diabetes Technol Ther. 2011;13(10):983-990. [DOI] [PubMed] [Google Scholar]
- 16. Nimri R, Atlas E, Ajzensztejn M, Miller S, Oron T, Phillip M. Feasibility study of automated overnight closed-loop glucose control under MD-Logic artificial pancreas in patients with type 1 diabetes: the DREAM Project. Diabetes Technol Ther. 2012;14(8):728-735. [DOI] [PubMed] [Google Scholar]
- 17. Jackson P. Introduction to Expert Systems. 3rd ed. Essex, UK: Addison-Wesley; 1998. [Google Scholar]
- 18. Gulavani S, Kulkarni R. A review of knowledge based systems in medical diagnosis. Int J Inform Technol Knowledge Manage. 2009;2(2):269-275. [Google Scholar]
- 19. Ling S, Nguyen H. Natural occurrence of nocturnal hypoglycemia detection using hybrid particle swarm optimized fuzzy reasoning model. Artif Intell Med. 2012;55(3):177-184. [DOI] [PubMed] [Google Scholar]
- 20. Agrawal D, Kumar S, Kumar A, Gombar S, Trikha A, Anand S. Design of an assistive anaesthesia drug delivery control using knowledge based systems. Knowledge Based Systems. 2012;31:1-7. [Google Scholar]
- 21. DeJournett L. Computerized system for blood chemistry monitoring. 2015. Available at: http://patft.uspto.gov/netacgi/nph-Parser?Sect1=PTO1&Sect2=HITOFF&d=PALL&p=1&u=%2Fnetahtml%2FPTO%2Fsrchnum.htm&r=1&f=G&l=50&s1=8956321.PN.&OS=PN/8956321&RS=PN/8956321.
- 22. Herpe T, Espinoza M, Haverbeke N, Moor B, Van den Berghe G. Glycemia prediction in critically ill patients using an adaptive modeling approach. J Diabetes Sci Technol. 2007;1(3):348-356. [DOI] [PMC free article] [PubMed] [Google Scholar]
- 23. Pretty C, Le Compte A, Chase J, et al. Variability of insulin sensitivity during the first 4 days of critical illness: implications for tight glycemic control. Ann Intensive Care. 2012;2, 17. [DOI] [PMC free article] [PubMed] [Google Scholar]
- 24. Sampanis C. Management of hyperglycemia in patients with diabetes mellitus and chronic renal failure. Hippokratia. 2008;12(1):22-27. [PMC free article] [PubMed] [Google Scholar]
- 25. Boucher B, Wood G, Swanson J. Pharmacokinetic changes in critical illness. Crit Care Clin. 2006;22:255-271. [DOI] [PubMed] [Google Scholar]
- 26. Wichmann B, Hill I. An efficient and portable pseudo-random number generator. Applied Stat. 1982;31:188-190. [Google Scholar]
- 27. Wilinska M, Hovorka R. Glucose control in the intensive care unit by use of continuous glucose monitoring: What level of measurement error is acceptable? Clin Chem. 2014;60(12):1500-1509. [DOI] [PubMed] [Google Scholar]
- 28. Finfer S, Wernerman J, Preiser JC, et al. Clinical review: Consensus recommendations on measurement of blood glucose and reporting glycemic control in critically ill adults. Crit Care. 2013;17:229. [DOI] [PMC free article] [PubMed] [Google Scholar]
- 29. Schierenbeck F, Franco-Cereceda A, Jan Liska J. Evaluation of a continuous blood glucose monitoring system using central venous microdialysis. J Diabetes Sci Technol. 2012;6(6):1365-1371. [DOI] [PMC free article] [PubMed] [Google Scholar]
- 30. Crane B, Barwell N, Gopal P, et al. The development of a continuous intravascular glucose monitoring sensor. J Diabetes Sci Technol. 2015;9(4):751-761. [DOI] [PMC free article] [PubMed] [Google Scholar]
- 31. Society of Critical Care Medicine. Critical care statistics. Available at: http://www.sccm.org/Communications/Pages/CriticalCareStats.aspx.
- 32. Dalla Man C, Micheletto F, Lv D, Breton M, Kovatchev B, Cobelli C. The UVA/PADOVA type I diabetes simulator: new features. J Diabetes Sci Technol. 2014;8(1):26-34. [DOI] [PMC free article] [PubMed] [Google Scholar]
- 33. Facchinetti A, Del Favero S, Sparacino G, Castle J, Ward W, Cobelli C. Modeling the glucose sensor error. IEEE Trans Biomed Eng. 2014;61(3):620-629. [DOI] [PubMed] [Google Scholar]
- 34. Fish L, Moore A, Morgan B, Anderson R. Evaluation of admission blood glucose levels in the intensive care unit. Endocr Pract. 2007;13(7):705-710. [DOI] [PubMed] [Google Scholar]
- 35. Krinsley J. Glycemic variability: A strong independent predictor of mortality in critically ill patients. Crit Care Med. 2008;36(11):3008-3013. [DOI] [PubMed] [Google Scholar]
- 36. Krinsley J, Preiser JC. Time in blood glucose range 70 to 140 mg/dl >80% is strongly associated with increased survival in non-diabetic critically ill adults. Crit Care. 2015;19:179. [DOI] [PMC free article] [PubMed] [Google Scholar]
- 37. Omar A, Salama A, Allam M, et al. Association of time in blood glucose range with outcomes following cardiac surgery. BMC Anesthesiol. 2015;15:14. [DOI] [PMC free article] [PubMed] [Google Scholar]
- 38. Umpierrez G, Isaacs S, Bazargan N, You X, Thaler L, Kitabchi A. Hyperglycemia: an independent marker of in-hospital mortality in patients with undiagnosed diabetes. J Clin Endocrinol Metab. 2002;87(3):978-982. [DOI] [PubMed] [Google Scholar]
- 39. Sadhu A, Ang A, Ingram-Drake L, Martinez D, Hsueh W, Ettner S. Economic benefits of intensive insulin therapy in critically ill patients—the Targeted Insulin Therapy to Improve Hospital Outcomes (TRIUMPH) Project. Diabetes Care. 2008;31:1556-1561. [DOI] [PMC free article] [PubMed] [Google Scholar]
- 40. Ahmann A. Reduction of hospital costs and length of stay by good control of blood glucose levels. Endocr Pract. 2004;10(suppl 2):53-56. [DOI] [PubMed] [Google Scholar]
- 41. Krinsley J, Jones R. Cost analysis of intensive glycemic control in critically ill adult patients. Chest. 2006;129:644-650. [DOI] [PubMed] [Google Scholar]
- 42. Scurlocka C, Raikhelkara J, Mechanickb J. The economics of glycemic control in the ICU in the United States. Curr Opin Clin Nutr Metab Care. 2011;14:209-212. [DOI] [PubMed] [Google Scholar]
- 43. Krinsley J, Schultz M, Spronk P, et al. Mild hypoglycemia is strongly associated with increased intensive care unit length of stay. Ann Intensive Care. 2011;1:49. [DOI] [PMC free article] [PubMed] [Google Scholar]
- 44. Furnary A, Wu Y, Bookin S. Effect of hyperglycemia and continuous intravenous insulin infusions on outcomes of cardiac surgical procedures: the Portland diabetic project. Endocr Pract. 2004;10(suppl 2):21-33. [DOI] [PubMed] [Google Scholar]
- 45. Agus M, Steil G, Wypij D, et al. Tight glycemic control versus standard care after pediatric cardiac surgery. N Engl J Med. 2012;367:1208-1219. [DOI] [PMC free article] [PubMed] [Google Scholar]
- 46. Amrein K, Kachel N, Fries H, et al. Glucose control in intensive care: usability, efficacy and safety of Space GlucoseControl in two medical European intensive care units. BMC Endocr Disord. 2014;14:62. [DOI] [PMC free article] [PubMed] [Google Scholar]
- 47. Falciglia M, Freyberg R, Almenoff P, D’Alessio D, Render M. Hyperglycemia-related mortality in critically ill patients varies with admission diagnosis. Crit Care Med. 2009;37(12):3001-3009. [DOI] [PMC free article] [PubMed] [Google Scholar]
Associated Data
This section collects any data citations, data availability statements, or supplementary materials included in this article.


