

Abstract
Background:
The relationship between HbA1c and blood glucose averages has been characterized many times, yet, a unifying, mechanistic description is still lacking.
Methods:
We calculated the level of HbA1c from plasma glucose averages based solely on the in vivo rate of hemoglobin glycation, and the different turnover rates for erythrocytes of different ages. These calculations were then compared to the measured change of HbA1c due to changes in mean blood glucose (MBG), to complex models in the literature, and our own experiments.
Results:
Analysis of data on erythrocyte ageing patterns revealed that 2 separate RBC turnover mechanisms seem to be present. We calculated the mean red blood cell (RBC) life span within individuals to lie between 60 and 95 days. Comparison of expected HbA1c levels to data taken from continuous glucose monitors and finger-stick MBG yielded good agreement (r = .87, P < .0001). Experiments on the change with time of HbA1c induced by a change of MBG were in excellent agreement with our calculations (r = .98, P < .0001).
Conclusions:
RBC turnover seems to be dominated by a constant rate of cell loss, and a mechanism that targets cells of a specific age. Average RBC life span is 80 ± 10.9 days. Of HbA1c change toward treatment goal value, 50% is reached in about 30 days. Many factors contribute to the ratio of glycated hemoglobin, yet we can make accurate estimations considering only the in vivo glycation constant, MBG, and the age distribution of erythrocytes.
Keywords: glycated hemoglobin, erythrocyte life span, blood sugar control, continuous glucose monitor
Glycated HbA has stood as a clinical marker of long term glycemic control for well over 4 decades, and remained for the past 20 years, alongside fasting glucose, as the golden standard for diabetes control.1-6
The status of this clinical assay has motivated much research, particularly about its relationship with blood glucose levels, and its reaction time to changes in their mean values.3,7-17 Many of these studies have focused on finding an empirical relationship between HbA1c ratios and mean blood glucose concentration. It is clear that there is such a relationship, but there is certainly no agreement as to a single algebraic form for it.16,18 Recently, models have been proposed to infer this form,3,6,14 and have collectively incorporated fine details of hemoglobin glycation and turnover, such as the contribution from reticulocyte glycation in bone marrow, the rate of dissociation of glucose from hemoglobin, the effect of high glucose concentrations on RBC life span, etc. Yet, in each case, the main components are always the in vivo glycation rate of hemoglobin, and some model of erythrocyte life cycle.
The mechanism of hemoglobin glycation, especially at the amino-terminal of the β subunits, has been extensively studied and many experiments have been designed to calculate its reaction rate.19-22 On the other hand, and despite numerous efforts,23-25 not until recently has detailed data on human erythrocyte turnover cycles been made available.26
In our study, we analyze the experiments on biotinylated RBCs from Cohen et al26 and incorporate our findings to a straightforward method to calculate the percentage of HbA1c from a steady-state mean blood glucose value.
Research Design and Methods
Erythrocyte Survival
We extracted data on day to day, in vivo survival of biotinylated RBCs from Cohen et al26 using a MATLAB script developed by our group (version 8.6.0, R2015b; MathWorks Inc, Natick, MA, USA). The digitized survival curves, shown in the third figure in the source publication, belong to 6 diabetic patients and 6 nondiabetic controls. From the survival curves we can infer the proportion of RBCs of a specific age to the total, the mean RBC age, the average RBC life span, etc (mathematical details in Appendix A). While Cohen et al used a cubic function to characterize these curves, we found that a restricted quadratic form (ax2+bx+1) fitted the data well in every case (R2 > .99). A randomly chosen example is shown in Figure 1.
Figure 1.
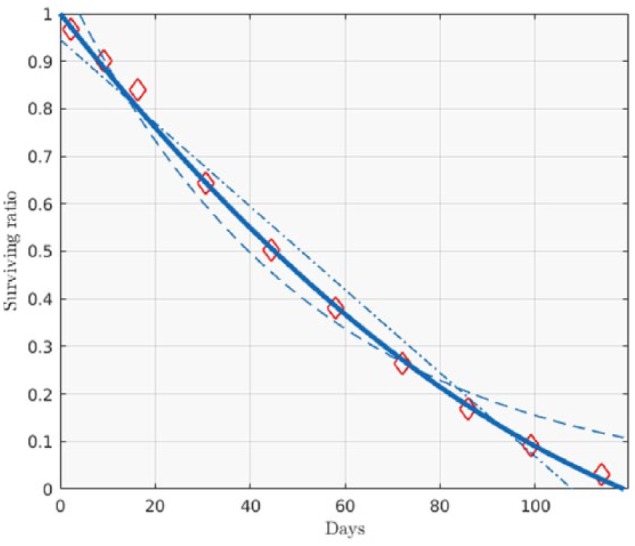
Example of biotinylated RBC survival curve (data from Cohen et al26). Diamonds are biotynilated RBC survival ratios. The following fits are shown: a constrained quadratic (R2 = .998, solid line), linear (homogeneous life-span model, R2 = .979, dot-dashed line), and exponential (random death model, R2 = .976, dashed line).
HbA Glycation
Knowing the general shape of RBC survival curves we can calculate the total HbA1c using an experimental estimate of the in vivo glycation rate of hemoglobin (here we use the constant 7.75×10⁻⁶(mMol×h)-1 reported by Mortensen et al21). To do so, we first calculate the proportion of glycated to non glycated HbA molecules within RBCs 1 day old, which is roughly the product of glucose concentration and the daily rate of glycation per Mol glucose. We then calculate the same proportion for erythrocytes that are 2 days old; this is equal to the proportion of HbA1c in RBCs 1 day old, plus a contribution given by the probability that a (nonglycated) HbA molecule within a 1-day-old RBC is glycated by the second day, all multiplied by a factor equal to the probability that an erythrocyte age 1 day survives 24 hours. We then iterate this process to calculate the contribution to total HbA1c from RBCs of every age, and obtain the total HbA1c ratio by adding each contribution (see Appendix B for details). It should be noted that although such first order kinetics have been used extensively before,3,27 coupling it with a nontrivial treatment of RBC clearance from empirical data makes the design novel. It would seem, also, that what Tahara and Shima called the “Weight Function” in their seminal work,3 was an indirect measurement of RBC survival.
Mean Blood Glucose and HbA1c Ratio
To test the accuracy of our method of calculating HbA1c to total HbA we used 4 sets of data: our own, previously published data of continuous glucose monitor (CGM) readings and HbA1c in 45 patients with chronic pancreatitis and 9 healthy volunteers,28 a set extracted from a study on 22 diabetic patients and 3 healthy controls,16 a larger, CGM-based study,17 and a large set (>600) of self-measured blood glucose and HbA1c percentages extracted from Kovatchev et al.10
Variation in time of HbA1c
With a minor variation of the procedure described above to calculate the ratio of glycated to total hemoglobin, we can estimate the rate of change of HbA1c due to a sudden change in mean blood glucose levels. Tahara et al3 describe such situation on a series of trials in which 9 patients were monitored closely after hospitalization for diabetes treatment. We used their data for validation of our estimations on the time course of HbA1c. In addition, we compared our output to a similar scenario modeled by Osterman-Golkar et al.14
Results
In many of the previous models of MBG and HbA1c, a daily turnover of only the oldest fraction of RBCs has been used,1,3,14 the so called homogeneous life-span model.29 The patent curvature of the erythrocyte survival function suggests a different approach and has important clinical consequences. Mainly, it contradicts the seemingly prevalent notion of a homogeneous RBC life span of about 120 days;4,30 while the interindividual average survival of the most longevous RBCs (maximum erythrocyte life span, MEL) is indeed about 120 days (116.6 ± 12.7 days), the biotinylated RBC measurements we analyzed yielded an average erythrocyte life span (AEL) of 80 ± 10.9 days. This means that in addition the well documented senescence-mediated clearance,31,32 contributions to RBC turnover from non age-related mechanisms should be included in calculating HbA1c ratios. Figure 1 shows an example of an experimental survival curve, our quadratic fit, a linear fit (homogeneous life-span model), and an exponential fit (random death model). The average age of circulating erythrocytes was 49 ± 6 days.
Unlike a general quadratic, a 2-parameter constrained form like the one we chose is not expected to be a de facto improvement over a linear function, which was our case for every fit. We further found that the 2 parameters, a and b, which describe each curve were not independent (the exponential fit a = αe-βx yielded R2 = .98). Therefore, survival curves of human erythrocytes can be characterized by a single parameter. In the following we use MEL to completely characterize an individual’s RBC turnover.
Self-measured, finger-stick MBG has 2 main inherent difficulties: the bias introduced by periodic rather than random measurements, and the inability of the subject to perform measurements during sleep. The former problem was addressed by Kovatchev et al.10 To assess possible biases from the latter, we compared separate CGM averages for awake and sleep periods on our healthy volunteers. In most cases the difference between averages was significant (10 of 11, ANOVA at α = 0.05), though it was not systematic (greater during sleep in only 7 out of 10 ), and only 1 presented a difference of more than 10 mg/dL (0.56 mMol). We then decided to append finger-stick measurements to CGM data.
We calculated 1-day moving averages of our CGM data (not shown) to confirm the plausibility of considering a 24 hour glycemic steady-state for our calculations.
In Figure 2 we plot the experimental HbA1c-MBG pairs alongside our estimations of HbA1c for a human with MEL = 90, 117, and 140 days. The curve belonging to the mean MEL (117 days) agrees with the overall data position (r = .87, P < .0001), while the enveloping curves (MEL = 90 and 140 days, the 2 extreme MEL values reported in Cohen et al 200826) spread toward the greater glucose density ranges, also in agreement with the experiments’ heteroscedasticity (a Kolmogorov-Smirnov test failed to reject the hypothesis that the data were standard Gaussian when normalized to a mean of MEL = 117 d, and spread of MEL = 134 d). It should be noted that experimental points in the higher MBG ranges group slightly closer to the lower (MEL = 90 d) estimate. This fact constitutes a nod to the sentiment that hyperglycemia reduces erythrocyte life span,18,25,29 though biotinylated RBC experiments failed to confirm such a notion.6,26 This inability of the biotinilated RBC experiments to resolve a difference between nondiabetic and diabetic RBC life spans does not allow us to treat these 2 cases separately. A likely consequence of this is the fact that the predicted variability of HbA1c in the nondiabetic cohort is slightly higher than the one reported in the literature (9.9% vs. 8.1%).
Figure 2.
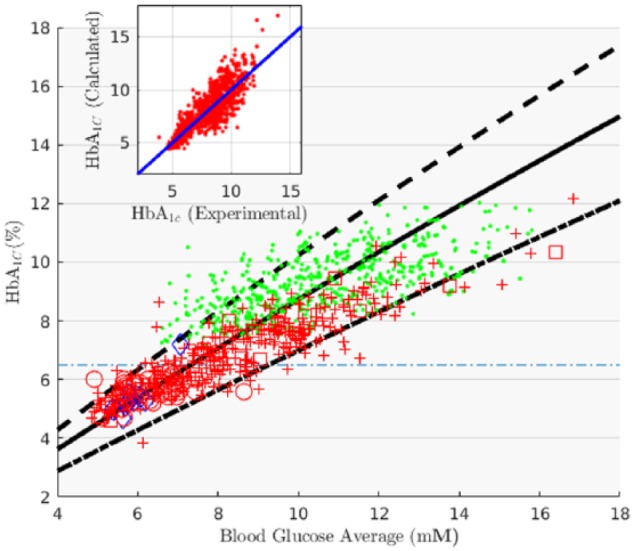
Calculated and experimental values of HbA1c % vs MBG (chronic pancreatitis patients from Beltrán del Río et al,28 circles; Healthy volunteers from Beltrán del Río et al,28 diamonds; diabetes mellitus from Kovatchev et al,10 dots; diabetes mellitus from Nathan et al,17 crosses; diabetes mellitus from Nathan et al,16 squares). The 3 predictions correspond to different values of erythrocyte life spans: MEL = 117d, solid line; MEL = 140d, dashed line; MEL = 97d, dot-dashed line. The inset shows the correlation between experimental and expected HbA1c values (MEL = 117d) of all combined data (dots in inset).
We calculated the expected change in time of HbA1c after a stepwise decrease in blood sugar average for 3 cases: a median MEL of 117 days, and 2 extreme cases MEL = 140 and 97 days. We normalized these calculations to percentage change and compared them to the equivalent experiment described in Tahara and Shima.3 The fit yielded quite good agreement: (r = .98, P < .0001), see Figure 3. Also, the HbA1c half-life we predicted (31 days) is consistent with values reported by Osterman-Golkar and Vesper, and Tahara and Shima.3,14 Finally, we found that equivalent calculations using a much more complicated model, shown in the fifth graph in Osterman-Golkar et al,14 are not only consistent but completely overlap our estimates (not shown, R2 > .999, P < .0001).
Figure 3.
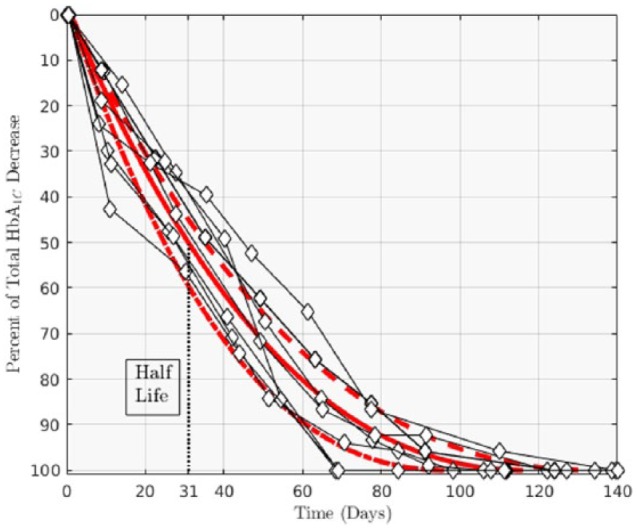
Rate for change of HbA1c % after a stepwise change in MBG. The 3 estimates correspond to calculations based on different erythrocyte life spans: MEL = 117d, solid line; MEL = 140d, dashed line; MEL = 97d, dot-dashed line. Data in diamonds are measurements from Tahara and Shima.3
Conclusions
The analysis done on RBC survival curves from Cohen et al26 suggests an average erythrocyte circulation time of 80 ± 11 days. It was found that in the population examined, a single parameter (MEL, AEL, etc ) was enough to fully characterize an individuals’ RBC turnover. The shape of the survival functions speaks of 2 main mechanisms for RBC turnover: a constant, seemingly random loss (not dependent on RBC age), and a sudden, senescence-mediated cutoff around a definite age. From our calculations we inferred that only about 38 ± 9.6% of erythrocytes survive to reach this active clearance age. The small sample (N = 12) reported in Cohen et al,26 is substantial enough for us to conclude that erythrocyte survival is more complex than what the commonly used homogeneous life span model describes, but not to draw a detailed picture of the distribution of RBC life spans in the general population, less so in smaller cohorts of clinical relevance. Our estimations provided an accurate and parsimonious portrayal of HbA1c dynamics through a mechanistic approach, rather than the more common linear descriptions in the literature.18 The method presented inherently incorporates a mean and a spread, from which we inferred a maximum RBC life span average and standard deviation of 117 ± 12 days. Measurements yielded an HbA1c half-life between 25 and 35 days, and 50 to 70 days to reach 80% of an HbA1c goal value.
Acknowledgments
MBDR thanks the reviewers of this manuscript for their valuable input and time.
Appendix A
Erythrocyte Turnover Analysis
From a survival curve S(t) we obtain the RBC age density function ϱ(t), through the relationship:
under the assumption of steady erythropoiesis. Average RBC age per individual is therefore:
For quadratic S(t) we inferred:
AEL is calculated through the life span probability density:
where β = ϱ(MEL)/ϱ(0) is the probability that an erythrocyte survives until maximum life span, and δ is a Dirac density function.
Appendix B
HbA1c Estimation
To calculate HbA1c we used a simple Markov model: if is the ratio of RBCs aged i to RBCs aged 1, and , then the probability that an RBC survives day j is . The contribution to HbA1c percentage by erythrocytes aged 1 day is where γ is the per-day, per Mol, in vivo glycation rate, and σ is the MBG concentration. The contribution to HbA1c from RBCs aged j days is then: , the contribution of already glycated hemoglobin molecules in surviving erythrocytes plus the contribution from newly formed HbA1c. Total ratio is then calculated with:
Footnotes
Abbreviations: AEL, average erythrocyte life span; CGM, continuous glucose monitor; MBG, mean blood glucose; MEL, maximum erythrocyte life span; RBC, red blood cell.
Declaration of Conflicting Interests: The author(s) declared no potential conflicts of interest with respect to the research, authorship, and/or publication of this article.
Funding: The author(s) received no financial support for the research, authorship, and/or publication of this article.
References
- 1. Bunn HF, Haney D, Kamin S, Gabbay K, Gallop P. The biosynthesis of human hemoglobin A1c. Slow glycosylation of hemoglobin in vivo. J Clin Invest. 1976;57(6):1652. [DOI] [PMC free article] [PubMed] [Google Scholar]
- 2. Diabetes Control and Complications Trial Research Group. The effect of intensive treatment of diabetes on the development and progression of long-term complications in insulin-dependent diabetes mellitus. N Engl J Med. 1993;329(14):977-986. [DOI] [PubMed] [Google Scholar]
- 3. Tahara Y, Shima K. Kinetics of HbA1c, glycated albumin, and fructosamine and analysis of their weight functions against preceding plasma glucose level. Diabetes Care. 1995;18(4):440-447. [DOI] [PubMed] [Google Scholar]
- 4. Freeman DL. Harrison’s principles of internal medicine. JAMA. 2001;286(8):971-972. [Google Scholar]
- 5. International Expert Committee. International Expert Committee report on the role of the A1C assay in the diagnosis of diabetes. Diabetes Care. 2009;32(7):1327-1334. [DOI] [PMC free article] [PubMed] [Google Scholar]
- 6. Lledó-García R, Mazer NA, Karlsson MO. A semi-mechanistic model of the relationship between average glucose and HbA1c in healthy and diabetic subjects. J Pharmacokinet Pharmacodyn. 2013;40(2):129-142. [DOI] [PubMed] [Google Scholar]
- 7. Shi K, Tahara Y, Noma Y, Yasukawa K, Shima K. The response of glycated albumin to blood glucose change in the circulation in streptozotocin-diabetic rats—comparison of theoretical values with experimental data. Diabetes Res Clin Pract. 1992;17(3):153-160. [DOI] [PubMed] [Google Scholar]
- 8. Tahara Y, Shima K. The response of GHb to stepwise plasma glucose change over time in diabetic patients. Diabetes Care. 1993;16(9):1313-1314. [DOI] [PubMed] [Google Scholar]
- 9. Gould BJ, Davie SJ, Yudkin JS. Investigation of the mechanism underlying the variability of glycated haemoglobin in non-diabetic subjects not related to glycaemia. Clin Chim Acta. 1997;260(1):49-64. [DOI] [PubMed] [Google Scholar]
- 10. Kovatchev BP, Cox DJ, Straume M, Farhy LS. Association of self-monitoring blood glucose profiles with glycosylated hemoglobin in patients with insulin-dependent diabetes. Methods Enzymol. 1999;321:410-417. [DOI] [PubMed] [Google Scholar]
- 11. Cohen RM, Holmes YR, Chenier TC, Joiner CH. Discordance between HbA1c and fructosamine evidence for a glycosylation gap and its relation to diabetic nephropathy. Diabetes Care. 2003;26(1):163-167. [DOI] [PubMed] [Google Scholar]
- 12. Derr R, Garrett E, Stacy GA, Saudek CD. Is HbA1c affected by glycemic instability? Diabetes Care. 2003;26(10):2728-2733. [DOI] [PubMed] [Google Scholar]
- 13. Nuttall FQ, Gannon MC, Swaim WR, Adams MJ. Stability over time of glycohemoglobin, glucose, and red blood cell survival in hematologically stable people without diabetes. Metabolism. 2004;53(11):1399-1404. [DOI] [PubMed] [Google Scholar]
- 14. Osterman-Golkar SM, Vesper HW. Assessment of the relationship between glucose and A1c using kinetic modeling. J Diabetes Complications. 2006;20(5):285-294. [DOI] [PubMed] [Google Scholar]
- 15. Inaba M, Okuno S, Kumeda Y, et al. Glycated albumin is a better glycemic indicator than glycated hemoglobin values in hemodialysis patients with diabetes: effect of anemia and erythropoietin injection. J Am Soc Nephrol. 2007;18(3):896-903. [DOI] [PubMed] [Google Scholar]
- 16. Nathan D, Turgeon H, Regan S. Relationship between glycated haemoglobin levels and mean glucose levels over time. Diabetologia. 2007;50(11):2239-2244. [DOI] [PMC free article] [PubMed] [Google Scholar]
- 17. Nathan DM, Kuenen J, Borg R, Zheng H, Schoenfeld D, Heine RJ. Translating the A1C assay into estimated average glucose values. Diabetes Care. 2008;31(8):1473-1478. [DOI] [PMC free article] [PubMed] [Google Scholar]
- 18. Makris K, Spanou L. Is there a relationship between mean blood glucose and glycated hemoglobin? J Diabetes Sci Technol. 2011;5(6):1572-1583. [DOI] [PMC free article] [PubMed] [Google Scholar]
- 19. Higgins PJ, Bunn HF. Kinetic analysis of the nonenzymatic glycosylation of hemoglobin. J Biol Chem. 1981;256(10):5204-5208. [PubMed] [Google Scholar]
- 20. Mortensen HB, Christophersen C. Glucosylation of human haemoglobin a in red blood cells studied in vitro. Kinetics of the formation and dissociation of haemoglobin A 1c. Clin Chim Acta. 1983;134(3):317-326. [DOI] [PubMed] [Google Scholar]
- 21. Mortensen HB, Vølund A, Christophersen C. Glucosylation of human haemoglobin a. dynamic variation in HbA 1c described by a biokinetic model. Clin Chim Acta. 1984;136(1):75-81. [DOI] [PubMed] [Google Scholar]
- 22. Svendsen PA, Christiansen JS, Søegaard U, Nerup J. Synthesis of glycosylated haemoglobin in vivo. Diabetologia. 1981;21(6):549-553. [DOI] [PubMed] [Google Scholar]
- 23. Russo V, Barker-Gear R, Gates R, Franco R. Studies with biotinylated RBC: (1) use of flow cytometry to determine posttransfusion survival and (2) isolation using streptavidin conjugated magnetic beads. In: Magnani M, DeLoach JR, eds. The Use of Resealed Erythrocytes as Carriers and Bioreactors. New York, NY: Springer; 1992:101-107. [DOI] [PubMed] [Google Scholar]
- 24. Kumpel B, Austin E, Lee D, Jackson D, Judson P, Chapman G. Comparison of flow cytometric assays with isotopic assays of 51chromium-labeled cells for estimation of red cell clearance or survival in vivo. Transfusion. 2000;40(2):228-239. [DOI] [PubMed] [Google Scholar]
- 25. Virtue MA, Furne JK, Nuttall FQ, Levitt MD. Relationship between GHb concentration and erythrocyte survival determined from breath carbon monoxide concentration. Diabetes Care. 2004;27(4):931-935. [DOI] [PubMed] [Google Scholar]
- 26. Cohen RM, Franco RS, Khera PK, et al. Red cell life span heterogeneity in hematologically normal people is sufficient to alter HbA1c. Blood. 2008;112(10):4284-4291. [DOI] [PMC free article] [PubMed] [Google Scholar]
- 27. Beach KW. A theoretical model to predict the behavior of glycosylated hemoglobin levels. J Theoret Biol. 1979;81(3):547-561. [DOI] [PubMed] [Google Scholar]
- 28. Beltrán del Río M, Georgiev GI, Cercone R, Tiwari M, Rilo HL. Continuous glucose monitoring analysis as predictor of islet yield and insulin requirements in autologous islet transplantation after complete pancreatectomy. J Diabetes Sci Technol. 2014;8(6):1097-1104. [DOI] [PMC free article] [PubMed] [Google Scholar]
- 29. Lledó-García R, Kalicki RM, Uehlinger DE, Karlsson MO. Modeling of red blood cell life-spans in hematologically normal populations. J Pharmacokinet Pharmacodyn. 2012;39(5):453-462. [DOI] [PubMed] [Google Scholar]
- 30. Ladyżyński P, Wójcicki JM, Bak M, et al. Validation of hemoglobin glycation models using glycemia monitoring in vivo and culturing of erythrocytes in vitro. Ann Biomed Eng. 2008;36(7):1188-1202. [DOI] [PubMed] [Google Scholar]
- 31. Kiefer CR, Snyder LM. Oxidation and erythrocyte senescence. Curr Opin Hematol. 2000;7(2):113-116. [DOI] [PubMed] [Google Scholar]
- 32. Lutz H. Innate immune and non-immune mediators of erythrocyte clearance. Cell Molec Biol. 2004;50(2):107-116. [PubMed] [Google Scholar]