

Abstract
Background
Our objective was to study the impact of foot complications on 10 year mortality independent of other demographic and biological risk factors in a racially and socioeconomically diverse managed care population with access to high-quality medical care.
Methods
We studied 6,992 patients with diabetes in Translating Research Into Action for Diabetes (TRIAD), a prospective observational study of diabetes care in managed care. Foot complications were assessed using administrative claims data. The National Death Index was searched for deaths over 10 years of followup (2000–2009).
Results
Charcot neuroosteoarthropathy (CN) and diabetic foot ulcer with debridement (DFU) were associated with an increased risk of mortality; however, the associations were not significant in fully adjusted models. Lower extremity amputation (LEA) was associated with an increased risk of mortality in both unadjusted (HR 3.21, 95% CI 2.50–4.12) and fully adjusted models (HR 1.84, 95% CI 1.28–2.63). When we examined the associations between LEA and mortality stratified by sex and race, risk was increased in men (HR 1.96, 95% CI 1.25–3.07), Hispanics (HR 5.17, 95% CI 1.48–18.01), and Whites (HR 2.18, 95% CI 1.37–3.47). In sensitivity analyses, minor LEA tended to increase the risk of mortality (HR 1.48, 95% CI 0.92–2.40) and major LEA was associated with a significantly higher risk of death at 10 years (HR 1.89, 95% CI 1.18–3.01).
Conclusions
In this managed care population with access to high-quality medical care, LEA remained a robust independent predictor of mortality. The association was strongest in men and differed by race.
Introduction
Diabetes-related foot complications have a substantial impact on morbidity, mortality, and health care expenditures (1–2). Charcot neuroosteoarthropathy (CN) (3), foot ulceration (DFU) (4–5), and lower extremity amputation (LEA) (4–6) have all been associated with mortality. It is not clear what the independent contribution of each of these complications is to all cause mortality in people with diabetes.
Identification of patients with diabetes with feet at risk, combined with preventive care, can prevent LEA, and improved cardiovascular risk factor management can improve long-term survival (7–9). Patients with diabetes receiving care from managed care organizations have access to preventive care and receive very good diabetes-related processes and intermediate outcomes of care (10). As a result, racial and ethnic minorities with diabetes receiving care through managed care organizations appear to have lower rates of LEA than similar populations with less access to care (11–13).
Our objective was to extend those previous studies by examining the impact of foot complications on 10 year mortality independent of other demographic and biological risk factors in a racially and socioeconomically diverse managed care population. We hypothesized that LEA would remain a risk factor for mortality but that the racial and ethnic differences in LEA risk observed in studies of populations with less consistent access to care, and the impact of LEA on survival, would be attenuated in this managed care population with access to high-quality medical care.
Patients and Methods
Study population
Translating Research Into Action for Diabetes (TRIAD) has been described elsewhere (14). TRIAD studied a random sample of adults with diabetes enrolled in 10 managed care health plans in eight states (California, Hawaii, Indiana, Michigan, New York, New Jersey, Pennsylvania, and Texas) that served ~180,000 patients with diabetes. Patients were eligible to participate if they were at least 18 years of age, lived in the community, were not pregnant, had diabetes for at least one year, spoke either English or Spanish, were continuously enrolled in the health plan for at least 18 months, used at least one service during that time, and could give informed consent. Institutional review boards reviewed and approved the study at each participating site and all participants provided informed consent.
In 2000–2001, we administered a survey by computer-assisted telephone interview or in writing by mail. In addition, centrally trained reviewers used standardized methods to abstract medical records. Health plan administrative data were collected for 1999 through 2003. 11,927 people initially consented to participate (69% CASRO response rate) and 8,820 provided survey and medical record data. The analytic sample for this study included participants who had survey and medical record data at baseline and were enrolled at sites participating in the 2010–2013 TRIAD Legacy Study (N=6,992). The analytic sample did not include data from health plan participants in Hawaii.
Outcomes
Each year, we obtained information on TRIAD decedents using National Death Index (NDI) Plus searches (15). Deaths were verified by matching name, date of birth, sex, and social security number of the decedent with data supplied by the NDI. The sensitivity of NDI has been shown to range from 87% to 98% (16). Different combinations of identifiers excluding social security number correctly identify 83–92% of decedents and 92–99% of living individuals, making NDI an accurate means of ascertaining vital status even without social security numbers (17). Vital status was determined for all TRIAD Legacy Study participants through 31 December 2009.
Primary predictors
We used 1999–2003 health plan administrative data to determine the 3-year period prevalence of the three specific foot conditions: Charcot neuroosteoarthropathy (CN), diabetic foot ulcer (DFU), and lower extremity amputation (LEA). CN was defined as the presence of the International Classification of Diseases, 9th Revision (ICD9), diagnosis code 713.5 in any inpatient or outpatient records. DFUs were defined using either ICD9 codes 707.1x or 707.9 in any inpatient or outpatient records. To better define people with active DFUs (rather than simply a remote history of DFU), we also required that participants have at least one CPT code for debridement (11040, 11041, 11042, 11043, or 11044). LEA was defined as the presence of at least one ICD9 procedure code for LEA (84.11, 84.12, 84.13–84.16, or 84.17–84.19), ICD9 status code for LEA (v49.7), or CPT code for LEA (27590-8, 27880-9, 28800, 28805, 28810, 28820, or 28825) in any inpatient or outpatient records. We defined minor LEA as toe or transmetatarsal amputation and major LEA as any amputation below or above the knee. We defined each person as having none or one or more foot conditions and examined the occurrence of prevalent conditions using a Venn diagram. We then used a hierarchy to place each person with at least one prevalent foot condition into one of three mutually exclusive groups: any CN (n=55), DFU (n=205), or LEA with or without DFU (n=101).
Covariates
We assessed demographic variables (age, sex, race/ethnicity, education, and income), diabetes-specific variables (type of diabetes, duration of diabetes, treatment for diabetes, and HbA1c), and other clinical variables (body mass index, systolic blood pressure, low density lipoprotein cholesterol, smoking, history of microvascular complications, history of macrovascular complications, and Charlson comorbidity index) as possible effect modifiers and confounders. Type 1 diabetes was defined by insulin use (without the use or oral antidiabetic agents) and age at diagnosis of diabetes < 30 years; all others were defined as having type 2 diabetes. Smoking was considered present if the participant reported current smoking some days or every day in the past year. The number of comorbidities was defined using the Charlson index, a weighted measure of comorbid conditions associated with mortality (18).
Statistical Analysis
We described the sample population using means (standard deviation) for continuous variables and frequencies for categorical variables. We determined the percent of the sample who had died on or before December 31, 2009 and the percent who were still alive. We described the distribution of baseline sociodemographic variables and health factors stratified by vital status and used student t-tests and chi-square tests for comparisons.
For each primary predictor of all-cause mortality (CN, DFU, LEA), we constructed a series of Cox proportional hazard models. First, we constructed unadjusted models to determine if each predictor was associated with the outcome. Second, we constructed fully-adjusted models including covariates selected because of their known association with foot complications to determine if each primary predictor remained significant even after adjustment. At both stages, the Cox proportional hazards models also included a stratum statement for health plan/provider group to account for the clustered study design and the correlation among participants within health plans and provider groups. All models excluded persons with any missing data for any of the covariates in the model.
In sensitivity analyses, we stratified by age, sex, race/ethnicity, and smoking status to develop stratum-specific Cox proportional hazards models for the association between LEA and mortality. Additional sensitivity analyses included evaluation of any LEA as a predictor of mortality (regardless of CN or DFU status because 7 patients with CN also underwent LEA) and evaluation of minor (toe or transmetatarsal) and major LEA (below or above the knee) as predictors of mortality.
All analyses were performed using SAS version 9.3 (SAS Institute, Cary, NC).
Results
Between 1999 and 2003, 55 (1%) patients had a diagnosis of CN, 205 (3%) had a diagnosis of at least one DFU with active debridement, and 101 (2%) had lower extremity amputation procedures. There were 6,631 (95%) patients with none of the above foot conditions.
After 10 years of follow-up, 1,956 (29%) participants had died. The mean years until death was 7.7 ± 2.3. Those who died were more likely to be older and men, to be of NonHispanic White race/ethnicity, and to have lower education and income. They were more likely to have type 2 diabetes, to have longer duration of diabetes, and to be treated with insulin. They were also more likely to have lower BMI and higher systolic blood pressure, to be smokers, and to have histories of retinopathy, nephropathy, neuropathy, hypertension, coronary heart disease, congestive heart failure and peripheral vascular disease. Not unsurprising, they were also more likely to have higher Charlson indices (Table 1).
Table 1.
Characteristics of the study population using baseline characteristics and mortality data ascertained from National Death Index 2000–2009.
| Total sample | Dead | Alive | pvalue | |
|---|---|---|---|---|
| N | 6992 | 1956 | 5036 | |
| Age, years (missing=2) | 61 ± 13 | 69 ± 11 | 59 ± 13 | <0.0001 |
| Male sex | 3188 (46%) | 1003 (51%) | 2185 (43%) | <0.0001 |
| Race/ethnicity (missing=298) | <0.0001 | |||
| Hispanic | 1250 (19%) | 304 (16%) | 946 (20%) | |
| African American | 1373 (21%) | 373 (20%) | 1000 (21%) | |
| Non-Hispanic White | 3395 (51%) | 1056 (57%) | 2339 (48%) | |
| Other | 676 (10%) | 129 (7%) | 547 (11%) | |
| Education (missing=110) | <0.0001 | |||
| Some high school or less | 1800 (26%) | 686 (36%) | 1114 (22%) | |
| High school degree | 1921 (28%) | 513 (38%) | 1390 (28%) | |
| Some college | 1927 (28%) | 452 (24%) | 1475 (30%) | |
| College degree or higher | 1234 (18%) | 247 (13%) | 987 (20%) | |
| Annual income (missing=735) | <0.0001 | |||
| <$15,000 | 2106 (34%) | 790 (47%) | 1316 (29%) | |
| $15,000–40,000 | 1902 (30%) | 549 (33%) | 1353 (30%) | |
| $40,000–75,000 | 1411 (23%) | 256 (15%) | 1155 (25%) | |
| >$75,000 | 838 (13%) | 89 (5%) | 749 (16%) | |
| Type of diabetes (missing=380) | <0.0001 | |||
| Type 1 | 362 (5%) | 53 (3%) | 309 (6%) | |
| Type 2 | 6250 (95%) | 1749 (97%) | 4501 (94%) | |
| Duration of diabetes, years (missing=380) | 12 ± 10 | 15 ± 11 | 11 ± 10 | <0.0001 |
| Treatment for diabetes | <0.0001 | |||
| Diet only | 479 (7%) | 117 (6%) | 362 (7%) | |
| Oral medication only | 4204 (60%) | 1038 (53%) | 3166 (63%) | |
| Insulin only | 1428 (21%) | 495 (25%) | 933 (19%) | |
| Insulin and oral medication | 881 (13%) | 306 (16%) | 575 (12%) | |
| HbA1c, % (missing=615) (mmol/mol) | 8.0 ± 1.9 (64 ± 21) | 7.9 ± 1.9 (63 ± 21) | 8.0± 1.8 (64 ± 20) | 0.0994 |
| Body Mass Index, kg/m2 (missing=226) | <0.0001 | |||
| < 25 | 995 (15%) | 348 (18%) | 647 (13%) | |
| 25 to < 30 | 2093 (31%) | 599 (32%) | 1494 (31%) | |
| 30 to < 40 | 1864 (28%) | 484 (26%) | 1380 (28%) | |
| ≥40 | 1814 (27%) | 452 (24%) | 1362 (28%) | |
| Systolic blood pressure, mmHg (missing=361) | 137 ± 19 | 139 ± 20 | 136 ± 19 | <0.0001 |
| LDL cholesterol, mg/dL (missing=1885) | 113 ± 34 | 112 ± 36 | 114 ± 33 | 0.1930 |
| Smoking (in past year) (missing=91) | 1290 (19%) | 398 (21%) | 892 (18%) | 0.0093 |
| Health history | ||||
| Diabetic retinopathy | 1162 (17%) | 420 (21%) | 742 (15%) | <0.0001 |
| Diabetic nephropathy | 871 (12%) | 398 (20%) | 473 (9%) | <0.0001 |
| Microalbuminuria | 537 (8%) | 155 (8%) | 382 (8%) | 0.6328 |
| Diabetic peripheral neuropathy | 1289 (18%) | 485 (25%) | 804 (16%) | <0.0001 |
| Hypertension | 4824 (69%) | 1519 (78%) | 3305 (66%) | <0.0001 |
| Dyslipidemia | 3169 (45%) | 895 (46%) | 2274 (45%) | 0.5881 |
| Congestive heart failure | 742 (11%) | 465 (24%) | 277 (6%) | <0.0001 |
| Coronary heart disease | 1693 (24%) | 769 (39%) | 924 (18%) | <0.0001 |
| Peripheral vascular disease | 741 (11%) | 377 (19%) | 364 (7%) | <0.0001 |
| Charlson comorbidity index (missing=27) | <0.0001 | |||
| 0 or 1 | 2809 (40%) | 415 (21%) | 2394 (48%) | |
| 2 or 3 | 3013 (43%) | 884 (45%) | 2129 (42%) | |
| 4 or more | 1143 (16%) | 645 (33%) | 498 (10%) | |
| Foot complications | ||||
| Charcot foot (missing=306) | 55 (1%) | 24 (1%) | 31 (1%) | 0.0048 |
| Diabetic foot ulcer (missing=156) | 205 (3%) | 93 (5%) | 112 (2%) | <0.0001 |
| Lower extremity amputation (missing=260) | 101 (2%) | 68 (4%) | 33 (1%) | <0.0001 |
Hazard ratios and corresponding 95% confidence intervals for the associations between CN, DFU, or LEA and all-cause mortality are shown in Table 2. Relative to those with no foot complications, those with LEA had an 84% higher risk of all-cause mortality after adjusting for age, sex, race/ethnicity, income, diabetes treatment, HbA1c, BMI, LDL-cholesterol, smoking status, history of diabetic nephropathy, myocardial infarction, congestive heart failure, and peripheral vascular disease. (Hazard Ratio (HR) 1.84, 95% Confidence Interval (CI) 1.28–2.63). Those reporting CN or DFU had higher unadjusted all-cause mortality rates compared to those without foot complications but these associations did not remain statistically significant after adjustment.
Table 2.
Unadjusted and Adjusted Cox Proportional Hazards Models predicting all-cause mortality.
| Unadjusted | Fully Adjusted* | |
|---|---|---|
| Charcot foot | 1.87 (1.24–2.81) | 1.25 (0.72–2.16) |
| Diabetic foot ulcer | 1.93 (1.56–2.39) | 1.18 (0.86–1.62) |
| Lower extremity amputation | 3.21 (2.50–4.12) | 1.84 (1.28–2.63) |
Adjusted for: age, sex, race/ethnicity, income, diabetes treatment, HbA1c, BMI, LDL cholesterol, smoking, and history of congestive heart failure, myocardial infarction, diabetic nephropathy, and peripheral vascular disease.
Age, sex, race/ethnicity, and smoking-specific hazard ratios and corresponding 95% confidence intervals for the stratum-specific association between LEA and all-cause mortality are shown in Table 3. The risk of mortality associated with LEA stratified by age group was significant for every age group. The increased risk of mortality associated with LEA was significant in men who had a HR of 1.96 (95% CI 1.25–3.07) but not significant in women (HR 1.05 (95% CI 0.50–2.22)). The risk of mortality associated with LEA was highest in the Hispanic ethnic group, HR 5.17 (95% CI 1.48–18.01), followed by the NonHispanic White group, HR 2.18 (95% CI 1.37–3.47). The race-specific HRs for the NonHispanic Black and Other groups were not significantly elevated. The increased risk of mortality associated with LEA appeared to be driven by the non-smoking sub-population (HR 2.27, 95% CI 1.52–3.39) compared to some or every day smokers (HR 1.92, 95% CI 0.72–5.16). Since we only inquired about smoking in the past year, it is possible that participants with ulcers or LEA were former smokers.
Table 3.
Adjusted Cox Proportional Hazards Models predicting all-cause mortality stratified by age, sex, race/ethnicity, and smoking.
| Lower extremity amputation | |
|---|---|
| Age | |
| <45 | 16.55 (1.45–188.86) |
| 45–64 | 1.84 (1.02–3.34) |
| ≥ 65 | 1.80 (1.09–2.97) |
| Sex | |
| Male | 1.96 (1.25–3.07) |
| Female | 1.05 (0.50–2.22) |
| Race/ethnicity | |
| Hispanic | 5.17 (1.48–18.01) |
| Black | 1.22 (0.51–2.93) |
| Other | 0.55 (0.06–5.09) |
| White | 2.18 (1.37–3.47) |
| Smoking (in past year) | |
| Not at all | 2.27 (1.52–3.39) |
| Some or everyday | 1.92 (0.72–5.16) |
Adjusted for: age, sex, race/ethnicity, income, diabetes treatment, HbA1c, BMI, LDL cholesterol, smoking, and history of congestive heart failure, myocardial infarction, diabetic nephropathy, and peripheral vascular disease.. Note: the model stratified by age is not adjusted for age, the model stratified by sex is not adjusted for sex, etc.
In sensitivity analyses (data not shown), there were 108 people with any LEA with or without CN or DFUs. Of the 1956 people who died, 72 (4%) had LEA and of the 5036 people who remained alive after 10 years, 36 (1%) had LEA (p<0.0001). The 5- and 10-year mortality rates for people with LEA were 39% and 67%, respectively. For people without LEA, 5- and 10-year mortality rates were 15% and 27%, respectively. Figure 1 presents the unadjusted survival curve for any versus no LEA over 10 years of followup. The association between any LEA and mortality remained statistically significant in fully-adjusted models with a HR of 1.67 (95% CI 1.19–2.35), and the stratum-specific trends were the same as those noted above.
Figure 1.
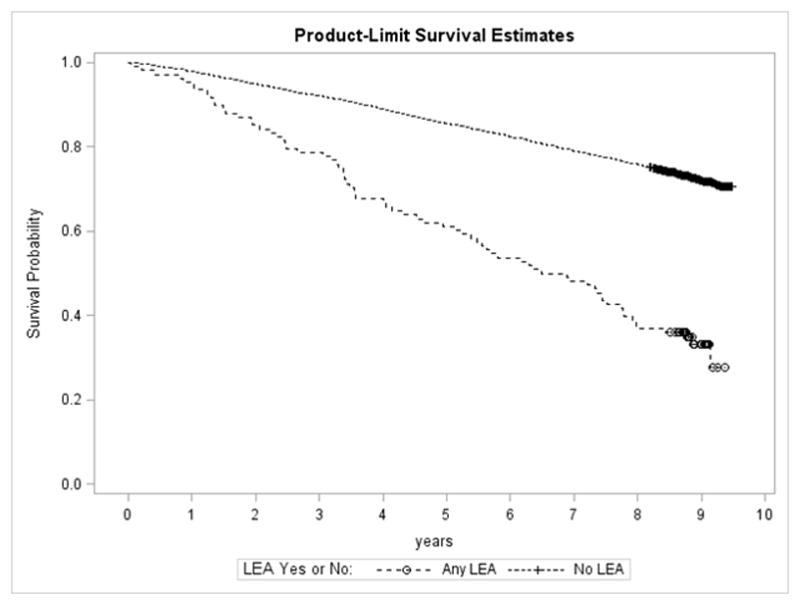
Unadjusted survival curve for TRIAD participants with no lower extremity amputation, versus any lower extremity amputation over 10 years.
The numbers of minor (toe or transmetatarsal) and major (below or above the knee) LEAs were equal (N=54 in each category). In multivariate models, minor LEAs were not a significant predictor of mortality (HR 1.48, 95% CI 0.92–2.40) but major LEAs were (HR 1.89, 95% CI 1.18–3.01). Figure 2 presents the unadjusted survival curves for patients undergoing minor and major LEAs versus no LEA over the 10 year followup period. It is evident from Figure 2 that at 5 years there is not much difference between survival for people who had a minor LEA versus no LEA. However, for those who survived past 5 years this difference was greater. Survival at 10 years for people who had a minor LEA was similar to the survival for people who had a major LEA.
Figure 2.

Unadjusted survival curve for TRIAD participants with no lower extremity amputation, minor lower extremity amputation only, and major lower extremity amputation over 10 years.
Discussion
CN, DFU, and LEA were all associated with increased all-cause mortality in unadjusted analyses. We were not surprised by these findings as foot complications are associated with higher levels of pro-inflammatory cytokines, which are associated with mortality. A meta-analysis has recently described increased mortality associated with chronic elevations of C reactive protein (19). CN, DFU, diabetes-related foot infections, and osteomyelitis preceding LEA have all been described as chronic inflammatory states. Foot complications are frequently treated with prosthetic devices that increase the energy costs of walking and could precipitate cardiovascular events in patients with multiple comorbid conditions (20).
For these same reasons, we were surprised that all foot complications were not independently associated with mortality. Although CN and DFU frequently precede LEA, we did not find an independent effect of either of these foot complications on mortality. LEA was the only foot complication that predicted mortality independent of age, sex, race/ethnicity, income, BMI, diabetes treatment, HbA1c, LDL cholesterol, smoking, history of diabetic nephropathy, myocardial infarction, congestive heart failure, and peripheral vascular disease. This may reflect the very high perioperative mortality rate associated with LEA. The 30-day mortality after major amputation has been reported to be as high as 16% in patients on dialysis (21). Our study confirms that diabetes-related LEAs are associated with high 5 and 10-year mortality rates (5, 22–24). The unadjusted 5-year mortality rate for those with LEA was 39% and the 10-year mortality rate was 67%. This is higher than the 5-year and 10-year mortality rates for those with breast cancer (10% and 17% respectively) and is comparable to the 36% 5-year mortality rate, and higher than the 42% 10-year mortality rate for those with colorectal cancer (25–26).
Historically, mortality rates after LEA have been reported to be very high. In a study by Whitehouse et al., 64% mortality was observed at 5 years for patients who underwent below the knee amputation between 1956 and 1965 (27). In our study, 5-year mortality was 39%, similar to the 5 year mortality rate for people 40 to 64 years of age with type 2 diabetes after amputation and lower than the mortality rate for those 65–84 years of age (~70%) in the Swedish National Diabetes Registry (28).
Another concerning finding was the five-fold increased hazard for mortality associated with LEA in patients of Hispanic ethnicity. As we demonstrated in our prior work, racial differences in the odds of having an amputation were attenuated in the TRIAD population (17). However, this new finding indicates that there may still be an increased risk of mortality associated with LEA in Hispanics. Our finding underscores the potential importance of early access to care and risk factor interventions in reducing amputation risk. Once an amputation has occurred, access to care and treatment appear to be ineffective in preventing death.
This study has some limitations. We used data from people enrolled in managed care plans; our results may not be generalizable to those outside of managed care, or even those in managed care plans with different levels of access to care or quality of care. Identification of foot conditions relied on data recorded for administrative purposes. These data may not accurately represent a patient’s clinical status. However, previous studies have demonstrated that CN identified by ICD-9 codes can be confirmed by medical records 92% of the time. ICD-9 codes have also been shown to have 93% sensitivity and 91% specificity in identifying DFU (29–30). Administrative data do not allow for identification of the foot affected so we do not know if the conditions were unilateral or bilateral. We did not observe an association between LEA and mortality in those reporting smoking in the past year. However, due to survey measurement, the dichotomization of smoking may have resulted in misclassification and biased the results of our analysis. Lastly, while we had 6,692 patients in our sample, there were only 55 with Charcot feet which limited the power for multivariate analyses. It is important to keep in mind, however, that Charcot foot is a relatively rare complication of diabetes with an estimated prevalence of 0.1% to 0.9%, so our prevalence of 1% was actually quite high (31–32).
Early detection of feet at risk and appropriate management are the most important factors in preventing diabetes-related foot complications. In our study of managed care patients with access to high-quality health care, we found that LEA remained a robust independent predictor of mortality and that the 5 and 10-year mortality rates were high. While our previous study noted an attenuation of the racial/ethnic differences in the prevalence of foot complications reported in the literature (12), we now observed some differences in the association between LEA and mortality by sex and racial/ethnic group with men and Hispanics having the highest risk. This suggests that although early treatment and preventive care maybe critical for the prevention of foot complications in people with diabetes, LEA reflects suboptimal long-term treatment and remains a robust risk factor for mortality.
Novelty.
In a managed care population with access to high quality medical care, lower extremity amputation (LEA) was a robust independent predictor of all-cause mortality.
In this population with good access to high-quality care, the effect of LEA on mortality differed by sex and race/ethnicity.
Acknowledgments
Funding: This study was jointly funded by Program Announcement 04005 from the Centers for Disease Control and Prevention (Division of Diabetes Translation) and the National Institute of Diabetes and Digestive and Kidney Diseases. Additional support was provided by the National Institute of Diabetes and Digestive and Kidney Diseases through the Michigan Diabetes Research Center (Grant Number P30DK020572) and the Michigan Center for Diabetes Translational Research (Grant Number P30DK092926).
Significant contributions to this study were made by members of the TRIAD study group. The authors acknowledge the participation of their health plan partners, and the technical assistance of Ed Tierney, Centers for Disease Control and Prevention.
Footnotes
Conflicts of Interest: No potential conflicts of interest relevant to this article were reported. The findings and conclusions in this report are those of the author(s) and do not necessarily represent the views of the funding agency(s).
References
- 1.Boyko EJ, Ahroni JH, Stensel V, et al. A prospective study of risk factors for diabetic foot ulcer. The Seattle Diabetic Foot Study. Diabetes Care. 1999;22(7):1036–42. doi: 10.2337/diacare.22.7.1036. [DOI] [PubMed] [Google Scholar]
- 2.Boulton AJ, Vileikyte L, Ragnarson-Tennvall, et al. The global burden of diabetic foot disease. Lancet. 2005;366:1719–1724. doi: 10.1016/S0140-6736(05)67698-2. [DOI] [PubMed] [Google Scholar]
- 3.Sohn MW, Lee TA, Stuck RM, et al. Mortality risk of Charcot arthropathy compared with that of diabetic foot ulcer and diabetes alone. Diabetes Care. 2009;32(5):816–821. doi: 10.2337/dc08-1695. [DOI] [PMC free article] [PubMed] [Google Scholar]
- 4.Apelqvist JJ, Larsson J. Agardh CDLong-term prognosis for diabetic patients with foot ulcers. J Intern Med. 1993;233(6):485–491. doi: 10.1111/j.1365-2796.1993.tb01003.x. [DOI] [PubMed] [Google Scholar]
- 5.Moulik PK, Mtonga R, Gill GV. Amputation and mortality in new-onset diabetic foot ulcers stratified by etiology. Diabetes Care. 2003;26(2):491–494. doi: 10.2337/diacare.26.2.491. [DOI] [PubMed] [Google Scholar]
- 6.Faglia EF, Favales F, Morabito A. New ulceration, new major amputation, and survival rates in diabetic subjects hospitalized for foot ulceration from 1990 to 1993: a 6.5-year follow-up. Diabetes Care. 2001;24(1):78–83. doi: 10.2337/diacare.24.1.78. [DOI] [PubMed] [Google Scholar]
- 7.Kumar S, Fernando DJS, Veves A, et al. Semmes-Weinstein monofilaments: a simple, effective and inexpensive screening device for identifying diabetic patients at risk of foot ulceration. Diabetes Research and Clinical Practice. 1991;31:63–68. doi: 10.1016/0168-8227(91)90034-b. [DOI] [PubMed] [Google Scholar]
- 8.Young MJ, McCardle JE, Randall LE, et al. Improved survival of diabetic foot ulcer patients 1995–2008: possible impact of aggressive cardiovascular risk management. Diabetes Care. 2008;31(11):2143–2147. doi: 10.2337/dc08-1242. [DOI] [PMC free article] [PubMed] [Google Scholar]
- 9.Gaede P, Vedel P, Larsen N, et al. Multifactorial intervention and cardiovascular disease in patients with type 2 diabetes. N Engl J Med. 2003;348(5):383–93. doi: 10.1056/NEJMoa021778. [DOI] [PubMed] [Google Scholar]
- 10.McEwen LN, Hsiao VC, Nota-Kirby EM, et al. Effect of a managed care disease management program on diabetes care. Am J Manag Care. 2009;15(9):575–580. [PMC free article] [PubMed] [Google Scholar]
- 11.Karter AJ, Ferrara A, Liu JY, et al. Ethnic disparities in diabetic complications in an insured population. JAMA. 2002;287(19):2519–2527. doi: 10.1001/jama.287.19.2519. [DOI] [PubMed] [Google Scholar]
- 12.McEwen LN, Ylitalo KR, Herman WH, et al. Prevalence and risk factors for diabetes-related foot complications in Translating Research Into Action for Diabetes (TRIAD) J Diabetes Complications. 2013;27(6):588–592. doi: 10.1016/j.jdiacomp.2013.08.003. [DOI] [PMC free article] [PubMed] [Google Scholar]
- 13.Lavery LA, van Houtum WH, Ashry HR, et al. Diabetes-related lower-extremity amputations disproportionately affect Blacks and Mexican Americans. South Med J. 1999;92(6):593–599. doi: 10.1097/00007611-199906000-00008. [DOI] [PubMed] [Google Scholar]
- 14.TRIAD Study Group. The Translating Research Into Action for Diabetes (TRIAD) study: a multicenter study of diabetes in managed care. Diabetes Care. 2002;25:386–389. doi: 10.2337/diacare.25.2.386. [DOI] [PubMed] [Google Scholar]
- 15.Centers for Disease Control and Prevention. [Accessed 2 September 2010];National Center for Health Statistics: National Death Index (NDI), NDI Plus Searches. [Internet]. Available from http://www.cdc.gov/nchs/ndi.htm.
- 16.Cowper DC, Kubal JD, Maynard C, et al. A primer and comparative review of major US mortality databases. Ann Epidemiol. 2002;12:462–468. doi: 10.1016/s1047-2797(01)00285-x. [DOI] [PubMed] [Google Scholar]
- 17.Williams BC, Demitrack LB, Fries BE. The accuracy of the National Death Index when personal identifiers other than Social Security number are used. Am J Public Health. 1992;82:1145–1147. doi: 10.2105/ajph.82.8.1145. [DOI] [PMC free article] [PubMed] [Google Scholar]
- 18.Charlson ME, Pompei P, Ales KL, et al. A new method for classifying prognostic comorbidity in longitudinal studies: development and validation. J Chronic Dis. 1987;40:373–383. doi: 10.1016/0021-9681(87)90171-8. [DOI] [PubMed] [Google Scholar]
- 19.Kaptoge S, Di Angelantonio E, Lowe G, et al. C-reactive protein concentration and risk of coronary heart disease, stroke, and mortality: an individual participant meta-analysis. Lancet. 2010;375(9709):132–140. doi: 10.1016/S0140-6736(09)61717-7. [DOI] [PMC free article] [PubMed] [Google Scholar]
- 20.Waters RL, Perry J, Antonelli D, et al. Energy cost of walking of amputees: the influence of level of amputation. J Bone Joint Surg. 1976;58A:42–46. [PubMed] [Google Scholar]
- 21.Logar CM, Pappas LM, Ramkumar N, et al. Surgical revascularization versus amputation for peripheral vascular disease in dialysis patients: a cohort study. BMC Nephrol. 2005;6(1):3. doi: 10.1186/1471-2369-6-3. [DOI] [PMC free article] [PubMed] [Google Scholar]
- 22.Armstrong DG, Wrobel J. Guest Editorial: are diabetes-related wounds and amputations worse than cancer? Int Wound J. 2007;4(4):286–7. doi: 10.1111/j.1742-481X.2007.00392.x. [DOI] [PubMed] [Google Scholar]
- 23.Izumi Y, Satterfield, Lee S, et al. Mortality of first-time amputees in diabetics: a 10 year observation. Diabetes Res Clin Pract. 2009;83:126–131. doi: 10.1016/j.diabres.2008.09.005. [DOI] [PubMed] [Google Scholar]
- 24.Morbach S, Furchert H, Groblijnghoff U, et al. Long-term prognosis of diabetic foot patients and their limbs. Diabetes Care. 2012;35:2021–2027. doi: 10.2337/dc12-0200. [DOI] [PMC free article] [PubMed] [Google Scholar]
- 25.American Cancer Society. Cancer Facts & Figures 2013. Atlanta: American Cancer Society; 2013. [Google Scholar]
- 26.American Cancer Socitey. Colorectal Cancer Facts & Figures 2014–2016. Atlanta: American Cancer Society; 2014. [Google Scholar]
- 27.Whitehouse FW, Jurgensen C, Block MA. The later life of the diabetic amputee. Diabetes. 1968;17:520–21. doi: 10.2337/diab.17.8.520. [DOI] [PubMed] [Google Scholar]
- 28.Kelly PJ, Clarke PM, Hayes AJ, et al. Predicting mortality in people with type 2 diabetes mellitus after major complications: a study using Swedish National Diabetes Register data. Diabetic Med. 2014;31(8):954–62. doi: 10.1111/dme.12468. [DOI] [PubMed] [Google Scholar]
- 29.Sohn MW, Budiman-Mak E, Stuck RM, et al. Diagnostic accuracy of existing methods for identifying diabetic foot ulcers from inpatient and outpatient datasets. J Foot Ankle Res. 2010;3:27–32. doi: 10.1186/1757-1146-3-27. [DOI] [PMC free article] [PubMed] [Google Scholar]
- 30.Sohn MW, Stuck RM, Pinzur M, et al. Lower-extremity amputation risk after charcot arthropathy and foot ulcer. Diabetes Care. 2010;33(1):98–100. doi: 10.2337/dc09-1497. [DOI] [PMC free article] [PubMed] [Google Scholar]
- 31.Lavery LA, Armstrong DG, Wunderlich RP, et al. Diabetic foot syndrome: Evaluating the prevalence and incidence of foot pathology in Mexican Americans and non-Hispanic whites from a diabetes disease management cohort. Diabetes Care. 2003;26(5):1435–1438. doi: 10.2337/diacare.26.5.1435. [DOI] [PubMed] [Google Scholar]
- 32.Sinha S, Munichoodappa CS, Kozak GP. Neuro-arthropathy (Charcot joints) in diabetes mellitus (clinical study of 101 cases) Medicine (Baltimore) 1972;51(3):191–210. doi: 10.1097/00005792-197205000-00006. [DOI] [PubMed] [Google Scholar]