Abstract
We report on the operation and performance tests of a preclinical head scanner developed for proton computed tomography (pCT). After extensive preclinical testing, pCT is intended to be employed in support of proton therapy treatment planning and pre-treatment verification in patients undergoing particle-beam therapy. In order to assess the performance of the scanner, we have performed CT scans with 200 MeV protons from both the synchrotron of the Loma Linda University Medical Center (LLUMC) and the cyclotron of the Northwestern Medicine Chicago Proton Center (NMCPC). The very high sustained rate of data acquisition, exceeding one million protons per second, allowed a full 360° scan to be completed in less than 7 minutes. The reconstruction of various phantoms verified accurate reconstruction of the proton relative stopping power (RSP) and the spatial resolution in a variety of materials. The dose for an image with better than 1% uncertainty in the RSP is found to be close to 1 mGy.
I. Introduction
Low-dose proton radiograph and proton CT (pCT) [1] is an evolving technology that promises to improve proton therapy planning by addressing the range uncertainty problem as well as by providing artifact-free images for verification and adaptive therapy at the time of treatment. Proton CT will generate a set of integrated relative stopping power (RSP) measurements that are used to reconstruct a 3-D map of RSP values to be input into a treatment planning system.
Our pCT Collaboration has built and successfully operated a Phase-II head scanner [1] that measures individually more than a million protons per second, a hundred times faster than our previous Phase-I device [3]. This is the first proton-CT system capable of completing a full scan in less than 10 minutes, a performance level that will allow us to complete a full preclinical performance evaluation of this new modality. After briefly reviewing the hardware implementation and initial testing of the scanner, we will report on its operations at two proton cancer treatment centers and the results from image reconstructions of a variety of phantoms: assembly of a large image from two scans translated relative to each other, the line-pair resolution, artifacts due to non-optimized calibrations, as well as the accuracy of the RSP measurement and the dose required for a full pCT scan.
II. Hardware Implementations
The details of the pCT head scanner hardware are described in several publications [2]–[7], so only a brief overview is given in the following. See Figure 1 for a conceptual depiction of the scanner. An initial tracking detector measures the incoming position and direction of every proton, while a second identical tracking detector measures the proton as it exits the phantom being imaged. From the tracking measurements the most-likely-path (MLP) [8], [9], [10] of the proton through the phantom is estimated. Following the second tracking detector is a final detector in which the proton stops and that measures the proton residual range.
Figure 1.
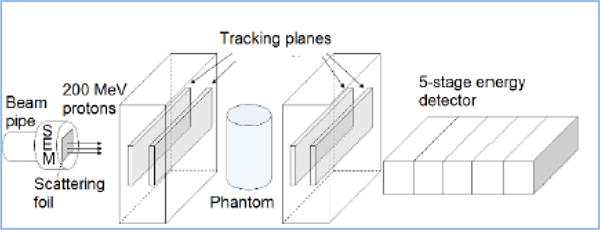
A schematic rendering of the Phase-II head scanner, including the lead foil (used to scatter the proton beam across the system aperture in the LLUMC tests.
Our implementation of the Phase-II scanner (Figure 2) is based on two silicon-strip tracking-detector modules, an energy/range detector composed of five scintillator stages, a rotating stage for the phantom, and a custom high-speed data acquisition system. The active aperture is about 88 mm by 350 mm. The tracking system and the 5-stage detector measure respectively the MLP and the corresponding water-equivalent path length (WEPL). The stage rotates the phantom during a scan.
Figure 2.
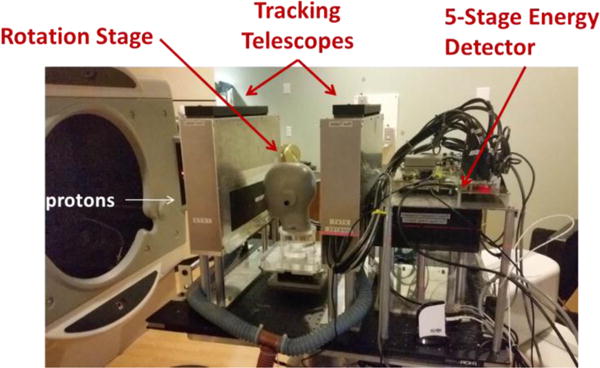
Photograph of the Phase-II pCT scanner in a proton beam line at the Northwestern Medicine Chicago Proton Center. The beam enters from the left.
Since the 5-stage detector has no lateral segmentation, it can effectively analyze only a single proton per accelerator RF period, which limits the practical event rate to not much more than one MHz. The tracking detectors, however, are finely segmented and can separately measure multiple simultaneous protons. Therefore, RF periods in which two or more protons arrive are readily detected by the multiple tracks as well as by unusually large signals in the 5-stage detector.
II.a Tracking Detector
The precision of the image reconstruction imposes the following requirement on the design of the tracking detector: determine with maximum efficiency the location of the MLP of a proton of typical 200 MeV energy within a 1 mm voxel in the phantom. In addition, events with multiple protons need to be recognized. Since the MLP algorithm uses both input and output vectors of the single proton, the large size of the proton beam requires at least two x–y measurements both before and after the phantom. Fewer layers would require additional information like a point-like beam spot which could eliminate one x–y layer in front of the phantom. More layers would increase the robustness of the MLP, but have not been needed in our experience due to the performance of the silicon detectors. For a system with a finely segmented WEPL detector where one could detect multi-proton events, additional planes rotated wrt the x–y planes would allow resolving the ambiguity in associating the proper x–y hits and eliminate “ghosts”.
The tracking detector is based upon well-established silicon-strip detector (SSD) technology, in our case the detectors used were part of the 11,700 SSD produced for the Fermi mission [11]. SSDs are nearly ideal candidates for the tracking portion of a pCT system, since they have efficiency in excess of 99% for charged particle detection with practically zero noise occupancy, inherently fine spatial resolution (about 70 μm RMS in this case), simple calibration that is stable over time periods of many years, and compact and easy assembly using standard mechanized industrial processes, with excellent mechanical stability. Simulation showed that due to the large multiple scattering of the low-energy protons in the phantom, a pitch in the SSD smaller than the 228 μm used in our system would not improve the MLP resolution.
An important parameter is the size of the gap between individual sensors making up a single layer. We minimized that by re-sawing the SSD edges very close to the guard ring, such that the distance between active regions of adjacent sensors is only about 0.6 mm [2]. Much of the small inefficiency is caused by the known gaps between sensors, and most of the missing hits can be recovered if an overall fit of a track to the existing hits points close to the gaps [5].
The front-end of the data acquisition for the tracking detector is based on a custom integrated circuit (ASIC) that is described elsewhere [7]. Field Programmable Gate Arrays (FPGAs) on each detector board combine and format the data from groups of 12 ASICs and then send the data over dual-link DVI-D cables to the event builder, which is implemented in a Xilinx Virtex-6 FPGA.
II.b Five-Stage Energy/Range Detector
The 5-stage detector consists of five consecutive 5.1 cm thick fast plastic scintillator stages read out by photomultiplier tubes (PMTs). The PMT signals are digitized at 65 MHz, and the digitizations are summed in FPGAs before being sent to the data-acquisition event builder.
By dividing the energy detector into five stages we greatly reduced the requirement on energy resolution. Stages that a proton passes all the way through contribute directly to total range, so the stage in which the proton stops needs to measure only a small residual range, with only a relaxed precision requirement, which we estimate at 1%. The design, fabrication, and calibration of the 5-stage detector are presented in more depth in Ref. [6]
The principal trigger for the scanner is derived from the 5-stage detector: we normally use only the signal from the first layer, since it is the only layer hit by every proton of interest.
The calibration of the WEPL detector is done by taking and analyzing proton data with a polystyrene stair phantom placed at the location of the rotating phantom stage between the two tracking detectors [6], [12]. Systematic WEPL errors have been minimized with support from Monte Carlo simulations. We have verified that this procedure yields a WEPL resolution that is approximately 3 mm for all values of WEPL.
II.c Data Acquisition
The data acquisition system was designed to move the raw data from at least a million events to the computer per second. It uses a 4-event deep buffer in the front-end ASICs and additional buffers in FPGAs to smooth out random fluctuations in the proton arrival times. The data integrity is monitored via parity bits in the ASIC-to-FPGA transmission and an 11-bit cyclic redundancy check (CRC) in the transmissions between FPGAs. In a typical beam test, for example, 2.5 billion events with a total of 1.8×1011 bytes were acquired with zero errors of any kind detected. The computer has enough memory to hold an entire typical scan (~20 GBytes), but in practice the disk writing is able to approximately keep up with the data flow.
III. Beam Operations
In rotational scans over 360°, the head scanner tracks individual protons before and after the phantom or patient, and measures a combination of the residual energy and range of the proton, from which the water equivalent path length (WEPL) of the protons in the scanned object is derived.
III.a LLUMC Synchrotron
In our tests carried out at the LLUMC synchrotron we spread the beam across the aperture of the device by scattering the protons in a 2 mm thick lead foil immediately upon their exit from the beam pipe, typically about 3 m upstream from the scanner (see Fig. 1). During a scan it typically makes ninety 4° steps of the rotation stage, writing out a separate data file at each step. To minimize wasted time it synchronizes the start of the rotation and pause in data acquisition to match the beginning of the ~2 second time interval between two synchrotron spills. Figure 3 shows the data acquisition rate performance during a single short run, with nearly 100% of the triggers being accepted up to about a 1 MHz trigger rate.
Figure 3.
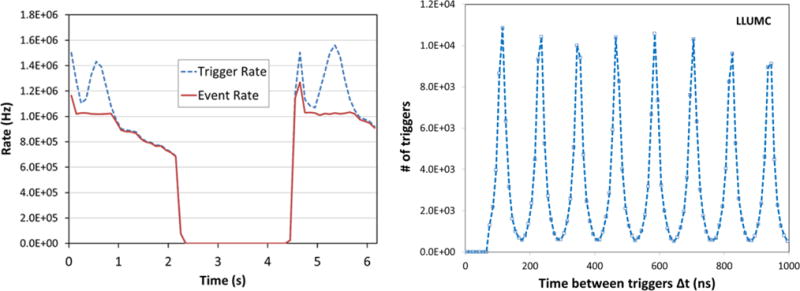
Example run with 200 MeV protons, showing left: two spills from the LLUMC synchrotron; right: the micro-spill structure of about 120ns period.
The proton rate from the synchrotron was non-uniform during each spill, but the system gracefully inhibited the trigger when all buffers were full and kept data flowing at the maximum allowed rate. As planned, the data acquisition system can sustain indefinitely a rate of over one million events per second with no data errors and no partial events.
III.b NMCPC Cyclotron
When operating at the isochronous cyclotron of the Northwestern Medicine Chicago Proton Center in Warrenville, Illinois where the beam is continuous, the stepped operating method is inefficient. Therefore, an alternative mode was implemented in which the stage rotates slowly and continuously with 1 revolution/min during a single long data acquisition run (Fig. 4). Nearly 75% of the triggers are accepted at about a 1.6 MHz trigger and 1.2 MHz data rate. In that case the stage angle for each event is calculated from the event time stamp together with the stage angular speed, starting time, and starting position. The cyclotron beam has a decided advantage in avoiding the time wasted between synchrotron spills as well as ability to deliver a constant proton rate, something we have not achieved at the LLUMC synchrotron.
Figure 4.
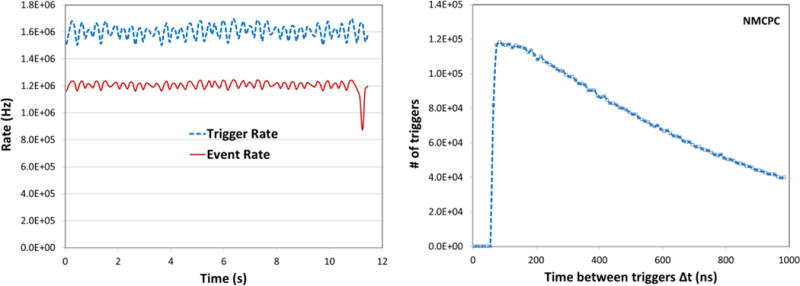
Example run with 200 MeV protons at the NMCPC cyclotron, showing left: the continuous spill rates for the beginning of one run, in which the phantom completed 7 revolutions in 7 minutes; right: the continuous spill time structure.
A further major advantage of the NMCPC facility is its capability to magnetically scan (“wobble”) a broad beam (~4 cm FWHM) horizontally and vertically across the phantom, making the lead scattering foil shown in Figure 1 unnecessary. This allows us to expose uniformly and predictably the part of the phantom covered by the scanner acceptance with relatively few protons emitted outside of the imaging region.
An issue with running pCT at the synchrotron has been that the required intensity is so low that the accelerator operators cannot monitor the beam. However, we found at the cyclotron facility that we were able to monitor quickly both the beam intensity and profile using our pCT system, thus giving rapid feedback to the operator, who quickly found accelerator settings that delivered the desired beam profile with a MHz proton rate.
IV. Image Reconstruction
The overall data flow following the scans proceeds from data pre-processing to calibration to image reconstruction. The reconstruction employed a filtered back-projection (FBP) followed by an iterated algebraic reconstruction (Total variation superiorization TVS with diagonally relaxed orthogonal projections DROP [13]) that makes use of the tracking information of individual protons to define a most-likely-path (MLP) through the phantom for each proton [8]. The images are 3D voxel image (stack of slices) with isotropic voxel size (1 × 1 × 1 mm3).
In parallel to the data reconstruction is the development of a simulation platform using the Geant4 package [14] essential for guidance in instrument and code development and code verification. All data scans are routinely simulated.
The relative stopping power (RSP) of a variety of materials is accurately measured, as demonstrated in Ref [4] in the case of the Catphan 404 phantom, the sensitometry module of the Catphan® 600 series [15] (see Fig. 8.b). In that cylinder of plastic with several cylindrical inserts of differing known densities, the RSP of the inserts has been reconstructed to better than 1%. Parallelized reconstruction algorithms that run on an array of GPUs have been implemented, which also reconstruct RSP to better than 1%, and add robustness to data variations due to spill structure. Full image reconstructions have been completed in less than eight minutes, similar to the beam time required to acquire the data.
Figure 8.
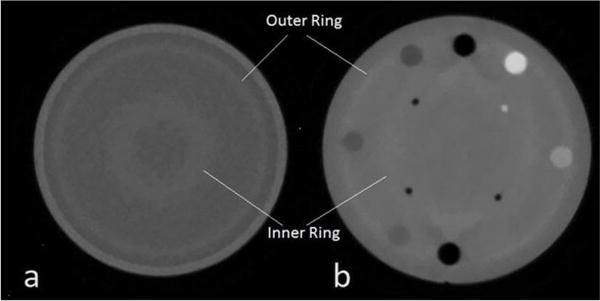
Reconstructed slice through two phantoms: a) a 15 cm diameter water phantom and b) the Catphan 404 phantom, both showing distinct artifacts.
1V.a Anthropomorphic Head Phantom: Combining of Scans
The head scanner has an acceptance in the vertical direction that is limited to about 9 cm. This is sufficient for most applications, but in the case where an image of the entire head is required, e.g. for in-situ alignment, the phantom needs to be scanned twice, with the head displaced in the vertical direction. Figure 5 shows the nearly seamless reconstructed image of a realistic anthropomorphic pediatric head phantom (model HN715, CIRS [16]) assembled from two scans with a vertical relative displacement.
Figure 5.
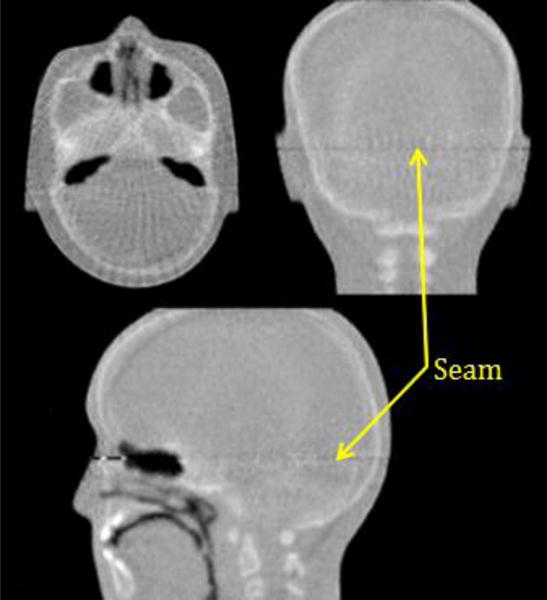
Three cardinal planes of 3D RSP images obtained with Phase II scans of the anthropomorphic head phantom. Note that these images were taken in two separate scans displaced relative to each other in the vertical direction, leaving an almost invisible seam as indicated.
IV.b Edge Phantom: Spatial Resolution
An “edge phantom” was designed and fabricated for the purpose of measuring a modulation transfer function (MTF). The MTF is a function of relative modulation with respect to spatial frequency (lp/cm) that characterizes the resolution and performance of an imaging system [17]. The cylindrical phantom is 6 cm high with a diameter of 20 cm composed of water-equivalent polymer. It contains inserts with square (15 mm × 15 mm) cross-sections composed of one of four body-equivalent polymers that imitate air, lung, cortical bone and tooth enamel (Fig. 6). The RSP of these inserts and their densities are listed in Fig. 6. For each polymer, there is an insert at radius 25, 55, and 80 cm.
Figure 6.
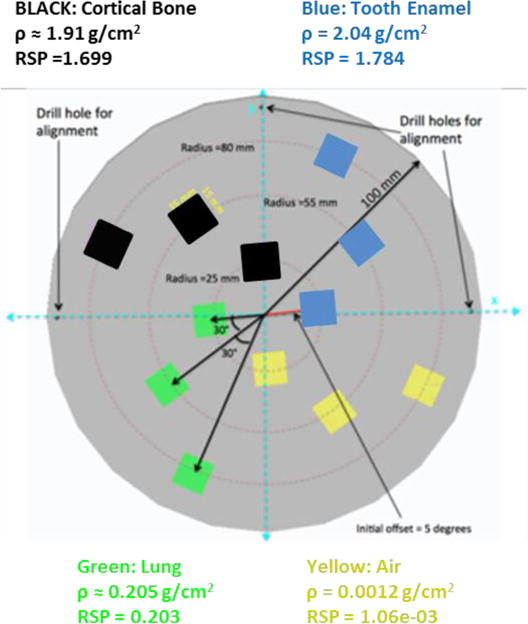
Top view of the “edge” phantom used to evaluate the MTF. There are three inserts located at 25, 55, 80 cm radius, respectively, for each of the four materials indicated.
The phantom was scanned at the NMCPC beam line continuously for 7 minutes, rotating at a rate of 1 revolution per minute (2π rad/min). The data were binned during preprocessing into 1 degree bins and then reconstructed. The reconstructed image is given in Fig. 7 (left). This image is composed of 1 mm × 1mm pixels, and was reconstructed from a total of 93 million protons which passed all of the data reductions implemented in preprocessing and reconstruction.
Figure 7.
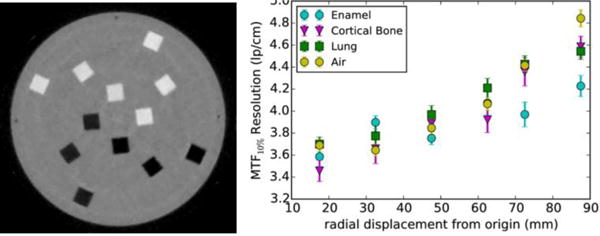
Reconstructed “edge” phantom (left) and the MTF resolution for the four different insert materials as a function of the radial location (right).
The MTFs were obtained using a modified “oversampling” method for all edges orthogonal to the radial direction. A plot of the MTF_10% for the different materials as a function of radial displacement is shown in Fig. 7 (right). The MTF_10% is generally taken to represent the maximum useful resolution of the system, and indicates where the relative modulation is 10% of its maximum. The Nyquist frequency (maximum possible resolution) for 1 mm pixels is 5 lp/cm. For high RSP inserts, the observed spatial resolution is 60–75% of the Nyquist frequency, depending on radial displacement from the phantom’s rotational axis, while for low RSP inserts, the spatial resolution is 60–80% of the Nyquist frequency.
IV.c Image Artifacts
Reconstructed scans from uniform as well as patterned phantoms exhibit artifacts that indicate some further improvements needed in the data calibration and reconstruction. As an example, Fig. 8 shows ring artifacts in both a) a 15 cm diameter water phantom and b) the Catphan 404 phantom (a cylinder of plastic with several cylindrical inserts of differing known densities). Although of relatively small RSP value, these artifacts are clearly visible. They are currently being addressed in the reconstruction algorithm and in the WEPL calibration.
V. Evaluation of Dose
A critical parameter for proton CT is the dose being delivered during a full scan that results in an image of desired RSP resolution and noise. For useful application, the RSP resolution should be better than 1%. The method we used was to find the proton fluence which gives better than 1% RSP resolution with a water phantom, and then determine the dose for this fluence in the center of a phantom. This was done by measuring it directly in a dose phantom with using a Farmer ionization chamber, and also by calculating it from the fluence and the stopping power for water.
We scanned a water phantom of 15 cm diameter to assess the error in reconstructed RSP with a fixed 200 MeV proton fluence. Figure 9 shows the reconstructed WEPL distribution and the difference between the reconstructed and the actual WEPL, exhibiting statistical differences much below the 1 mm level, i.e. less than 1%. This is consistent with the measured WEPL resolution: as mentioned in Section II.b, the WEPL error for a single proton is approximately ± 3 mm, and since we require a fluence of 100 protons/mm2 to reliably determine the WEPL in one view of a voxel, the uncertainty of the WEPL of a 1 mm2 image voxel is then reduced to 3 mm/√100 = 0.3 mm. In a stepped scan with typically 90 views, the total fluence inside a voxel is 9*105 protons/cm2, and for this fluence we find a CT noise < 1%. We expect that in the future a refined analysis will reduce the required fluence further.
Figure 9.
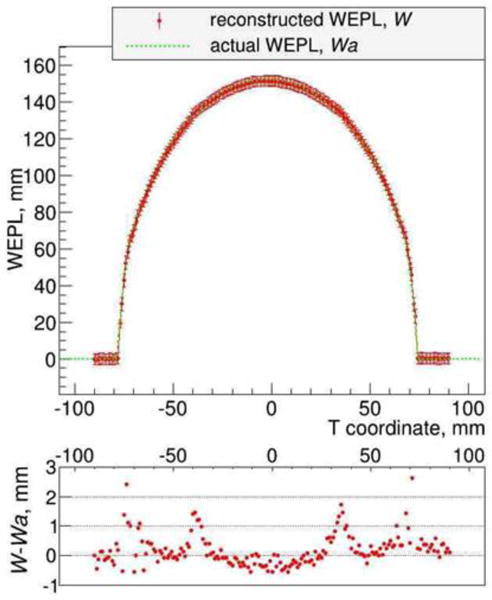
Reconstructed and actual WEPL projection of the water phantom, and the difference between reconstructed and actual WEPL.
We measured the dose during a full CT scan using the acrylic CTP554 dose phantom with a Farmer ionization chamber [18] inserted on the central rotating stage (Fig. 10). The background-corrected charge for the central location of the chamber accumulated during a 6 minute scan was 26.7 pC, which converts to a delivered dose of 1.4 mGy. For this scan a fluence of 1.3*106 protons/cm2 was determined for the center of the dose phantom. Using the stopping power data from the NIST P-Star website [19], we estimate a dose of 1.1 mGy for this fluence, somewhat lower than the measured value. The difference might be attributable to particles not tracked in the tracker or not triggered in the WEPL detector. Scaling the measured dose with the observed proton fluences in the dose phantom and water phantom, respectively, we find that a proton CT scan with RSP uncertainty <1% can be achieved with a fluence of 106 proton/cm2 corresponding to an approximate dose of 1.1 mGy. Such a scan takes at the moment 6 min.
Figure 10.
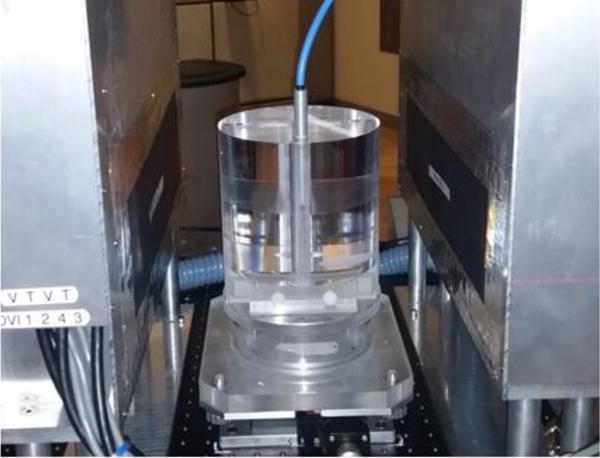
Catphan CTP554 acrylic dose phantom (Ø = 16 cm) with the Farmer ionization chamber mounted on the proton CT imager.
VI. Conclusion and Further Work
The Phase-II head scanner hardware and data acquisition system have been completed and have operated reliably at the design data rate in both synchrotron and isochronous-cyclotron facilities.
We find that the dose required for a complete scan with better than 1% RSP accuracy is approximately 1.1 mGy.
Preliminary image results are encouraging. The system is now ready to support testing of reconstruction algorithms as well as a thorough evaluation of proton computed tomography in terms of image resolution, RSP measurement, and dose in a variety of phantoms, including comparisons with detailed Monte Carlo simulations.
Further hardware improvements will include 1) increasing the rate capability of the scanner through speeding up both the communication between FPGAs and the Ethernet connection between the event builder and computer; 2) minimizing the pile-up by shortening the pulses of the 5-stage detector. These incremental improvements should allow a complete full CT scans with low overall radiological dose in only two to three minutes, depending on the phantom size, a time span very well suited to clinical use.
Acknowledgments
This work was supported in part by the National Institute of Biomedical Imaging and Bioengineering (NIBIB) and the NSF, award Number R01EB013118. The content of this paper is solely the responsibility of the authors and does not necessarily represent the official views of NIBIB and NIH. We acknowledge crucial support from the technical staff at UCSC and LLU, and Robert Jones at Inland Technical Service. Special thanks to Mark Pankuch and his team at NMCPC for facilitating our data taking.
Footnotes
Publisher's Disclaimer: This is a PDF file of an unedited manuscript that has been accepted for publication. As a service to our customers we are providing this early version of the manuscript. The manuscript will undergo copyediting, typesetting, and review of the resulting proof before it is published in its final citable form. Please note that during the production process errors may be discovered which could affect the content, and all legal disclaimers that apply to the journal pertain.
Contributor Information
H. F.-W. Sadrozinski, SCIPP, U.C. Santa Cruz, Santa Cruz, CA 95064, USA
T. Geoghegan, SCIPP, U.C. Santa Cruz, Santa Cruz, CA 95064, USA
E. Harvey, SCIPP, U.C. Santa Cruz, Santa Cruz, CA 95064, USA
R. P. Johnson, SCIPP, U.C. Santa Cruz, Santa Cruz, CA 95064, USA
T. E. Plautz, SCIPP, U.C. Santa Cruz, Santa Cruz, CA 95064, USA
A. Zatserklyaniy, SCIPP, U.C. Santa Cruz, Santa Cruz, CA 95064, USA
V. Bashkirov, Division of Radiation Research, Loma Linda University, Loma Linda, CA 92354, USA
R. F. Hurley, Division of Radiation Research, Loma Linda University, Loma Linda, CA 92354, USA
P. Piersimoni, Division of Radiation Research, Loma Linda University, Loma Linda, CA 92354, USA
R.W. Schulte, Division of Radiation Research, Loma Linda University, Loma Linda, CA 92354, USA
P. Karbasi, School of Engineering and Computer Science, Baylor University, Waco, TX 76798, USA
K.E. Schubert, School of Engineering and Computer Science, Baylor University, Waco, TX 76798, USA
B. Schultze, School of Engineering and Computer Science, Baylor University, Waco, TX 76798, USA
V. Giacometti, Center for Medical Radiation Physics, University of Wollongong, NSW, Australia
References
- 1.Sadrozinski HF-W, et al. Toward Proton CT. IEEE Trans Nucl Science. 2004;51(1):3. [Google Scholar]
- 2.Sadrozinski HF-W, et al. Development of a Head Scanner for Proton CT. Nucl Instr Meth A. 2013;699:205–210. doi: 10.1016/j.nima.2012.04.029. [DOI] [PMC free article] [PubMed] [Google Scholar]
- 3.Schulte R, et al. Conceptual design of a proton computed tomography system for applications in proton radiation therapy. IEEE Trans Nucl Science. 2004;51(3):866. [Google Scholar]
- 4.Bashkirov VA, et al. Development of proton computed tomography detectors for applications in hadron therapy. Nucl Instr Meth A. 2016;809:120–129. doi: 10.1016/j.nima.2015.07.066. This publication has many references to the background of proton CT. [DOI] [PMC free article] [PubMed] [Google Scholar]
- 5.Johnson RP, et al. A Fast Preclinical Head Scanner for Proton CT. IEEE Trans Nucl Sci. doi: 10.1109/TNS.2015.2491918. [DOI] [Google Scholar]
- 6.Bashkirov VA, et al. Novel scintillation detector design and performance for proton radiography and computed tomography. Medical Physics. 2016;43:664. doi: 10.1118/1.4939255. [DOI] [PMC free article] [PubMed] [Google Scholar]
- 7.Johnson RP, et al. Tracker Readout ASIC for Proton Computed Tomography Data Acquisition. IEEE Trans Nucl Science. 2013;60:3262–3269. doi: 10.1109/TNS.2013.2274663. [DOI] [PMC free article] [PubMed] [Google Scholar]
- 8.Williams DC. The most likely path of an energetic charged particle through a uniform medium. Phys Med Biol. 2004;49:2899–2911. doi: 10.1088/0031-9155/49/13/010. [DOI] [PubMed] [Google Scholar]
- 9.Schulte R, et al. A Maximum Likelihood Proton Path Formalism for Application in Proton Computed Tomography. Medical Phys. 2008;35(11):4849–56. doi: 10.1118/1.2986139. [DOI] [PubMed] [Google Scholar]
- 10.Penfold SN, et al. A More Accurate Reconstruction System Matrix for Quantitative Proton Computed Tomography. Medical Phys. 2009;36(10):4511–18. doi: 10.1118/1.3218759. [DOI] [PubMed] [Google Scholar]
- 11.Ohsugi T, et al. Design and properties of the GLAST flight silicon micro-strip sensor. Nucl Instr Meth A. 2005;541:29. [Google Scholar]
- 12.Hurley RF, et al. Water-Equivalent Path Length Calibration of a Prototype Proton CT Scanner. Medical Phys. 2012;39(5):2438–2446. doi: 10.1118/1.3700173. [DOI] [PMC free article] [PubMed] [Google Scholar]
- 13.Penfold SN, et al. Total Variation Superiorization Schemes in Proton Computed Tomography Image Reconstruction. Medical Physics. 2010;37(11):5887–5895. doi: 10.1118/1.3504603. [DOI] [PMC free article] [PubMed] [Google Scholar]
- 14.Agostinelli S, et al. Geant4–A Simulation Toolkit. Nucl Instr Meth A. 2003;506:250. [Google Scholar]
- 15.The Phantom Laboratory. http://www.phantomlab.com.
- 16.Computerized Imaging Reference Systems, Inc. (CIRS) http://www.cirsinc.com.
- 17.Watanabe H, Honda E, Kurabayashi T. Modulation transfer function evaluation of cone beam computed tomography for dental use with the oversampling method. Dentomaxillofacial Radiology. 2010;39:28–32. doi: 10.1259/dmfr/27069629. [DOI] [PMC free article] [PubMed] [Google Scholar]
- 18.Model 30013. PTW; Freiburg, Germany: http://www.ptw.de/farmer_chambers0.html. [Google Scholar]
- 19.National Institute of Science and Technology. http://physics.nist.gov/PhysRefData/Star/Text/PSTAR.html.


