

Abstract
Many coatings properties such as mechanical, electrical, and ultra violet (UV) resistance are greatly enhanced by the addition of nanoparticles, which can potentially increase the use of nanocoatings for many outdoor applications. However, because polymers used in all coatings are susceptible to degradation by weathering, nanoparticles in a coating may be brought to the surface and released into the environment during the life cycle of a nanocoating. Therefore, the goal of this study is to investigate the process and mechanism of surface degradation and potential particle release from a commercial nanosilica/polyurethane coating under accelerated UV exposure. Recent research at the National Institute of Standards and Technology (NIST) has shown that the matrix in an epoxy nanocomposite undergoes photodegradation during exposure to UV radiation, resulting in surface accumulation of nanoparticles and subsequent release from the composite. In this study, specimens of a commercial polyurethane (PU) coating, to which a 5 mass % surface treated silica nanoparticles solution was added, were exposed to well-controlled, accelerated UV environments. The nanocoating surface morphological changes and surface accumulation of nanoparticles as a function of UV exposure were measured, along with chemical change and mass loss using a variety of techniques. Particles from the surface of the coating were collected using a simulated rain process developed at NIST, and the collected runoff specimens were measured using inductively coupled plasma-optical emission spectroscopy (ICP-OES) to determine the amount of silicon released from the nanocoatings. The results demonstrated that the added silica nanoparticle solution decreased the photodegradation rate (i.e., stabilization) of the commercial PU nanocoating. Although the degradation was slower than the previous nanosilica epoxy model system, the degradation of the PU matrix resulted in accumulation of silica nanoparticles on the nanocoating surface and release to the environment by simulated rain. These experimental data are valuable for developing models to predict the long-term release of nanosilica from commercial PU nanocoatings used outdoors and, therefore, are essential for assessing the health and environmental risks during the service life of exterior PU nanocoatings.
Introduction
Nanomaterials (i.e., particles having a dimension below 100 nm), such as carbon nanotubes (CNTs), nanoclays, metal oxide nanoparticles, and graphene have exceptional properties and large surface area. By incorporating a small amount (< 5 % by mass) of these nanomaterials into a coating formulation (i.e., nanocoating), many properties of a coating can be substantially enhanced, as evidenced in numerous reviews on nanomaterials-containing polymeric materials (1–5). In addition to the advantages of being stronger, harder, less permeable and having greater thermal and electrical conductivity, nanocoatings have been exploited in other unique applications including self-cleaning, antimicrobial, and ultra violet (UV) resistance (6). These nanocoatings are increasingly used under harsh environments in many large-volume industries such as construction, automotive, and aerospace.
Regardless of the application, both the long-term performance of the products themselves and the fate of nanomaterials in a coating play a key role in the acceptance and use of these products. There are numerous pathways where nanomaterials may be released during the life cycle of a nanocoating, including mechanical stresses (abrasion, polishing, sanding, etc.), degradation and dissolution of the polymer matrix, and fire/incineration (7–11). Release of nanomaterial by matrix degradation in outdoor uses of nanocoatings is an area of great concern because the polymer binder in a nanocoating is susceptible to degradation by the UV radiation portion of the sunlight (12). Such matrix degradation could lead to exposing nanomaterials on the coating surface, thus making it more likely that they are released into the environment. Because pristine nanosize materials have shown potential environmental, health and safety (EHS) risks (13–17), the release of nanomaterials during the service life of a nanocoating may present a roadblock to innovation and commercialization of these advanced coatings.
The release of nanomaterials induced by matrix degradation during exposure of nanocoatings to weathering environments is a complex function of environmental factors, processing, and material properties. Nanomaterials possess large surface areas and unique electronic structures, which likely affect the degradation rate and mechanism of the polymer matrix, and hence, the nanomaterial release rate. For example, as reviewed recently (18), CNTs have been shown to stabilize, while nanoclays tend to accelerate, the photodegradation of a variety of polymers. On the other hand, both zinc oxide (ZnO) and titanium dioxide (TiO2) nanoparticles can act as either a catalyst or a stabilizer for the photodegradation of polymers. Further, matrix degradation will also cause extensive oxidation, chain scission, and crosslinking of the polymer chains, which increases brittleness, loss of mechanical properties, and cracking of the nanocoatings. This will increase the possibility of nanomaterial migration and release. Mechanical vibration, rain, condensed water, snow, and wind will likely increase the release rate. Photodegradation may change the chemical and physical configuration of the nanoparticles before release as well. Once released, nanomaterials may undergo further physical and chemical transformations, which may change their properties and health and environmental impacts.
However, experimental data is still lacking on the effects of nanomaterials on the degradation of nanocoatings, on how the nanomaterials are exposed on the surface or released, and on the state (e.g., oxidation, adsorption, modification, etc.) and chemical composition of the released nanomaterials by weathering environments (7, 8, 18, 19). As a result, the long-term performance of nanocoatings and the potentially harmful effects of the nanomaterials incorporated in the coatings on the EHS have not been determined. Taking advantage of the highly uniform and high intensity UV radiation from the SPHERE device (Simulated Photodegradation via High Energy Radiant Exposure) (20), the National Institute of Standards and Technology (NIST) has investigated the degradation rate, nanomaterial surface accumulation, and the nanomaterial release for a model epoxy (no UV stabilizers) containing multiwalled CNTs (MWCNTs) and silica nanoparticles (21–25). The results have shown that untreated or silane treated nanosilica does not affect, but MWCNTs stabilize, the photodegradation of amine-cured epoxy. Further, degradation of the matrix has resulted in a substantial accumulation of nanomaterials on the specimen surface, where spherical silica nanoparticles were subsequently released to the environment, but there was no evidence of release of the high aspect ratio, fibrous MWCNTs observed.
The main objective of this study was to investigate the degradation behaviors and nanomaterial release of a commercial exterior polyurethane (PU) nanocoating containing a UV stabilizer and silane-treated nanosilica exposed to 295 nm to 400 nm UV radiation, at two relative humidities. Surface morphological changes, chemical degradation, mass loss, and quantity of silica released as a function of exposure time were characterized by various spectroscopic and microscopic techniques including atomic force microscopy (AFM), scanning electron microscopy with energy dispersive X-ray (SEM-EDX), X-ray photoelectron spectroscopy (XPS), Fourier transform infrared spectroscopy (FTIR), and inductively coupled plasma – optical emission spectrometry (ICP-OES). Because this nanocoating is a commercial material, the data obtained in this study will be valuable for assessing the long-term durability and potential EHS risks of PU nanocoatings.
Experimental Procedures*
Sample Preparation
A commercial PU containing 5 % (by mass) silane-treated nanosilica was used for this study. The PU was a combination of three parts: a thinner, a base component and an activator (PPG Industries, Inc.). The nanosilica used was a surface-treated material supplied as a suspension at 10 % to 30 % mass fraction in solvents (BYK), and was not originally part of the commercial product. The commercial PU is known to contain a UV stabilizer, but the exact formulation is proprietary. Consequently, information about the amount and chemical composition of the stabilizer, chemical composition of the polyurethane, additives, surfactants, etc., could not be obtained. Moreover, additives/surfactants in the nanosilica suspension were also proprietary.
Free standing films of both neat PU and PU containing nanosilica were prepared following the procedure described here. For the neat PU, the manufacturer recommended ratio of thinner : base component : activator = 1 : 2 : 1 (by volume) was used. For the PU nanocoating, the components were mixed at a ratio of nanosilica suspension : thinner : base component : activator = 5 : 8 : 16 : 8 (by volume). Samples of PU containing nanosilica were made by first mixing a nanosilica suspension with the thinner. The mixture was stirred using a tip sonicator (45 kHz) for 30 min. Then the PU base component was added to the mixture, and again, this was stirred using a tip sonicator (45 kHz) for 30 min. After adding the activator to the nanosilica and base component, the mixture was stirred using a mechanical stirrer at 157 rad/s (1500 rpm) for 30 min. The resulting solution was degassed in a vacuum for 60 min. Samples were made by drawdown on polyethylene terephthalate (PET) sheets, and left to dry in ambient conditions (24 °C and 50 % relative humidity) for 16 h. The final cure was done at 80 °C for 3 h in an air circulating oven. The final cure temperature was above the glass transition temperature, Tg, of the cured film, which was measured to be 40.4 °C ± 3 °C (by differential scanning calorimetry) to attain maximum curing. All uncertainty values reported in this paper represent one standard deviation. Samples of neat PU were also made with the same components, without the nanosilica, and the same procedure described above for coatings containing nanosilica. Thin film specimens were also prepared by spin casting the neat PU or PU containing nanosilica on calcium fluoride (CaF2) disks, dried for 16 h, and cured at 60 °C for 6 h. All samples were conditioned for three weeks under ambient conditions before exposure to the UV environments. Free standing films of neat PU and PU containing nanosilica were mounted on anodized aluminum (Al) disks for surface morphology measurements. Free standing films were used for surface chemical degradation, mass loss and nanoparticle release. Calcium fluoride (CaF2) coated specimens were used for measurements of bulk degradation. Hereafter, the neat PU coating and PU coating containing 5 % by mass of treated nanosilica are designated as neat PU and PU nanocoating, respectively.
UV Exposure
All specimens were exposed on the NIST SPHERE, a 2 m integrating sphere with lamps that provide intense, uniform UV light (20). Briefly, the SPHERE utilizes a mercury arc lamp system that produces a collimated and highly uniform UV flux of approximately 140 W/m2 in the 295 nm to 400 nm wavelength range. Its environmental chambers allow precisely controlled relative humidity and temperature within the sample exposure space. The visible and infrared radiation of the UV source has been minimized. Specimens for characterizing the surface morphology had a dimension of 10 mm × 10 mm and those for tracking chemical changes had a diameter of 19 mm. Specimens were loaded into a specially-designed 17-window sample holder (Figure 1a) with 19 mm windows and were exposed to an UV environment at 50 °C, one group at 75 % (humid) relative humidity (RH) and another at approximately 0 % (dry) RH. Specimens used for studying nanosilica release were a larger size, approximately 20 cm2, to allow enough silica to be collected for measurement. Nanosilica release specimens were mounted in a specially designed holder (Figure 1b) that was sealed to prevent the escape of released particles, and had a front cover made of quartz to allow UV light to reach the specimens. RH within the sample holder was sustained at approximately 80 % for a two-week interval. Specimens were removed after specified time intervals for various characterizations.
Figure 1.
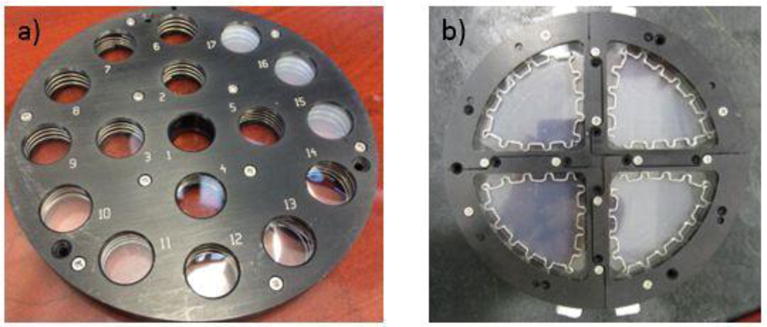
The sample configuration for (a) samples used in surface and chemical analyses and (b) nanosilica release.
Characterization
Surface Morphology and Composition
Surface morphological changes of the PU nanocoatings exposed to UV environments were followed by AFM and SEM. AFM imaging was performed using a Dimension Icon system (Bruker) equipped with silicon probes (TESP, Bruker) at ambient conditions (24 °C, 50 % RH). In addition to the traditional tapping mode (topographic and phase images), a new method using PeakForce QNM™ (Quantitative Nanomechanical Property Mapping) tapping mode (PFTM) was used to obtain higher contrast images. Topographic (height), modulus, and deformation images were obtained simultaneously using PFTM AFM with a resonance frequency of approximately 300 kHz for the probe oscillation and a free-oscillation amplitude of 62 nm ± 2 nm. Images acquired by traditional tapping mode were also taken at the same parameters. PFTM AFM is a relatively new technique where the probe and specimen are intermittently brought together (similar to traditional tapping mode, but with lower tapping force) to contact the surface for a short period (26). However, unlike traditional tapping mode where the feedback loop keeps the cantilever vibration amplitude constant, PFTM controls the maximum force (peak force) on the tip. The PFTM technique is non-destructive to the AFM tips and samples when parameters are tuned correctly, and allows for adhesion, modulus, dissipation, and deformation to be distinguished. This study took advantage of PFTM’s ability to quantitatively map the nanomechanical properties of a surface. Such unambiguous mechanical property imaging is useful for the detection of hard silica nanoparticle (modulus 80 GPa) accumulation on a softer polyurethane matrix (< 1 GPa). The measured deformation, defined as the penetration of the tip into the surface at the peak force after subtracting cantilever compliance (includes both elastic and plastic contributions) (26), was utilized to follow surface morphological changes of PU nanocoatings exposed to UV environments.
SEM imaging of UV-exposed PU nanocoating surfaces was performed using a JSM 6400F field emission scanning electron microscope (FE-SEM) (JEOL) operated at 5 kV accelerating voltage with a backscattered electron (BSE) detector. In addition, to identify the surface elemental composition, energy dispersive X-ray (EDX) (Bruker) spectra were also obtained. The specimens for SEM imaging were coated with a carbon film of ≈ 2 nm thickness to minimize charging of the PU matrix under the imaging and EDX measurements.
Chemical Degradation
The chemical degradation of both neat PU and PU nanocoating was measured using FTIR in both transmission (T) and attenuated total reflection (ATR) modes. All FTIR spectra were the average of 128 scans recorded at a resolution of 4 cm−1 using dry air as a purge gas and a Nexus 670 spectrometer (Thermo Nicolet) equipped with a liquid nitrogen cooled mercury cadmium telluride (MCT) detector. A ZnSe prism and 45° incident angle were used for the FTIR-ATR measurement. The peak height was used to represent the infrared intensity, which is expressed in absorbance, A. All FTIR results were the average of three specimens.
XPS data was acquired on an Axis Ultra DLD Imaging X-ray Photoelectron Spectrophotometer (Kratos Analytical). Samples were transferred from the SPHERE to the XPS laboratory in plastic bags to shield from external contaminants. Photo-emission was achieved using monochromatic Al Kα X-rays (104 W) with photoelectrons collected along the surface normal and analyzed at pass energy 40 eV. All samples were measured three to four times.
Mass Loss
Mass loss was measured by gravimetry using an analytical balance (Mettler Toledo) having a resolution of 10−5 g. Three replicates were used for the mass loss measurement.
Nanoparticle Release
To facilitate the release of nanosilica from the nanocoatings after UV exposure, a water spray protocol that simulates rain, developed previously in our laboratory (21), was used. Figure 2 illustrates a schematic of the process used to spray the UV exposed specimens with water. At specified exposure intervals, one quarter of the sealed specimen holder was opened, the holder was placed at a 45° angle to the horizontal surface, and the UV-exposed surface was sprayed with de-ionized (18 MΩ DI) water using a chromatographic atomizer. The atomizer was kept at a 10 cm distance from the specimen surface and used an atomizing air pressure (approximately 83 kPa) that produced a constant air flow rate of 16 L/min. The runoff water from each spraying was collected in polyethylene bottles for analysis. Four 20 cm2 nanocoating specimens were used for the nanosilica release study; therefore this process was repeated for each of the four quarters. The following protocol was used to improve the reproducibility of the spraying process and the collection of nanoparticles released after each interval: 5 mL of water was poured on the specimen immediately upon opening the sample holder to prevent loss of loose particles, a 5 min spraying with the atomizer on the exposed side, and a 1 min spraying with the atomizer on the unexposed side. A volume of approximately 15 mL of water was collected for each spraying process. After spraying, the same specimens were resealed in the holder for further UV exposure.
Figure 2.
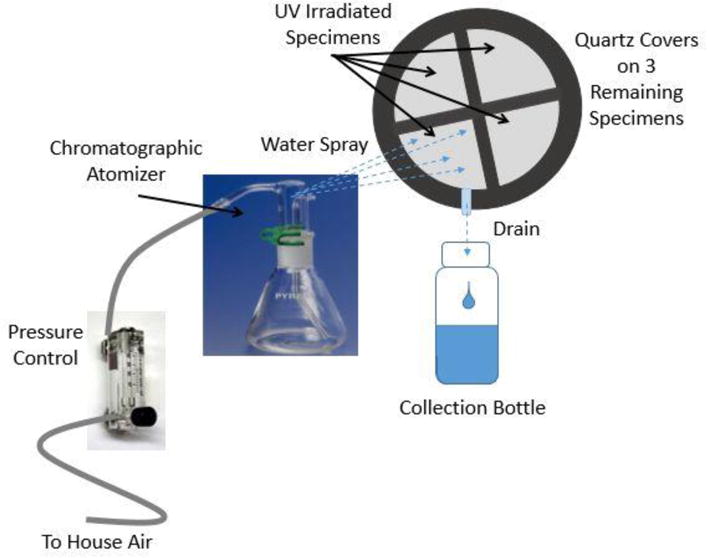
A schematic of the system used for rinsing and collecting runoff water from samples exposed to UV radiation.
Runoff water collected at specified time intervals was analyzed by ICP-OES for silicon (Si) content. ICP-OES is a multi-element analysis technique that uses an inductively coupled plasma to vaporize the specimens and then excite the atoms and/or ions of the specimens. The analyses were performed using an Optima 5300 DV instrument (Perkin Elmer). The detection limit of ICP-OES for Si was ≈ 5 μg/kg; solution concentrations are expressed per mass of solution. The method of standard additions was used to quantify the mass of Si release. Each runoff water specimen collected in a bottle was split into two solutions and one solution was spiked with Si. The spike stock solution contained 3.39 mg/kg Si, prepared from the SRM 3150 Silicon Standard Solution (Lot # 071204). A 0.5 g aliquot was taken from the Si spike stock solution and added to a 5 g sample solution. Phosphorus was used as an internal standard at a concentration of 1 mg/kg. The Si mass fractions in the solution specimens were measured according to the parameters given elsewhere (21). Each solution was measured twice and all results were the average of four specimens, except where exposure conditions were known to vary significantly.
Results and Discussion
Surface Morphology and Composition
Exposure in a UV environment and subsequent degradation of the polymer matrix in a nanocoating would potentially expose nanoparticles on its surface. Changes in the surface morphology of the PU nanocoating surface with UV exposure were studied using AFM and SEM. These two nanoscale microscopic techniques have been demonstrated previously as effective tools for imaging silica nanoparticles formed on UV-exposed nanocomposites (19, 21, 23, 25).
Figure 3 displays AFM images taken after both 9 d and 14 d of UV exposure under dry conditions (≈ 0 % RH) using traditional and PFTM tapping modes. Typically, phase images can provide useful information about polymer coatings heterogeneity when there is a good contrast between the different regions. However, in this system, especially for the surface at earlier exposure times, it was difficult to distinguish the nanoparticle/particle clusters from the underlying PU microstructure in the phase images due to the multiphase nature of PU microstructures, as shown in Figure 3a. It appears that the modulus and deformation images (especially the latter) in the PFTM mode has provided a better contrast between hard particles (darker regions as indicated by arrows in the deformation images) and the polymer matrix at short exposure times (Figure 3b). Note that deformation depths in the PFTM mode are limited to a few nanometers, which yield a much higher resolution mapping when compared to the lower spatial resolution mapping seen with the larger tip-sample contact areas when using traditional tapping mode (higher tapping force). At the longer exposure times (14 d), particles/particle clusters emerged on the coating surfaces; the images generated using traditional tapping mode (phase image) and PFTM mode (Figure 3c and 3d) were similar. In order to determine the onset of the appearance of particles on the nanocoating surface, a combination of height and deformation images was selected for monitoring the surface morphology changes and the appearance of particles on the surface for the rest of this study.
Figure 3.
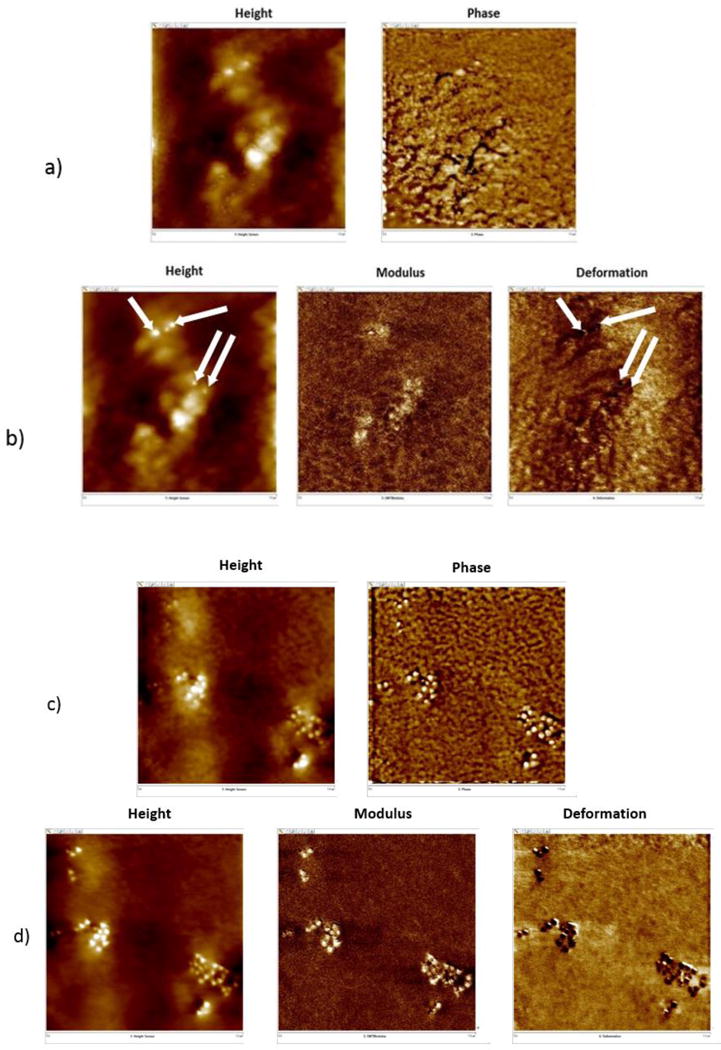
Representative AFM images obtained at the same location of nanocoating surface exposed to UV radiation in dry conditions using (a) traditional tapping mode (height and phase), and (b) PFTM mode (height, modulus, and deformation) for 9 d and (c) traditional tapping mode, and (d) PFTM mode for 14 d. The arrows in the height and deformation images indicate the particle locations. Each image is 1 μm × 1 μm.
Figure 4a displays representative standard height AFM images for various UV exposure times under the dry condition. The numbers in the lower right corners indicate d of exposure. The unexposed surface (i.e. zero days of exposure) appeared smooth with little evidence of particles on the surface. However, after 9 d bright spots (Figure 4a) can be seen on the nanocoatings surface. The brightness of these particles indicated that they were raised above the surface. With further exposure, these particles seemed to form clusters. From the deformation images (Figure 4b), the contrast between the particles and the polymer matrix are distinguishable, where the darker color represents a lower deformation of the surface (i.e., a harder region with less deformation). The areas of lower deformation correlate well with areas of higher topography, reinforcing that they are particles or particle clusters. Therefore, Figure 4 indicates that, while the height images in Figure 4a support the ability to follow the accumulation of particles on the UV-exposed PU nanocoating surface, the deformation images in Figure 4b provide a better contrast between the particles (assumed to be silica nanoparticles) and the PU matrix. Distinct particles (approximately 34 nm ± 2 nm in diameter) are readily visible in the deformation images after 9 d of UV exposure.
Figure 4.
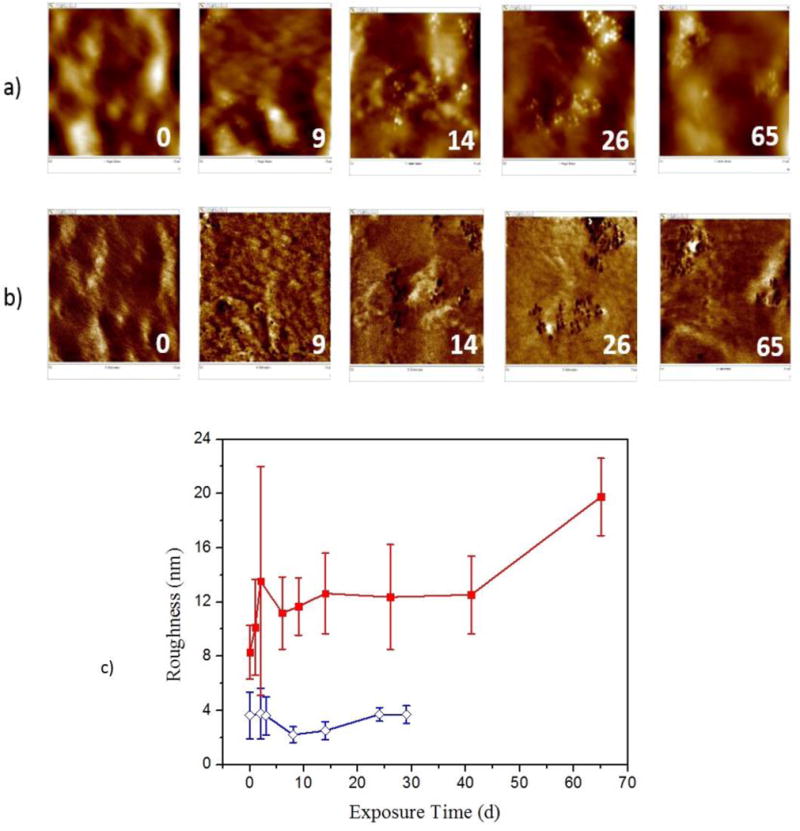
Representative AFM (a) height images, (b) deformation images, and (c) a plot of rms roughness change (from 20 μm scan size, (includes rms roughness of neat PU (
 )) of a PU nanocoating (
 ), exposed to UV radiation under the dry condition, showing particles on the surface. Each image is 1 μm × 1 μm. Numbers in the images indicate days of exposure. All data points are the average of three specimens, and error bars represent one standard deviation.
Degradation of the surface can be verified by the specimens’ root mean square (rms) roughness from the 20 μm scan size images (Figure 4c), which gradually increased from 8.3 nm ± 2.0 nm before exposure to 12.4 nm ± 3.9 nm after 26 d exposure, and to 20.0 nm ± 2.9 nm after 65 d of UV exposure. It should be mentioned that the roughness value of neat PU before exposure was 3.6 nm ± 1.7 nm and remained essentially unchanged during the same exposure period, suggesting that the degradation on the neat PU surface was either small or a uniform process.
A comparison of the nanocoatings surfaces exposed to UV at different humidity conditions for two different exposure times is shown in Figure 5. Representative height and deformation images of the PU nanocoating specimens exposed under the dry condition (Figure 5) after 6 d and 9 d were compared with specimens exposed to the humid condition for the same time intervals. Under the humid condition (75 % RH), the degradation of the PU matrix occurred earlier in the exposure (also confirmed in the chemical data, as described later). These images also indicate that specimens exposed to the humid condition have evidence of particles on the surface with fewer days of exposure. After 6 d of exposure, the surface of the samples exposed under dry conditions appeared to show more variation, but there was no evidence of particles on the surface. However, particles were detected on the surface of the specimens exposed to the humid condition at 6 d while it took 9 d to see particles on the surface of specimens exposed to dry conditions. Nanoparticles also formed larger clusters with fewer days of exposures under higher humidity conditions as well; after 9 d of exposure to the humid condition, the particles formed clusters. It should be mentioned here that the amount of silica nanoparticles accumulated on this commercial PU nanocoating surface was far less than that previously observed for epoxy (21, 25) and polyamide (19) nanocomposites exposed to the same UV source. For these previous studies, the silica nanoparticles were observed to cover the entire surface at a much shorter time. The reduced amount of nanosilica observed for PU nanocoating is attributed to the low rate of matrix degradation, due in part to the presence of UV stabilizer, additives and/or the chemical structure of the commercial PU or nanosilica solution. The results demonstrate that the AFM deformation imaging technique (PFTM) combined with the topographic images can be used to effectively follow the accumulation of inorganic nanoparticles on a nanocoating surface during exposures to weathering environments.
Figure 5.
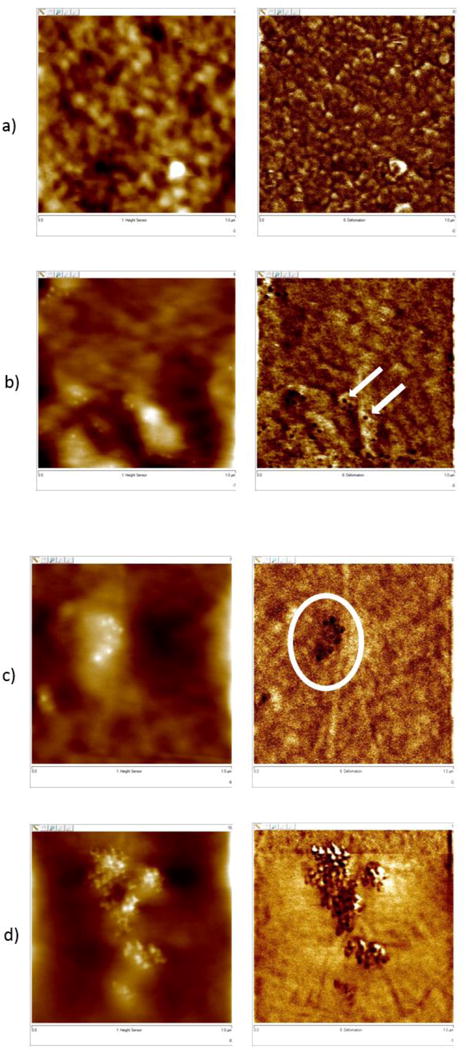
Comparison of AFM height and deformation images of PU nanocoating exposed to UV radiation at 50 °C in the dry condition after (a) 6 d and (b) 9 d to specimens exposed to the humid condition, also after (c) 6 d and (d) 9 d. Each image is 1 μm × 1 μm with the corresponding height image to the left of each deformation image.
SEM was used to examine the particles on the surface of the PU nanocoating. Figure 6 shows images at two magnifications taken before exposure (Figure 6a) and after 26 d of exposure (Figure 6c and 6d). Numerous bright particles surrounded by a darker matrix can be seen in the images. To identify the elemental composition of the different areas on the surface, EDX spectra of the darker area and bright spots were obtained, and the results are shown in Figure 6b. The dark area contained mainly carbon (C) and a small amount of oxygen (O), indicating they were mostly of the PU polymer. On the other hand, in addition to C and a greater amount of O, the bright spot areas contained silicon (Si), suggesting that the areas near the bright spots include both polymer and silica nanoparticles, most likely a result of the interaction volume. It should be mentioned that, except for higher Si and O intensity at some bright spot areas, EDX spectra (not shown) taken from the dark and bright areas of the UV-exposed nanocoating were similar to those of the unexposed nanocoating. It is worth noting that SEM can detect BSE from depths up to 90 nm below the film surface (27). This is consistent with our hypothesis that many of the particles may be subsurface (1 nm to 90 nm), especially for the unexposed sample, since AFM (a surface sensitive measurement) did not show particles on the unexposed PU nanocoating surface and neat PU samples show only minor evidence of surface contamination (not shown). Accordingly, after 26 d of exposure to UV there were more particles at or near the surface.
Figure 6.
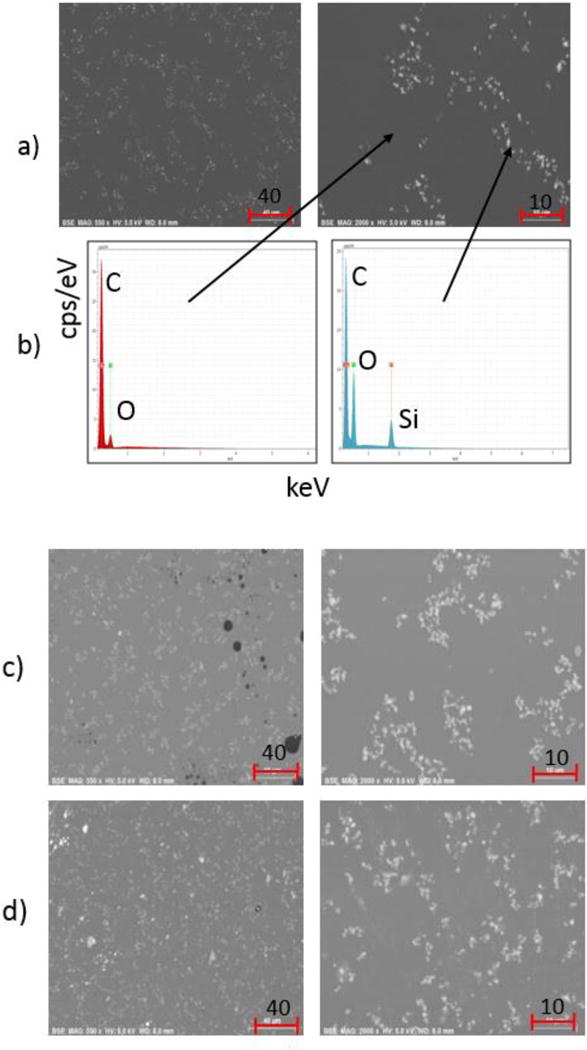
BSE FE-SEM micrographs at two different magnifications of PU nanocoating; (a) unexposed film, (b) representative EDX spectra of dark area and bright particle area, (c) a film exposed for 26 d under dry conditions, and (d) a film exposed for 26 d under humid conditions. Scale bars are in μm.
Furthermore, the nanoparticle clusters were larger and closer to nearest neighbors, likely influenced by the depletion of the PU matrix and collapse of particles or a localized movement of particles on the surface. To quantify the degree of clustering such as cluster size and distribution, image analyses were performed on the high resolution SEM micrographs (2000× images in right-side column of Figure 6) using the commercially available Image J program. The cluster size (apparent diameter) of particles in the unexposed films ranged from 0.5 μm to 2.5 μm, and the population (in percentage) of cluster size greater than 1 μm is approximately 30 % ± 2 %. After exposure, a higher number of the larger clusters (greater than 3 μm) were observed. The populations of cluster size greater than 1 μm are approximately 42 % ± 1 % and 44 % ± 8 % for films exposed for 26 d under dry and under humid conditions, respectively. All data are the average of two locations, and uncertainties given represent one standard deviation. The results of image analyses confirmed that larger clusters have appeared after exposure, and the greater uncertainty (± 8 %) under humid condition also indicates clusters distribution was not uniform from location to location. This may indicate that the dispersion of nanosilica in this commercial PU coating was poor or that particles were locally mobile. Flocculation behavior of nanoparticles dispersed in polymer systems has been reported in previous studies (28–31). Various strategies for controlling the dispersion of nanoparticles in polymers are employed such as directed self-assembly techniques (32) or including additives or surfactants, which may have been used here. The role of dispersion on the degradation and nanoparticle release of nanocoatings and nanocomposites is a subject of great interest for both performance and EHS perspective.
Chemical Degradation
Both FTIR-T and FTIR-ATR were used to assess the chemical changes of the PU nanocoatings as a function of UV exposure. The FTIR-T measurements were carried out on thin film (thickness of < 10 μm) cast on a CaF2 substrate, while FTIR-ATR was performed on the thick (thickness of ≈ 180 μm) films. FTIR-T is a quantitative technique that can provide useful data about the effects of nanomaterials on the degradation rate of the bulk matrices. On the other hand, the FTIR-ATR technique can detect chemical changes of both the polymer matrix and the nanoparticles at or near the surface of the nanocoating.
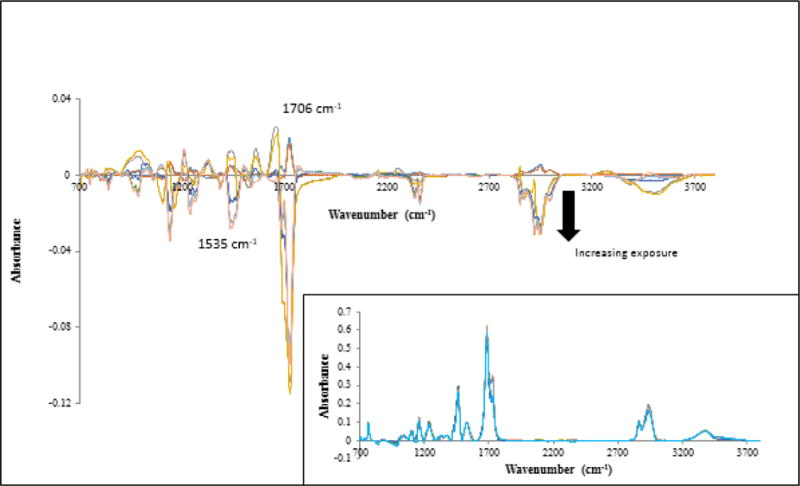
Figure 7 displays the difference FTIR-T spectra of PU nanocoating taken at different exposure times in the NIST SPHERE UV environment at 50 °C and dry conditions. These spectra were obtained by subtracting the spectrum of the unexposed specimen from those recorded at different time intervals, on the same specimen to assure the gain or loss of a particular functional group and the appearance of a new species are more readily observed. The inset is the unprocessed FTIR-T spectra of PU nanocoating taken at different exposure time, which showed only some small changes of the PU bands. The effect of UV exposure on chemical changes is more visible in the difference spectra. For example, the intensity of existing bands at 1690 cm−1, 1535 cm−1, 1245 cm−1, and 2933 cm−1 decreased, and the intensity of several new bands at 1706 cm−1, 1750 cm−1, and 3475 cm−1 increased, with exposure time. Similar spectral changes (not shown) were observed for the neat PU coating.
Figure 7.
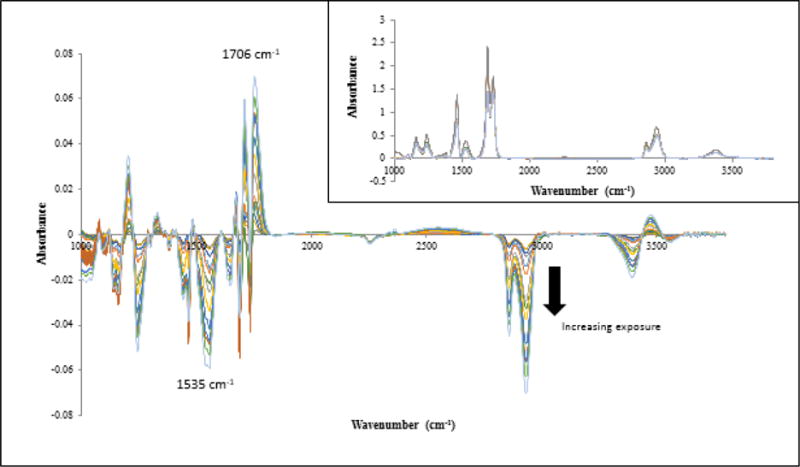
Difference FTIR-T spectra of the PU nanocoating exposed to UV environment for different time intervals at 50 °C and dry conditions. The arrow indicates increasing exposure time to 78 d. Inset shows unprocessed FTIR-T spectra of the same.
The similar chemical changes caused by UV radiation for both neat PU and the PU nanocoating suggest that both materials follow the same degradation mechanism. Further, the formation of acid C=O at 1706 cm−1 and acetyl urethane at 1750 cm−1 is consistent with a previously proposed mechanism on photooxidation of ester-based PU (33). According to this mechanism, in the presence of oxygen and UV light, the urethane groups are oxidized to form acetylurethane (1750 cm−1 band), which is easily hydrolyzed by water to form acids. The ester resin portion also undergoes degradation to form a number of oxidized products, such as acids and alcohol. The bands at 1535 cm−1, due to amide II, and 1706 cm−1, due to C=O of acids, were used to follow the chain scission and oxidation, respectively, of neat PU and PU nanocoating exposed to UV at 50 °C.
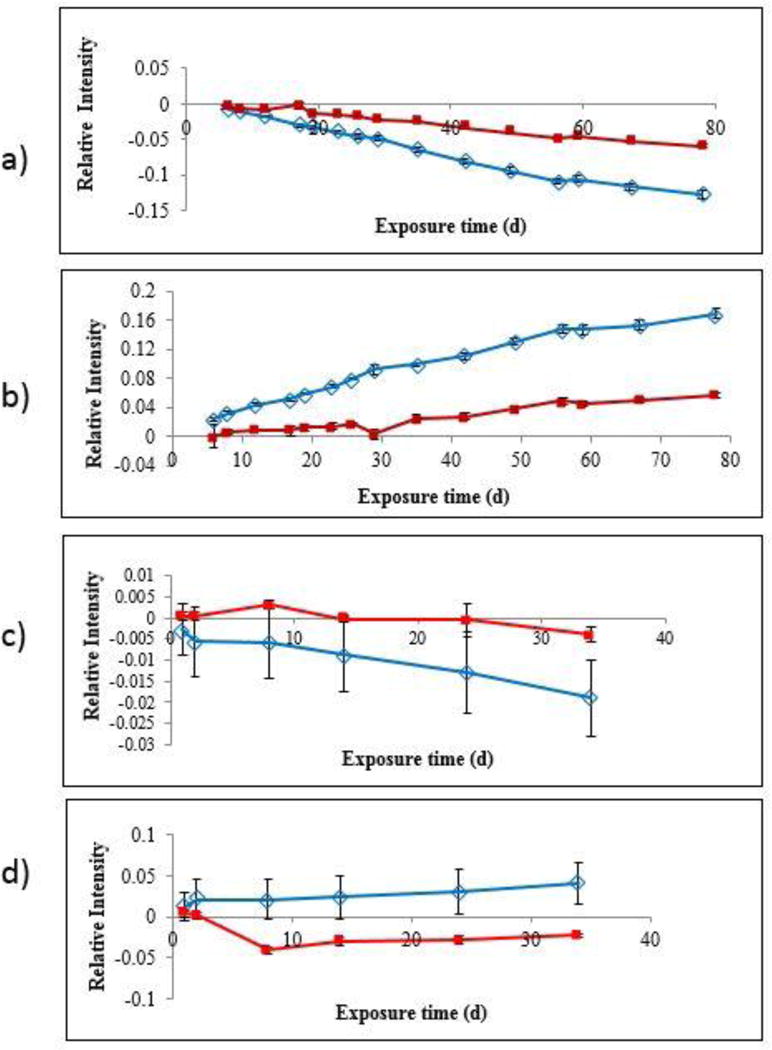
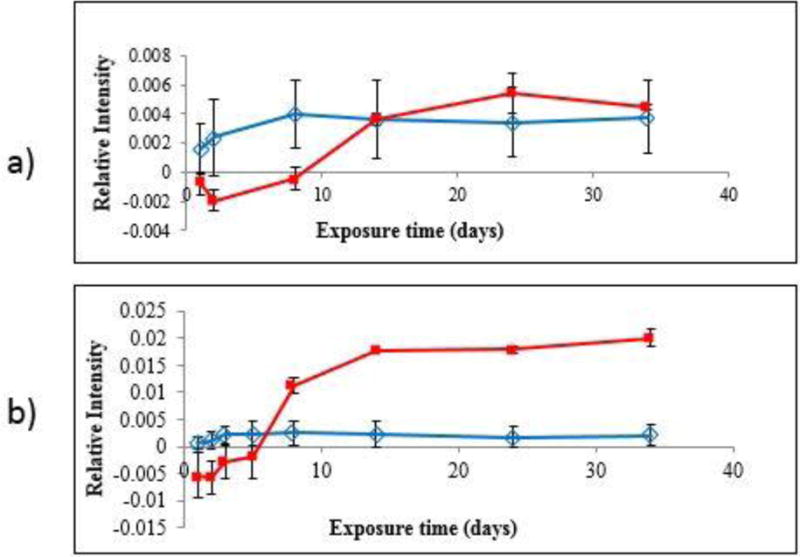
The chain scission and oxidation of neat PU and PU nanocoating results are shown in Figures 8a and 8b, where changes in FTIR absorbance are plotted versus UV exposure time. Similar plots for other bands followed the same trend. Figure 8 shows that both neat PU and PU nanocoating underwent photodegradation almost linearly with exposure time, with chain scission (1535 cm−1 band) (Figures 8a and 8c) and formation of oxidized products (1706 cm−1 band) (Figures 8b and 8d). The results also revealed that the rates of chain scission and oxidation of the PU nanocoating were lower than those of the neat PU. Because the only difference between these two materials was the presence of 5 % nanosilica in the PU nanocoating, these results suggest that the nanosilica used in this study have decreased (i.e., stabilized) the photodegradation of PU nanocoating. This is in contrast to previous studies for other polymers, where nanosilica was found to neither catalyze nor stabilize the photodegradation of epoxy (25) or polyamide (19). It is not known whether nanosilica alone, or in concert with UV stabilizers or other additives in the commercial PU or nanoparticle suspension, provided the ability to photostabilize the degradation of PU. A study of the effect of nanosilica on the degradation of unstabilized PU could address this question.
Figure 8.
(a) Chain scission (1535 cm−1), and (b) oxidation (1706 cm−1) of neat PU (
 ) and PU nanocoating (
 ) as a function of UV exposure time measured by FTIR-T technique. (c) Chain scission (1535 cm−1) and (d) oxidation (1706 cm−1) of neat PU (
 ) and PU nanocoating (
 ) as a function of UV exposure time measured by FTIR-ATR technique. All data points are the average of three specimens, and error bars represent one standard deviation. All specimens were exposed at 50 °C and dry conditions.
FTIR-ATR difference spectra (Figure 9), calculated by the same process as with the FTIR-T spectra after normalizing to a reference band (761 cm−1, which was found to vary little with exposure time) to account for any morphological and mechanical changes during sampling, was used to follow chemical degradation near the surface of both neat PU and PU nanocoating as a function of UV exposure. As the degradation became more severe, the surface became rougher and stiffer, which may reduce contact of the ATR probe with the specimen surface and, therefore, the FTIR-ATR intensity, so normalization was necessary. Very little change can be seen in the plots of intensity changes with UV exposure time up to 34 d for neat PU and PU nanocoating measured by the FTIR-ATR (Figures 8c and 8d). It should be stated that chemical changes near the surface of both neat PU and PU nanocoating after 34 d of UV exposure were small (< 0.02 absorbance). This is likely due both to the PU being stabilized and the shallow probing of the FTIR-ATR technique from the increased roughness due to degradation and the appearance of particles. For the ATR ZnSe prism and the 45° incident angle used in this study, the chemical changes shown in Figures 8c and 8d were within 2.5 μm from the surface, which is many times thinner than that of the spin-coated specimens used for FTIR-T measurement. Although the chemical changes were small, the general trends were that both the oxidation and chain scission of the PU nanocoating were slightly greater than those of the PU, which is consistent with the FTIR-T data.
Figure 9.
Difference FTIR-ATR spectra of the PU nanocoating exposed to UV environment for different time intervals at 50 °C and dry conditions. The arrow indicates increasing exposure time to 34 d. Inset shows normalized FTIR-ATR spectra of the same.
However, FTIR-ATR for the humid conditions (spectra not shown) exhibit similar changes to those of the dry condition with one exception, the intensity of the band peak at 1101 cm−1 was higher. Figure 10 shows the intensity changes of the band at 1101 cm−1 for both the dry and humid exposure conditions, which has been assigned to a combination of the C-O bond of the polymer and the Si-O-Si bond of the nanosilica (19, 21), evidence that more nanosilica was near the surface in the samples exposed in the humid condition. A small intensity increase of the 1101 cm−1 band after 10 d of exposure under dry conditions (Figure 10a) for the PU nanocoating suggests that more nanosilica particles started to appear near its surface. The intensity increase of the 1101 cm−1 band was even more evident after 10 d of exposure under humid conditions (Figure 10b). Further, under humid condition, the intensity of this band started to increase at an earlier exposure time than that under dry condition.
Figure 10.
Intensity changes of the FTIR-ATR band at 1101 cm−1 for neat PU (
 ) and PU nanocoating (
 ) as a function of UV exposure time under: (a) dry conditions and (b) humid conditions. All data points are the average of three specimens, and error bars represent one standard deviation.
XPS analysis was performed to determine the impact of UV exposure on the photodegradation of the PU matrix material, and if the presence of any degradation yielded a surface enhancement of silicon (results not shown). The analysis focused on the C (1s), N (1s), O (1s) and Si (2p) elemental transitions for UV exposures at both 0 % RH and 75 % RH. The results for samples exposed under the dry condition show that over the course of ≈ 40 d of UV exposure the elemental distribution at the surface followed no statistical trends for all elements. Later in the exposure the carbon surface composition was reduced and the oxygen concentration increased, although these changes were small. The PU nanocoating composites exposed to UV under humid conditions exhibited minimal changes in elemental concentration through 94 d of UV exposure. The enhanced consistency in the elemental distributions suggests improved resistance to transformations at the sample surface when exposed under humid conditions.
Indeed, while the results appear to suggest that the composite’s UV stabilizer was extremely effective at mitigating photo-oxidative processes within the polymer at early exposures; longer exposures seem to show small changes in elemental composition. It is also important to note that any surface transformation may involve only the surface layer and be weakly bound and easily removed by light abrasion. Regardless, this is in stark contrast to previously reported epoxy-based Si nanocomposites which demonstrated a much greater degree of consistent photooxidation (18, 22–24).
Mass Loss
Mass loss as a function of UV exposure up to 34 d for both neat PU and PU nanocoating was measured. The mass loss was determined using the expression (Mt − M1)/M1 ×100, where Mt is the mass at a given exposure time and M1 is the mass at 1 d. The mass loss for both materials was within the uncertainty from the balance (1×10⁻⁴ g at a 95% confidence level) and measurement uncertainties due to environmental factors (moisture adsorption, electrostatic interactions, etc.) for the 34 day exposure period; values are as expected because the PU contained an UV stabilizer.
Nanoparticle Release
As described earlier, UV-exposed PU nanocoating specimens of 20 cm2 were sprayed with DI water using a process that simulates rain, and the runoff waters were collected and analyzed by ICP-OES. Eight samples of runoff water from four UV-exposed nanocoating specimens were analyzed. There was an average of 0.58 μg ± 0.07 μg of Si measured from the specimens before exposure. A similar amount was found on the unexposed neat PU specimens that were rinsed, which could be due to contamination from the surroundings and should not affect the Si release values obtained during UV exposure. This background amount of 0.58 μg was subtracted from all subsequent measurements.
The amount of Si collected at each interval, in μg, versus days of exposure is depicted in Figure 11. While the amount of Si released from the PU nanocoating was small, there did seem to be an increase in the amount of Si collected as exposure time increased. In fact, there seemed to be an initial increase after 14 d of exposure, then another increase after 87 d exposure. It is possible that after the PU nanocoating underwent 87 d of exposure, the amount of nanosilica accumulated on the surface allowed for clusters that grew to a size that was more easily rinsed off. The average total of Si collected from three specimens over the 14 d experiment period was 14.2 μg ± 1.0 μg. It is plausible that nanoparticle interactions due to degradation/defects of the surface treatment and the silica nanoparticles’ stabilization of the PU matrix contributed to a release rate of only 0.0052 μg/cm2/day nanosilica. This amount of nanosilica collected from the commercial PU nanocoating was less than the 0.143 μg/cm2/day nanosilica reported for model epoxy/nanosilica composites exposed to the same UV source (21). Release rates were obtained using molecular masses of 28 g/mol and 60.08 g/mol for Si and SiO2 (silica), respectively, a 60 cm2 surface area (three specimens), and 98 days of exposure.
Figure 11.
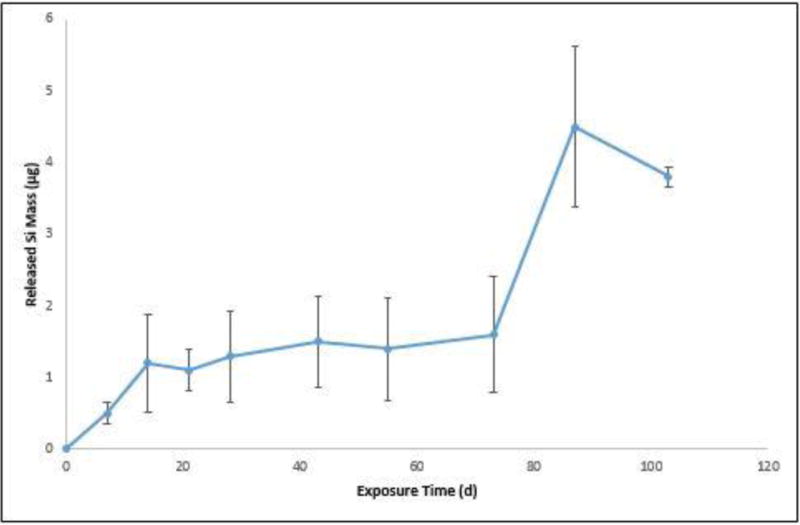
Amount of released Si from PU nanocoating exposed to UV radiation at 50 °C and humid conditions as measured by ICP-OES. All data points are the average of three specimens, and error bars represent one standard deviation.
To provide an estimate of how much nanosilica was actually released with respect to the total nanosilica in a given degradation depth of the nanocoating, we performed the following calculation. From the internal reflection theory (35) and using a ZnSe prism and 45° incident angle, the ATR probing depth for the band at 1535 cm−1 (NH bending) is calculated to be 1.5 μm from the surface. From Figure 9, the absorbance (FTIR-ATR) of the band at 1535 cm−1 of the unexposed sample is 0.3 and the absorbance loss of this band after 34 d exposure is 0.025. Because absorbance is linearly proportional to thickness, the 0.025 absorbance loss corresponds to a thickness loss of 0.125 μm. The total material mass loss after 34 d exposure is determined by multiplying the thickness loss (0.125 μm) by the sample area (20 cm2 for the rinsed release samples) and nanocoating density (1.13 g/cm3, i.e., 5 % nanosilica had little effect on the density of the polymer composite). Using these numbers, the total material mass loss after 34 d exposure is estimated to be 282.5 μg, from which 14.1 μg (5 %) is the mass of SiO2; assuming SiO2 nanoparticles were dispersed uniformly in the polymer matrix. On the other hand, the release Si mass was 1.5 μg after 34 d exposure (from Figure 11), which corresponds to a SiO2 mass loss of 3.2 μg (by multiplying by the ratio 60/28: molecular mass of SiO2/molecular mass of Si), assuming that all Si were from SiO2. This calculation shows that the SiO2 release obtained from ICP results was approximately 4 times smaller than the mass loss obtained from the ATR-based results. Several factors may contribute the differences: (1) SiO2 particles are not well-dispersed in the polymer matrix, or inhomogeneous photodegradation of polymer matrix, (2) some SiO2 still adhere to the matrix surface and were not removed by water spraying, as shown previously (21), and (3) SiO2 particles or SiO2-polymer particulates migrate to and stick the backside surfaces during spraying, as observed visually.
Although more extensive research is needed by taking into account factors such as natural weathering environments, moisture effect, the type of PU material, whether the clusters are still covered in PU after released, and the effect of UV stabilizer amount and composition on the release rate, the information provided by this work is valuable for assessing the long term performance and health and environmental risks of PU nanocoatings as well as for developing a model to predict the release of nanosilica during the service life of commercial PU nanocoatings.
Mechanism of Nanoparticle Release by UV Exposure
From the results presented above, a proposed process of degradation and release is illustrated in Figure 12. Initially the nanoparticles are covered by a thin layer of polymer. However, as the polymer matrix is removed by degradation, these nanoparticles are exposed on the surface. The majority of the data acquired suggests that as the polymer degrades, silica nanoparticles evolve along the surface and form clusters. While the XPS data did not support this result, one explanation could be that the sample storage and transportation process may have removed the weakly attached degradation products revealing the untransformed composite beneath. However, there are several possible mechanistic reasons for silica nanoparticles to form clusters on the surface with UV degradation: 1) specimens were exposed at a temperature that is above the Tg of PU (40.4 °C ± 3 °C) so particles may be more mobile 2) degradation, damage to, or defects in, the surface treatment of the nanosilica may allow the particles to be electrostatically attracted to other particles and surfaces and 3) clustering may lower the surface energy of the nanocoating, due to changes in the nanoparticle surface treatment (34). Once accumulated on the surface, nanoparticle clusters eventually reach a size that allows them to be removed as agglomerated particles, which should release more easily than well-dispersed particles. Vibration, abrasion, or rinsing may enhance the removal of agglomerated particles. It also seems that clusters were formed more quickly when exposed to UV light under humid conditions than under dry conditions. It should be noted that a mechanism on nanoparticle release from polymer nanocomposites exposed to UV radiation has been previously presented (25). In that mechanism, it was suggested that nanoparticles accumulated on the UV-exposed nanocomposite surface are randomly released after reaching a critical concentration. In the present proposed mechanism, we believe that the silica nanoparticles were not released randomly from any location of the exposed surface, but from the nanoparticle clusters where they weakly adhere to each other by secondary forces. Due to the stabilizers in the PU or the initial nanosilica suspension little degradation was seen; likely only small clusters were formed or released in the time frame of exposure. However, from the ICP data (Figure 11) we can say that after enough exposure and subsequent degradation of the matrix these clusters are released, although the amounts are quite small.
Figure 12.
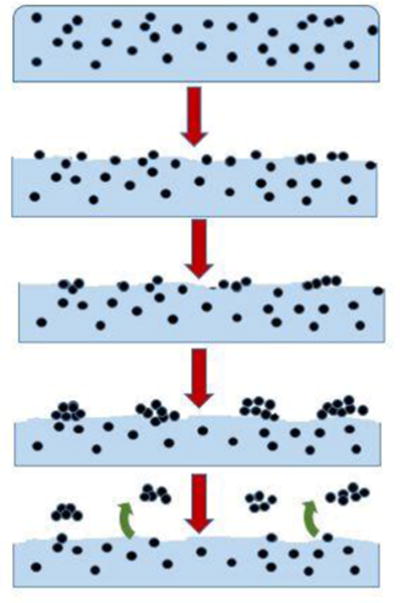
Schematic of matrix degradation, formation of particle clusters, and release of particle clusters with increasing UV exposure. Arrows indicate increasing exposure time.
Conclusions
We have investigated the degradation behavior and release of nanosilica of a commercial PU coating containing an UV stabilizer subject to 295 nm to 400 nm UV radiation at 50 °C and two relative humidities. Surface morphological changes, chemical degradation, mass loss, and quantity of nanosilica released as a function of UV exposure were characterized by various spectroscopic and microscopic techniques.
Based on the experimental results, the following conclusions can be made.
During exposure to UV radiation at 50 °C and both dry and humid conditions, the matrix in a commercial PU nanocoating containing nanosilica underwent a small amount of photodegradation, resulting in nanosilica migration to or aggregation on the surface and subsequent release from the nanocoating.
Silica nanoparticles were observed to accumulate and cluster on the nanocoating surface with increasing UV exposure time and the cluster size was larger under humid conditions than under dry conditions.
A combination of height and deformation images in new PeakForce QNM™ mode was found as a suitable technique to follow nanosilica accumulation on PU nanocoating surface during UV exposure.
The rate of chemical degradation of the commercial PU nanocoating was lower than that of the neat PU, indicating that the nanosilica system had photostabilized the PU matrix.
A small quantity of nanosilica, associated with 14.2 μg ± 1.0 μg Si, was released at a rate of 0.0052 μg/cm2/day nanosilica during UV exposure at 50 °C and humid conditions from the commercial PU nanocoating. This is far less than that previously observed for unstabilized epoxy (21) and polyamide (19), and is attributed to the low rate of degradation of the photo-stabilized commercial PU.
A new nanoparticle release mechanism is proposed in which nanoparticles are released from their clusters where they are adhered to each other by weak secondary forces; this is different from the mechanism of random release after nanoparticles accumulated on the surface reach a critical concentration proposed previously (25).
The results of this study will be useful for developing a model to predict the long term release of nanosilica from commercial PU nanocoatings and nanocomposites used outdoors. The protocols and methodologies developed for exposing samples to weathering environments, for characterization of nanoparticles on a specimen surface, and for quantifying nanosilica release during UV exposures should be helpful for developing standards to conduct weathering experiments that measure the release of metal oxide nanoparticles from commercial nanocoatings. Finally, the observations of nanosilica surface accumulation and release during UV exposure should be useful for assessing the potential EHS risks of PU nanocoatings used outdoors.
Footnotes
Certain commercial product or equipment is described in this paper in order to specify adequately the experimental procedure. In no case does such identification imply recommendation or endorsement by the National Institute of Standards and Technology, nor does it imply that it is necessarily the best available for the purpose.
References
- 1.McNally T, Pötschke P, editors. Polymer-carbon nanotube composites, preparation, properties, and applications. Woodhead Publishing; Philadelphia: 2011. [Google Scholar]
- 2.Potts JR, Dreyer DR, Bielawski CW, Ruoff RS. Graphene-based polymer nanocomposites. Polymer. 2011;52:5–25. [Google Scholar]
- 3.Li B, Zhong WH. Review on polymer/graphite nanoplatelet nanocomposites. J Mat Sci. 2011;46:5595–5614. [Google Scholar]
- 4.Pavlidou S, Papaspyrides CD. A review on polymer-layered silicate nanocomposites. Prog Polym Sci. 2008;33:1119–1198. [Google Scholar]
- 5.Zou H, Wu SS, Shen J. Polymer/silica nanocomposites: preparation, characterization, properties, and applications. Chem Rev. 2008;108:3893–3957. doi: 10.1021/cr068035q. [DOI] [PubMed] [Google Scholar]
- 6.Market report #52. Future Markets, Inc.; Apr, 2012. Nanomaterials in plastics and advanced polymers. [Google Scholar]
- 7.Froggett SJ, Clancy SF, Boverhof DR, Canady RA. A review and perspective of existing research on the release of nanomaterials from solid nanocomposites. Part Fibre Toxicol. 2014;11(1):17. doi: 10.1186/1743-8977-11-17. [DOI] [PMC free article] [PubMed] [Google Scholar]
- 8.Duncan TV. Release of Engineered Nanomaterials from Polymer Nanocomposites: the Effect of Matrix Degradation. ACS Appl Mater Interfaces. 2015;7:20–39. doi: 10.1021/am5062757. [DOI] [PubMed] [Google Scholar]
- 9.Nowack B, David RM, Fissan H, Morris H, Shatkin JA, Stintz M, Zepp R, Brouwer D. Potential release scenarios for carbon nanotubes used in composites. Environ Int. 2013;59:1–11. doi: 10.1016/j.envint.2013.04.003. [DOI] [PubMed] [Google Scholar]
- 10.Lee J, Mahendra S, Alvarez PJ. Nanomaterials in the construction Industry: A review of their applications and environmental health and safety considerations. ACS Nano. 2010;4:3580–3589. doi: 10.1021/nn100866w. [DOI] [PubMed] [Google Scholar]
- 11.Nowack B, Ranville JF, Diamond S, Gallego-Urrea JA, Metcalfe C, Rose J, Horne N, Koelmans AA, Klaine SJ. Potential scenarios for nanomaterial release and subsequent alteration in the environment. Environ Toxico Chem. 2012;31:50–59. doi: 10.1002/etc.726. [DOI] [PubMed] [Google Scholar]
- 12.Rabek JF. Polymer photodegradation – Mechanisms and experimental methods. Vol. 4. Chapman & Hall; New York: 1995. [Google Scholar]
- 13.Nel A, Xia T, Mädler L, Li N. Toxic potential of materials at the nanolevel. Science. 2006;311:622–627. doi: 10.1126/science.1114397. [DOI] [PubMed] [Google Scholar]
- 14.Poland C, Duffin R, Kinloch I, Maynard A, Wallace WAH, Seaton A, Stone V, Brown S, MacNee W, Donaldson K. Carbon nanotubes introduced into the abdominal cavity of mice show asbestos-like pathogenicity in a pilot study. Nat Nanotechnol. 2008;3:423–428. doi: 10.1038/nnano.2008.111. [DOI] [PubMed] [Google Scholar]
- 15.Maynard AD. Nanotechnology: Assessing the risks. Nano Today. 2006;2:22–33. [Google Scholar]
- 16.Aschberger K, Johnson HJ, Stone V, Aitken RJ, Hankin SM, Peters SA, Tran CL, Christensen FM. Review of carbon nanotubes toxicity and exposure – Appraisal of human health risk assessment based on open literature. Crit Rev Toxicol. 2010;40(9):759–790. doi: 10.3109/10408444.2010.506638. [DOI] [PubMed] [Google Scholar]
- 17.Handy RD, Henry TB, Scown TM, Johnston BD, Tyler CR. Manufactured nanoparticles: Their uptake and effects on fish-A mechanistic analysis. Ecotoxicology. 2008;17:396–409. doi: 10.1007/s10646-008-0205-1. [DOI] [PubMed] [Google Scholar]
- 18.Nguyen T, Wohlleben W, Sung L. Mechanisms of aging and release from weathered nanocomposites, in nanomaterials throughout their lifecycle: Human exposure, hazard, safety. Taylor & Francis; New York: 2014. pp. 315–334. [Google Scholar]
- 19.Wohlleben W, Vilar G, Fernandez-Rosas E, Gonzalez-Galvez D, Gabriel C, Hirth A, Frechen T, Stanley D, Gorham J, Sung L, Hsueh H-C, Chuang Y-F, Nguyen T, Vazquez-Campos S. A pilot interlaboratory comparison of protocols that simulate aging of nanocomposites and detect released fragments. Environ Chem. 2014;11(4):402–418. [Google Scholar]
- 20.Chin J, Byrd E, Embree N, Garver J, Dickens B, Finn T, Martin J. Accelerated UV weathering device based on integrating sphere technology. Rev Sci Instrum. 2004;75:4951–4959. [Google Scholar]
- 21.Sung L, Stanley D, Gorham JM, Rabb SA, Gu X, Yu LL, Nguyen T. A quantitative study of nanoparticle release from nanocoatings exposed to UV radiation. J Coat Technol Res. 2015;12(1):121–135. [Google Scholar]
- 22.Petersen E, Lam T, Gorham JM, Scott K, Long C, Stanley D, Sharma R, Liddle J, Pellegrin B, Nguyen T. Methods to assess the impact of UV irradiation on the surface chemistry and structure of multiwall carbon nanotube epoxy nanocomposites. Carbon. 2014;69:194–205. [Google Scholar]
- 23.Nguyen T, Pellegrin B, Bernard C, Gu X, Gorham JM, Stutzman P, Stanley D, Shapiro A, Byrd E, Hettenhouser R, Chin J. Fate of nanoparticles during life cycle of polymer nanocomposites. J Phys: Conf Ser. 2011;304:012060. [Google Scholar]
- 24.Gorham JM, Nguyen T, Bernard C, Stanley D, Holbrook RD. Photo-induced surface transformations of silica nanocomposites. Surf Interface Anal. 2012;44:1572–1581. [Google Scholar]
- 25.Nguyen T, Pellegrin B, Bernard C, Rabb S, Stuztman P, Gorham JM, Gu X, Yu LL, Chin J. Characterization of surface accumulation and release of nanosilica during irradiation of polymer nanocomposites by ultraviolet light. J Nanosci Nanotechnol. 2012;12:6202–6215. doi: 10.1166/jnn.2012.6442. [DOI] [PubMed] [Google Scholar]
- 26.Pittenger B, Erina N, Su C. Quantitative mechanical property mapping at the nanoscale with PeakForce QNM. Veeco Instruments Inc; 2010. AN128, A0. [Google Scholar]
- 27.Skoog DA, Holler FJ, Nieman TA, editors. Principles of Instrumental Analysis: 5th Edition. Brooks/Cole; United States: 1998. [Google Scholar]
- 28.Gu X, Chen G, Zhao M, Watson SS, Nguyen T, Chin JW, Martin JW. Critical role of particle/polymer interface in photostability of nano-filled polymeric coatings. J Coat Technol Res. 2012;9(6):251–267. [Google Scholar]
- 29.Watson SS, Forster AL, Tseng I, Sung L. Investigating pigment photoreactivity for coatings applications: Methods development. In: Martin J, Ryntz R, Chin J, Dickie R, editors. Service Life Prediction for Polymeric Materials: Global Perspectives. Springer Press; 2008. [Google Scholar]
- 30.Pang Y, Watson SS, Forster AM, Sung L. Mater Res Soc Symp Proc. 1224 Materials Research Society; 2010. Correlating nanoparticle dispersion to surface mechanical properties of TiO2/polymer composites. (1224-FF10-16). [Google Scholar]
- 31.Hu H, Zhang C, Han CC, Zhao J, Wei Y, Sung L, Gu X, Clerici C. Dispersion of particles in the coatings characterized by laser scanning confocal micrscopy (LSCM) I: Vertical dispersion of particles in the coatings and the weathering property studied by orthogonal analysis method of LSC. Sci China Ser E. 2010;53(8):2247–2251. [Google Scholar]
- 32.Krommenhoek PJ, Tracy JB. Magnetic field-directed self-assembly of magnetic nanoparticle chains in bulk polymers. Part Syst Charact. 2013;30:759–763. [Google Scholar]
- 33.Lemaire J, Siampiringue N. Prediction of coating lifetime based on FTIR microspectrophotometric analysis of chemical evolutions,” in “Service life prediction of organic coatings – A system approach”. In: Bauer D, Martin J, editors. Am Chem Soc Ser. Vol. 722. Oxford: 1999. pp. 246–256. [Google Scholar]
- 34.Vella D, Mahadevan L. The ‘Cheerios effect’. Am J Phys. 2005;73:817. [Google Scholar]
- 35.Harrick NJ. Internal reflection spectroscopy. 2nd. Harrick Scientific Corporation; Ossining, NY: 1979. pp. 30–31. [Google Scholar]