

Abstract
Background
Thoracic ultrasonography (TUS) is a specific and relatively sensitive method to diagnose bronchopneumonia (BP) in dairy calves. Unfortunately, as it requires specific training and equipment, veterinarians typically base their diagnosis on thoracic auscultation (AUSC), which is rapid and easy to perform.
Hypothesis/Objectives
We hypothesized that the use of TUS, in addition to AUSC, can significantly increase accuracy of BP diagnosis. Therefore, the objectives were to (i) determine the incremental value of TUS over AUSC for diagnosis of BP in preweaned dairy calves and (ii) assess diagnostic accuracy of AUSC.
Animals
Two hundred and nine dairy calves (<1 month of age) were enrolled in this cross‐sectional study.
Methods
Prospective cross‐sectional study. All calves from a veal calves unit were examined (independent operators) using the Wisconsin Calf Respiratory Scoring Criteria (CRSC), AUSC, and TUS. A Bayesian latent class approach was used to estimate the incremental value of AUSC over TUS (integrated discrimination improvement [IDI]) and the diagnostic accuracy of AUSC.
Results
Abnormal CRSC, AUSC, and TUS were recorded in 3.3, 53.1, and 23.9% of calves, respectively. AUSC was sensitive (72.9%; 95% Bayesian credible interval [BCI]: 50.1–96.4%), but not specific (53.3%; 95% BCI: 43.3–64.0%) to diagnose BP. Compared to AUSC, TUS was more specific (92.9%; 95% BCI: 86.5–97.1%), but had similar sensitivity (76.5%; 95% BCI: 60.2–88.8%). The incremental value of TUS over AUSC was high (IDI = 43.7%; 5% BCI: 22.0–63.0%) significantly improving proportions of sick and healthy calves appropriately classified.
Conclusions and Clinical Importance
The use of TUS over AUSC significantly improved accuracy of BP diagnosis in dairy calves.
Keywords: Bovine respiratory disease, Calf pneumonia, Diagnostic tests, Integrated discrimination improvement, Latent class model
Abbreviations
- AUSC
thoracic auscultation
- BCI
bayesian credible interval
- BP
bronchopneumonia
- COVN
covariance of auscultation and ultrasonography in calves without bronchopneumonia
- COVP
covariance of auscultation and ultrasonography in calves with bronchopneumonia
- CRSC
clinical respiratory scoring criteria
- IDI
integrated discrimination improvement
- Se
sensitivity
- Sp
specificity
- TUS
thoracic ultrasonography
Infectious bronchopneumonia (BP) in young calves is a major health problem in dairy and veal calf industries worldwide.1, 2 This disease represents the second most likely cause of morbidity after digestive diseases in preweaned dairy heifers (on average, 18.3% calves were treated for this condition).3 In addition, it is the leading cause of morbidity in veal calves, with an incidence of 0.95 cases per 1,000 calf days at risk.4
Accurate antemortem diagnosis of BP in dairy and veal calves remains challenging for both producers and veterinarians.5, 6 For producers, diagnosis of BP is typically based on visual signs of respiratory disease (anorexia, depression, nasal and ocular discharges, cough, and ear position), associated or not with increased rectal temperature. However, this diagnostic approach often lacks both sensitivity (Se) and specificity (Sp). Consequently, several clinical examination scores have been developed to improve its accuracy,1, 6 with moderate success.7 For veterinarians, diagnosis of BP is typically based on presence of visual signs of respiratory disease and abnormal lung sounds at thoracic auscultation (AUSC), including increased bronchial sounds, crackles, wheezes, or absence of respiratory sounds.8 Thoracic auscultation is rapid and easy to perform under field conditions, but abnormal lung sounds can also result from causes other than respiratory disease, which calls into question accuracy of AUSC for BP diagnosis.
Thoracic ultrasonography (TUS) is another test that can be used by veterinarians to diagnose BP. It detects signs of lung consolidation (eg, related to inflammation and exudate in lung parenchyma) adjacent to the pleura. It can be performed on‐farm and takes from 1 to 3 min per calf, depending on operator experience. In a recent study in preweaned dairy calves,7 TUS was specific (SpTUS: 93.9%; 95% Bayesian credible intervals [BCI]: 88.0–97.6%) and relatively sensitive (SeTUS: 79.4%; 95% BCI: 66.4–90.9%) for BP diagnosis. Unfortunately, TUS is not widely used by veterinarians because it requires specific training and equipment (ie, portable ultrasound apparatus). Furthermore, the incremental value of TUS in addition to AUSC for diagnosis of BP is unknown. Such information is crucial to assess and quantify potential improvement in diagnostic accuracy obtained by using TUS over AUSC versus AUSC only and thus determine whether TUS over AUSC should be promoted among veterinarians.
The challenge to quantify the incremental value of TUS over AUSC is that there is no perfect reference test for antemortem diagnosis of BRD. In the absence of a perfect reference test, Bayesian latent class analysis is considered one of the best methods to assess diagnostic test accuracy and is frequently used in human and veterinary medicine.9, 10, 11 This method assumes that the true disease status is unknown (latent) and needs to be estimated from the data. Furthermore, Bayesian analysis enables incorporation of prior scientific information on parameters to estimate.
The objectives of this study were to assess, using a Bayesian latent class approach, (i) incremental value of TUS over AUSC for BP diagnosis in preweaned dairy calves; and (ii) diagnostic accuracy of AUSC. We hypothesized that the use of TUS over AUSC significantly improves accuracy of BP diagnosis.
Materials and Methods
Study Design
All management and procedures were reviewed and approved by the Animal Ethical Care Committee, University of Montreal, Faculty of Veterinary Medicine (14‐Rech‐1727) and were in accordance with guidelines of the Canadian Council on Animal Care.
This study was conducted as a cross‐sectional study where all calves present in the facility were included. This design, also called “one‐gate,” is recommended for determining unbiased test accuracy parameters.12 Dairy veal calves (n = 209) were examined 12 days after arrival at a preweaning veal calf unit (average body weight on arrival = 48.1 kg, range = 33.1–65.3 kg). Each calf was examined for BP by 3 tests: a clinical evaluation using the Wisconsin Calf Respiratory Scoring Criteria (CRSC),1 AUSC, and TUS.7 Two investigators performed the CRSC test, 1 investigator performed AUSC (JM), and 2 trained investigators performed TUS (good inter‐observer agreements for TUS).13 All investigators were blinded to all other test results.
Data Collection
Clinical evaluation was performed using the CRSC as described,7 with a cut‐off of 5 or more defining a positive test.1 The AUSC was performed on the entire thoracic projection as described,8 using a conventional stethoscope.1 An abnormal AUSC was defined by presence of increased bronchial sounds or presence of abnormal sounds (ie, crackles and wheezes or total absence of lung sounds) or both. The TUS was performed using an ultrasound unit with a 7.5 MHz, linear‐array transducer.2 The thoracic area scanned was slightly modified from a previous study,8 as it also included the right lung field cranial to the heart (1st–2nd intercostal spaces), as described.14 An abnormal TUS was defined by the presence of any area of consolidated lung with a depth ≥1 cm (using the 1‐cm grid of the ultrasound apparatus; Fig 1).7
Figure 1.
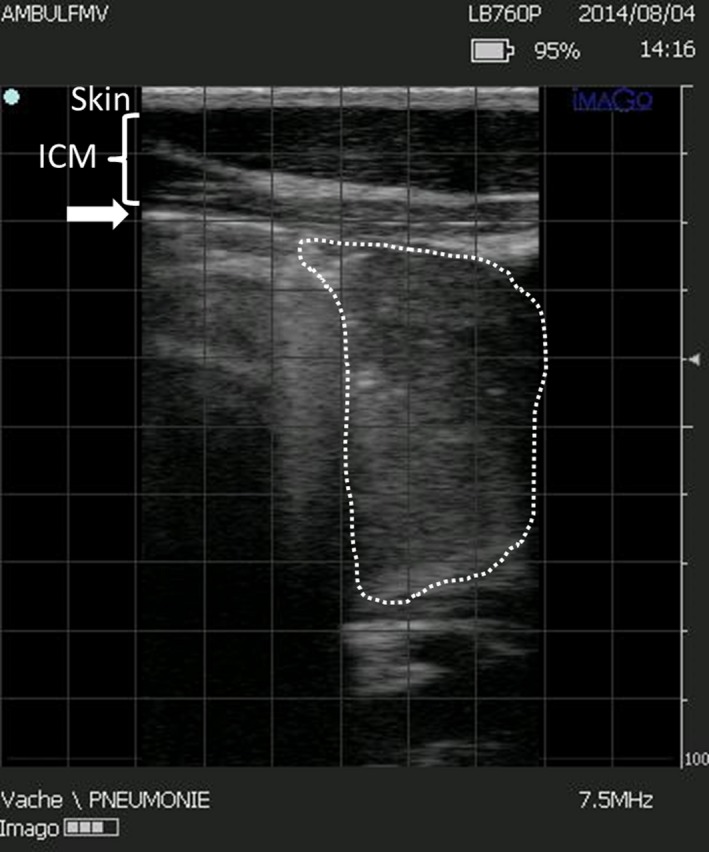
Ultrasound findings of lung consolidation in a preweaned Holstein calf (linear probe, 7.5 MHz). The skin, intercostal muscles (ICM), and pleural line (arrow) are observed. Consolidated lung parenchyma is outlined by the dotted line. The screen is divided by 1 cm grid (gray squares). The maximal depth of lung consolidation in this picture is 5–5.5 squares (cm).
Data Analysis
Descriptive results of each diagnostic test (CRSC, AUSC, and TUS) were reported in a contingency table. In the absence of a perfect reference test, diagnostic accuracy of AUSC (Se, Sp) and incremental value of TUS over AUSC were evaluated using a Bayesian framework.15 The accuracy of AUSC was assessed using a 1 population, 2 tests Bayesian latent class model analysis. The latent variable was true BP status, which was assessed by 2 imperfect tests, namely TUS and AUSC. Informative priors on TUS were based on a previous study7 and were reported in terms of beta distribution (Table 1). Best guesses for SeTUS and SpTUS were 79% (5th percentile value = 65%) and 94% (5th percentile value = 88%) corresponding to beta distributions β(27.02, 7.92) and β(80.58, 6.08), respectively. Noninformative priors (ie, objective) were used for SeAUSC and SpAUSC; uniform distribution, β(1,1). The prior used for BP prevalence (PBP) was a uniform distribution between 10 and 80% (low informative prior). Because both TUS and AUSC evaluate presence of abnormal lung parenchyma associated with BP, a positive conditional dependence between both tests was taken into account (COVP: covariance of both tests in calves with BP; and COVN: covariance of both tests in calves negative for BP).16, 17 Distribution of covariance parameters was defined as:16
| (1) |
| (2) |
Table 1.
Prior densities and median posterior estimates (95% Bayesian credibility interval [BCI]) of bronchopneumonia (BP) prevalence (P BP) and test sensitivity (Se) and specificity (Sp) of thoracic auscultation (TUS) and thoracic auscultation (AUSC) for BP diagnosis of 2 Bayesian latent class models
| Main Modela | Less Informative Modelb | |||
|---|---|---|---|---|
| Prior Densities | Posterior Estimatesc | Prior Densities | Posterior Estimates | |
| SeTUS | β(27.02,7.92) | 76.5 (60.2–88.8) | β(23.57,8.52) | 70.7 (52.8–85.1) |
| SpTUS | β(80.58,6.08) | 92.9 (86.5–97.1) | β(23.57,8.52) | 82.5 (75.3–89.8) |
| SeAUSC | β(1,1) | 72.9 (50.1–96.4) | β(1,1) | 69.0 (23.4–98.3) |
| SpAUSC | β(1,1) | 53.3 (43.3–64.0) | β(1,1) | 49.2 (39.2–60.7) |
| PBP | U(0.1,0.8) | 24.2 (13.5–37.3) | U(0.1,0.8) | 15.2 (10.2–30.0) |
| COVPd | U(0,a) | 6.0 (0.2–16.1) | U(0,a) | 5.7 (0.2–17.6) |
| COVNd | U(0,b) | 1.6 (0.0–4.9) | U(0,b) | 4.7 (0.6–8.8) |
| Sediff e | – | 4.2 (−24.2 to 26.0) | – | 2.0 (−33.4 to 47.0) |
| Spdiff f | – | 39.3 (28.0–50.0) | – | 33.2 (22.1–43.6) |
Main model: priors SeTUS mode = 79% (95% lower bound: 65%); priors SpTUS mode = 94% (95% lower bound: 88%); PBP: uniform distribution between 10 and 80%; noninformative priors for AUSC and covariance parameters.
Less informative model: priors SeTUS and SpTUS mode = 75% (95% lower bound 60%); PBP: uniform distribution between 10% and 80%; noninformative priors for AUSC and covariance parameters.
Posterior densities are indicated as percentages (95% Bayesian credible intervals).
COVP/COVN: covariance of the test for positive (p) or negative (n) BP cases; a = min(SeAUSC, SeTUS) − SeAUSC × SeTUS; b = min(SpAUSC, SpTUS) − SpAUSC × SpTUS.
Sediff = SeTUS − SeAUSC.
Spdiff = SpTUS − SpAUSC.
The incremental value of TUS over AUSC was evaluated using the same Bayesian latent class model,15 controlling for a conditional dependence between AUSC and TUS. This model determined the integrated discrimination improvement (IDI) of TUS over AUSC, an important measure to compare 2 nested models.18 The IDI represents the sum of the average increase in predicted probability among patients with the outcome and the average decrease in predicted probability among patients without the outcome.18 The IDI calculation was based on predictive values obtained from a model using both AUSC+TUS versus a model using only AUSC:
| (3) |
Therefore, IDI was the difference of discrimination slopes between these 2 models.
To assess model sensitivity to prior information on TUS accuracy, a second model using weaker priors for SeTUS and SpTUS was created (ie, less informative model). Both SeTUS and SpTUS were set at 75% in this model, with a 95% confidence that these parameters were >60% ie, β(23.57, 8.52). Priors for BP prevalence and covariance parameters were identical to the initial model (ie, main model).
Bayesian computations were implemented using public‐domain software.3 The first 5,000 iterations were discarded as burn‐in, whereas the next 95,000 were used to obtain posterior distributions. Convergences of models were assessed by (i) visual inspection of the history and density plots and (ii) Brooks‐Gelman‐Rubin statistic. Four chains were run with different initial values. Posterior distributions of each parameter were reported as medians and corresponding 95% BCI.
Results
Cross‐classifications of calves based on CRSC, AUSC, and TUS are shown (Table 2). Only 7 calves had a CRSC score ≥5 (3.3%). Abnormal AUSC was detected in 111 of 209 cases (53.1%) and ultrasonographic evidence of lung consolidation (≥1 cm depth) was detected in 50 of 209 calves (23.9%).
Table 2.
Cross‐classification of 209 preweaned dairy calves according to thoracic auscultation (AUSC), thoracic ultrasonography (TUS), and clinical evaluation findings using the Wisconsin Calf Respiratory Scoring Criteria (CRSC).1
| AUSC+a | AUSC− | Total | |
|---|---|---|---|
| TUS+b | |||
| CRSC+c | 7 | 0 | 7 |
| CRSC‐ | 33 | 10 | 43 |
| TUS− | |||
| CRSC+ | 0 | 0 | 0 |
| CRSC− | 71 | 88 | 159 |
| Total | 111 | 98 | 209 |
AUSC was defined as positive in the presence of increased bronchial sounds and/or in the presence of any abnormal sounds (eg, crackles, wheezes, or absence of lung sounds).
TUS was considered positive if lung consolidation depth was ≥1 cm at 1 or more sites.
CRSC was defined as positive if score was 5 or more.
Results of Bayesian latent class models are shown (Table 1). The SeAUSC and SpAUSC were 72.9% (95% BCI: 50.1–96.4%) and 53.3% (95% BCI: 43.3–64.0%), respectively, whereas SeTUS and SpTUS were 76.5% (95% BCI: 60.2–88.8%) and 92.9% (95% BCI: 86.5–97.1%; Fig 2). Thoracic ultrasonography was significantly more specific than AUSC for BP diagnosis (Spdiff: 39.3%; 95% BCI: 28.0–50.0%), but there was no difference in Se between TUS and AUSC (Sediff: 4.2%; 95% BCI: −24.2 to 26.0%; Table 1).
Figure 2.
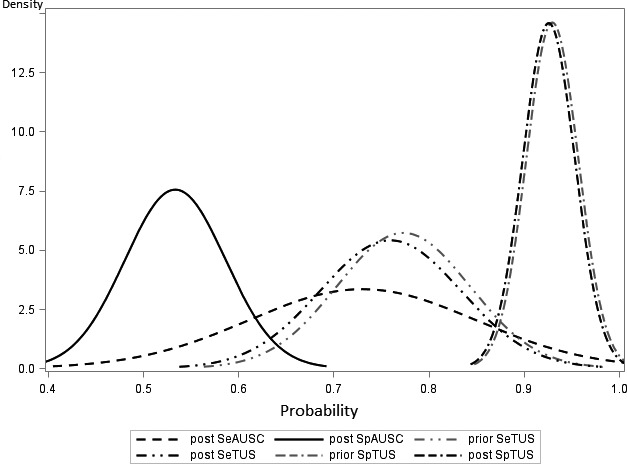
Prior and posterior densities for sensitivities (Se) and specificities (Sp) of thoracic auscultation (TUS) and thoracic auscultation (AUSC) for diagnosis of bronchopneumonia in preweaned dairy calves. The priors for auscultation sensitivity and specificity were noninformative priors (uniform density between 0 and 1).
The addition of TUS over AUSC significantly increased proportions of sick and healthy calves correctly classified (Table 3). The average increase in predicted probability among calves with BP was 33.0% (BCI: 16.1–47.8%) and the average decrease in predicted probability among calves without BP was 10.5% (BCI: 4.0–18.3%). Therefore, the overall estimate of the IDI was 43.7% (95% BCI: 22.0–63.0%). Changes in disease probability after AUSC only and after AUSC combined with TUS are shown (Fig 3). By adding TUS over AUSC, the probability of a calf to have BP increased from 33.2% (AUSC+ and no TUS performed) to 80.7% (if AUSC+ and TUS+).
Table 3.
Median posterior estimates and 95% Bayesian credibility interval (BCI) of integrated Discrimination Improvement (IDI) statistics for bronchopneumonia (BP) diagnosis when thoracic auscultation (AUSC) was interpreted alone or in combination with thoracic ultrasonography (TUS) in 2 Bayesian latent class models
| IDI in BP+ (95% BCI) | IDI in BP− (95% BCI) | IDI (95% BCI) | |
|---|---|---|---|
| Main modela | 33.0 (16.1–47.8) | 10.5 (4.0–18.3) | 43.7 (22.0–63.0) |
| Less informative modelb | 18.8 (5.2–36.3) | 3.3 (0.8–9.0) | 21.4 (6.2–43.1) |
aMain model: priors Sensitivity (Se)TUS mode = 79% (95% lower bound: 65%); priors Specificity (Sp)TUS mode = 94% (95% lower bound: 88%); PrevalenceBP: uniform distribution between 10 and 80%; noninformative priors for AUSC and covariance parameters. b: Less informative model: priors for Sensitivity (Se) and specificity of TUS mode = 75% (95% lower bound: 60%); Prevalence BP: uniform distribution between 10‐ 80%; non‐informative priors for AUSC and covariance parameters.
Figure 3.
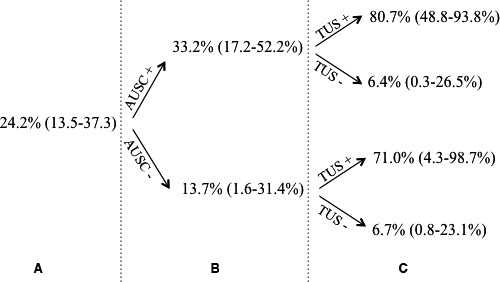
Probability of bronchopneumonia (A) in the present study population, (B) after thoracic auscultation alone (positive or negative; AUSC) and (C) after AUSC combined with thoracic ultrasonography (TUS). Probabilities were derived from Bayesian latent class models,15 including both AUSC and TUS or AUSC alone.
The model with less informative priors gave posterior medians included in the 95% BCI of the posteriors of the main model, except for SpTUS (Table 1). Therefore, prior information on TUS accuracy did not strongly influence posterior estimates of AUSC accuracy. Furthermore, the IDI using less informative priors remained high (21.4%, 95% BCI: 6.2–43.1%) demonstrating that even if TUS was less specific (82.5 versus 92.9%), its use over AUSC improved accuracy of BP diagnosis compared to AUSC alone.
Discussion
This study provides unique information on antemortem diagnosis of BP in dairy calves. Previous studies have compared AUSC and TUS findings in sheep19 or in chronic pneumonia cases in adult cows.20 We present here the incremental value of TUS over AUSC for BP diagnosis evaluated in preweaned dairy calves. Based on Bayesian latent class models, we showed that TUS was more specific (92.9%) than AUSC (53.3%) and that its use over AUSC significantly improved accuracy of BP diagnosis (IDI: 43.7%). Based on these findings, the use of TUS in addition to AUSC should be promoted among veterinarians to improve accuracy of BP diagnosis in preweaned dairy calves.
Precautions were taken in this study to avoid biases in estimating Se and Sp of diagnostic tests. First, investigators were blinded to other test results to avoid review bias. In nonblinded studies, animals with unexpected results can be retested, which can lead to overoptimistic Se and Sp estimates.21 Second, to avoid information bias, a latent class analysis was performed to account for the absence of a perfect reference test for antemortem BP diagnosis. If classification errors in the reference test are ignored, serious bias may be introduced in assessment of the accuracy of the new test.10 For example, in a case of a reference test with a Sp <100%, samples falsely detected as positive by this imperfect test might be correctly classified as negative by a more specific new test, thus leading to a biased estimate of Se (in this case, too low) of the new test. However, with the latent class approach used, the true disease status of animals was unknown (ie, latent) but was estimated from the data. Finally, the “one‐gate” design included healthy and sick calves at various stages of the disease, which prevented the spectrum of disease bias.12
The incremental value of a new test over a reference test is high when the new test is more Se or Sp (or both) than the reference test.15 It is therefore not surprising that the incremental value TUS over AUSC was high, as Sp of TUS was higher than AUSC. However, it is noteworthy that IDI can change with disease prevalence.15 In this study, IDI of TUS over AUSC was especially high because prevalence of BP was low (ie, higher chance of false positive) and TUS was more Sp than AUSC. However, if BP prevalence was higher, the incremental value of TUS over AUSC would have probably been reduced (as Se of TUS and AUSC did not differ).
The Se of AUSC in this study was higher than anticipated. In a previous study with dairy calves, the Se of lung auscultation to diagnose BP (defined as lung consolidation ≥1 cm detected by ultrasonography) was only 5.9% (range, 0–16.7%).8 This apparent discrepancy was attributed to bronchial sounds being included in lung sounds interpretation in the present study, whereas in the previous study, only crackles, wheezes, or absence of respiratory sounds were interpreted as abnormal. Increased bronchial sounds are usually the first and most common abnormal lung sound that occurs in animals with respiratory disease, which accounts for its high Se to diagnose BP.22, 23
Unfortunately, interpretation of increased bronchial sounds suffers from a lack of Sp, as illustrated by the present study. Increased bronchial sounds typically result from areas of consolidation or atelectasis that increase sound transmission though lung tissue (ie, increased tissue density).23 However, they can also result from causes other than respiratory disease, including exercise, anxiety, fever, anemia, and high ambient temperatures that increase velocity of air flow (ie, hyperventilation). Increased bronchial sounds should therefore be interpreted with caution, and preferably in calves that have visual signs of BP, to improve its positive predictive value (ie, proportion of animals with increased bronchial sounds that truly have BP). It is noteworthy that interpretation of bronchial sounds is also very subjective in humans, with a low to fair interobserver agreement.24 This emphasizes the advantage of using more objective measurements such as TUS that have good interobserver agreement (ie, reproducibility).
Thoracic auscultation could nevertheless be an improvement over the use of a clinical examination score alone. In the present study, AUSC detected 33 calves that had lung consolidation at TUS, but were negative when examined by clinical examination using the Wisconsin CRSC scoring system. Unfortunately, determination of the incremental value of AUSC over CRSC was not possible, because of (i) low prevalence of abnormal CRSC and (ii) 2 scorers, which could have introduced a bias in score attribution (low interobserver agreement and thus nonconstant accuracy of CRSC between observers).25
In conclusion, AUSC was sensitive (72.9%), but not specific (53.3%) to diagnose BP. Adding TUS over AUSC significantly improved the accuracy of BP diagnosis and therefore should be promoted among veterinarians (especially in context of low BP prevalence to confirm presence of lung consolidation).
Acknowledgments
We gratefully acknowledge Dr John Kastelic for editing the manuscript. The authors also acknowledge Julie Berman, DMV for performing part of the ultrasonographic examination with SB and Louis Bonneville, SEC Repro, Ange‐Gardien, Québec, Canada, who provided the ultrasound equipment.
Conflict of Interest Declaration: Authors declare no conflict of interest.
Off‐label Antimicrobial Declaration: Authors declare no off‐label use of antimicrobials.
This project was conducted in Québec, Canada. It was an addendum to a larger project funded by Merck Animal Health. This paper has not been previously presented.
Footnotes
3M Littmann Cardiology, Littman Canada, Concord, ON, Canada
Imago, Echo Control Medical, Angoulême, France
WinBUGS version 1.4.3, MRC Biostatistics Unit, Cambridge, UK.
References
- 1. McGuirk SM. Disease management of dairy calves and heifers. Vet Clin North Am Food Anim Pract 2008;24:139–153. [DOI] [PMC free article] [PubMed] [Google Scholar]
- 2. Pardon B, De Bleecker K, Hostens M, et al. Longitudinal study on morbidity and mortality in white veal calves in Belgium. BMC Vet Res 2012;8:26. [DOI] [PMC free article] [PubMed] [Google Scholar]
- 3. USDA‐APHIS . Dairy Heifer Raiser 2011, An overview of operations that specialize in raising dairy heifers; 2011, 164pp. https://www.aphis.usda.gov/animal_health/nahms/dairy/downloads/dairyheifer11/HeiferRaiser.pdf
- 4. Pardon B, De Bleecker K, Dewulf J, et al. Prevalence of respiratory pathogens in diseased, non‐vaccinated, routinely medicated veal calves. Vet Rec 2011;169:278. [DOI] [PubMed] [Google Scholar]
- 5. Leruste H, Brscic M, Heutinck LF, et al. The relationship between clinical signs of respiratory system disorders and lung lesions at slaughter in veal calves. Prev Vet Med 2012;105:93–100. [DOI] [PubMed] [Google Scholar]
- 6. Love WJ, Lehenbauer TW, Kass PH, et al. Development of a novel clinical scoring system for on‐farm diagnosis of bovine respiratory disease in pre‐weaned dairy calves. PeerJ 2014;2:e238. [DOI] [PMC free article] [PubMed] [Google Scholar]
- 7. Buczinski S, Ollivett TL, Dendukuri N. Bayesian estimation of the accuracy of the calf respiratory scoring chart and ultrasonography for the diagnosis of bovine respiratory disease in pre‐weaned dairy calves. Prev Vet Med 2015;119:227–231. [DOI] [PubMed] [Google Scholar]
- 8. Buczinski S, Forté G, Francoz D, et al. Comparison of thoracic auscultation, clinical score, and ultrasonography as indicators of bovine respiratory disease in preweaned dairy calves. J Vet Intern Med 2014;28:234–242. [DOI] [PMC free article] [PubMed] [Google Scholar]
- 9. van Smeden M, Naaktgeboren CA, Reitsma JB, et al. Latent class models in diagnostic studies when there is no reference standard—A systematic review. Am J Epidemiol 2014;179:423–431. [DOI] [PubMed] [Google Scholar]
- 10. Enoe C, Georgiadis MP, Johnson WO. Estimation of sensitivity and specificity of diagnostic tests and disease prevalence when the true disease state is unknown. Prev Vet Med 2000;45:61–81. [DOI] [PubMed] [Google Scholar]
- 11. Mang AV, Buczinski S, Booker CW, et al. Evaluation of a computer‐aided lung Auscultation system for diagnosis of bovine respiratory disease in feedlot cattle. J Vet Intern Med 2015;29:1112–1116. [DOI] [PMC free article] [PubMed] [Google Scholar]
- 12. Rutjes AW, Reitsma JB, Vandenbroucke JP, et al. Case–control and two‐gate designs in diagnostic accuracy studies. Clin Chem 2005;51:1335–1341. [DOI] [PubMed] [Google Scholar]
- 13. Buczinski S, Forté G, Bélanger AM. Short communication: Ultrasonographic assessment of the thorax as a fast technique to assess pulmonary lesions in dairy calves with bovine respiratory disease. J Dairy Sci 2013;96:4523–4528. [DOI] [PubMed] [Google Scholar]
- 14. Ollivett TL, Caswell JL, Nydam DV, et al. Thoracic ultrasonography and bronchoalveolar lavage fluid analysis in Holstein calves with subclinical lung lesions. J Vet Intern Med 2015;29:1728–1734. [DOI] [PMC free article] [PubMed] [Google Scholar]
- 15. Ling DI, Pai M, Schiller I, et al. A Bayesian framework for estimating the incremental value of a diagnostic test in the absence of a gold standard. BMC Med Res Methodol 2014;14:67. [DOI] [PMC free article] [PubMed] [Google Scholar]
- 16. Dendukuri N, Joseph L. Bayesian approaches to modeling the conditional dependence between multiple diagnostic tests. Biometrics 2001;57:158–167. [DOI] [PubMed] [Google Scholar]
- 17. Toft N, Jorgensen E, Hojsgaard S. Diagnosing diagnostic tests: Evaluating the assumptions underlying the estimation of sensitivity and specificity in the absence of a gold standard. Prev Vet Med 2005;68:19–33. [DOI] [PubMed] [Google Scholar]
- 18. Pencina MJ, D'Agostino RB Sr, D'Agostino RB Jr, et al. Evaluating the added predictive ability of a new marker: From area under the ROC curve to reclassification and beyond. Stat Med 2008;27:157–172. [DOI] [PubMed] [Google Scholar]
- 19. Scott PR, Collie D, McGorum B, et al. Relationship between thoracic auscultation and lung pathology detected by ultrasonography in sheep. Vet J 2010;186:53–57. [DOI] [PubMed] [Google Scholar]
- 20. Scott PR. Clinical presentation, auscultation recordings, ultrasonographic findings and treatment response of 12 adult cattle with chronic suppurative pneumonia: Case study. Ir Vet J 2013;66:5. [DOI] [PMC free article] [PubMed] [Google Scholar]
- 21. Greiner M, Gardner IA. Epidemiologic issues in the validation of veterinary diagnostic tests. Prev Vet Med 2000;45:3–22. [DOI] [PubMed] [Google Scholar]
- 22. Radostits OM, Mayhew IG, Houston DM, et al. Veterinary Clinical Examination and Diagnosis. Elsevier, WB Saunders: London; 2000. [Google Scholar]
- 23. Curtis RA, Viel L, McGuirk SM, et al. Lung sounds in cattle, horses, sheep and goats. Can Vet J 1986;27:170–172. [PMC free article] [PubMed] [Google Scholar]
- 24. Brooks D, Thomas J. Interrater reliability of auscultation of breath sounds among physical therapists. Phys Ther 1995;75:1082–1088. [DOI] [PubMed] [Google Scholar]
- 25. Buczinski S, Faure C, Jolivet S, et al. Evaluation of inter‐observer agreement when using a clinical respiratory scoring system in pre‐weaned dairy calves. N Z Vet J 2016;64:243–247. [DOI] [PubMed] [Google Scholar]