Abstract
In peripheral quantitative computed tomography scans of the calf muscles, segmentation of muscles from subcutaneous fat is challenged by muscle fat infiltration. Threshold-based edge detection segmentation by manufacturer software fails when muscle boundaries are not smooth. This study compared the test-retest precision error for muscle-fat segmentation using the threshold-based edge detection method vs manual segmentation guided by the watershed algorithm. Three clinical populations were investigated: younger adults, older adults, and adults with spinal cord injury (SCI). The watershed segmentation method yielded lower precision error (1.18%–2.01%) and higher (p < 0.001) muscle density values (70.2 ± 9.2 mg/cm3) compared with threshold-based edge detection segmentation (1.77%–4.06% error, 67.4 ± 10.3 mg/cm3). This was particularly true for adults with SCI (precision error improved by 1.56% and 2.64% for muscle area and density, respectively). However, both methods still provided acceptable precision with error well under 5%. Bland-Altman analyses showed that the major discrepancies between the segmentation methods were found mostly among participants with SCI where more muscle fat infiltration was present. When examining a population where fatty infiltration into muscle is expected, the watershed algorithm is recommended for muscle density and area measurement to enable the detection of smaller change effect sizes.
Keywords: Muscle cross-sectional area, muscle density, pQCT, precision, watershed algorithm
Introduction
Muscle atrophy and fatty infiltration of muscle have been linked to secondary health complications, including type II diabetes (1,2), frailty (3), and falls (4). Emerging research studies have highlighted the link between elevated muscle adipose tissue in the leg, and both decreased insulin sensitivity and impaired glucose metabolism (5,6). Impaired strength and composition in these leg muscle groups can lead to deterioration in physical function (7,8) and loss of loading on bone (9,10).
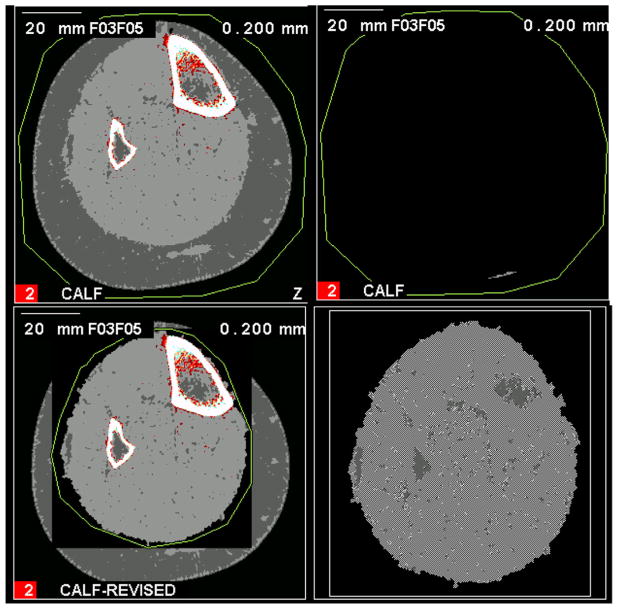
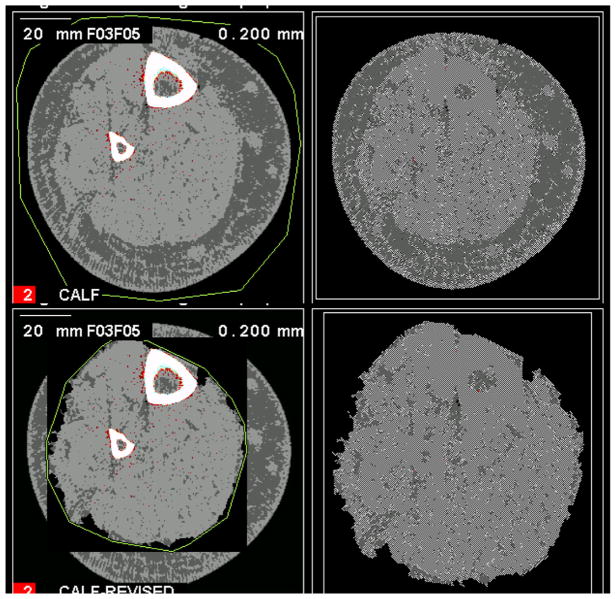
Muscle density (MD) measured using peripheral quantitative computed tomography (pQCT) has been used as a surrogate of muscle adiposity (11). In individuals with a larger amount of fat within (intramuscular fat) and between (inter-muscular fat) muscle groups, MD values are small. Both muscle cross-sectional area (MCSA) and MD can be computed with the manufacturer Stratec software (Orthometrix Inc., White Plains, NY) using a linear attenuation threshold-guided edge detection algorithm. Accurate representation of these features depends on precise delineation of the muscle-subcutaneous fat boundary, which can be guided by the fascia line enveloping the leg muscles (12). In some cases, this boundary is not apparent and in more extreme cases, it is obscured by fatty infiltration into muscle. Such is the case among individuals who have diabetes (1,2,13,14), among individuals with spinal cord injury (SCI) (15), or with aging (2). The edge detection step assumes that muscle has a smooth circular boundary. When interruptions are found, the algorithm fails to segment the muscle and results in no segmentation (both subcutaneous fat and muscle is included in a mask) or segmentation of a small area within 1 cm2 (Figs. 1 and 2, top right).
Fig. 1.
Failed edge detection with small segmentation. An example of a calf muscle with mild fatty infiltration that failed automated threshold-based segmentation (top left) resulting in a small island of segmented area (top right). To fix this on the Stratec software a manual boundary is drawn around the muscle region (bottom left) to generate a corrected muscle area (bottom right).
Fig. 2.
Failed edge detection with no segmentation. An example of a calf muscle with more advanced fatty infiltration that failed automated threshold-based segmentation (top left) resulting in no segmentation (top right). To fix this on the Stratec software a manual boundary is drawn around the muscle region (bottom left) to generate a corrected muscle area (bottom right).
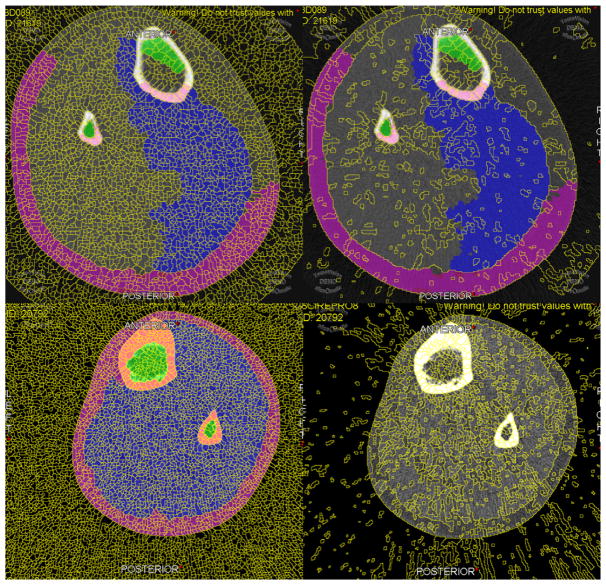
For milder infiltration, a stronger filter could smooth the muscle (7), and a manual trace around the muscle could assist the edge detection algorithm in segmentation (Figs. 1 and 2, bottom left). However, using a stronger filter still results in failed segmentation for cases with extensive fatty infiltration. Poorer quality muscle could be segmented using a watershed algorithm (Fig. 3). Although this technique requires more manual intervention, there is more control in delineating muscle from surrounding fat. The watershed algorithm is based on topographical transformations of higher (peaks) and lower (valley) intensity signals (16). By virtue of this topographic representation, water could be “poured” into purported pools. Where large signal contrasts are located, pools of water will be restricted. To date, this algorithm has only been applied to magnetic resonance imaging muscle scans (12,17), but the precision of the technique in different cohorts has yet to be demonstrated using pQCT images.
Fig. 3.
Example of watershed pools on normal and fatty muscle. Watershed lines were set at 5 pixel surface and 0.20% mean difference (left column) or 25 pixel surface and 1.00% mean difference (right column) to generate denser and sparser pools, respectively. Pixel surface indicates the size of each pool in pixels, and the percentage mean difference sets a lower limit to the amount of variability expected between pools before they are merged into a larger pool. Sparser watershed lines enabled faster segmentation for healthier muscles (top row), whereas fattier muscles required denser watershed lines (bottom row).
The present study reported precision errors achieved using threshold-based edge detection versus the watershed method for assessing MD and MCSA. To ensure the robustness of the techniques, 3 cohorts exhibiting varying degrees of muscle fat infiltration were evaluated. It is hypothesized that compared with threshold-based edge detection, the watershed algorithm provides superior precision for computing MD and MCSA in pQCT leg muscle scans for those with more fatty infiltration. However, in those with lower fatty infiltration, the watershed algorithm does not improve precision over threshold-based segmentation.
Methods
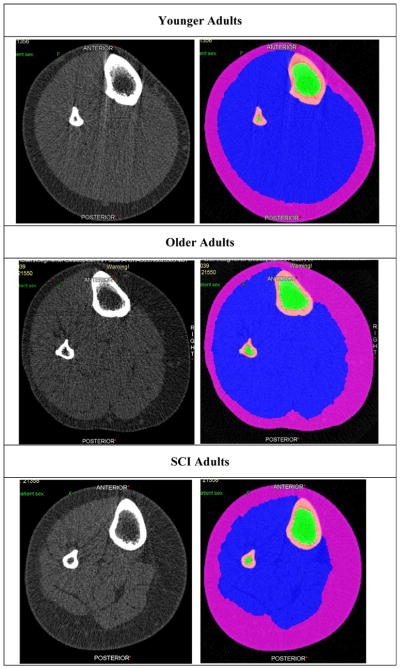
Younger adults (18–30 yr old), older adults (60 yr and older), and adults (18–45 yr old) with complete or incomplete (American Spinal Injury Association Impairment Scale classes A, B, or C) SCI for more than 6 mo were recruited to the study. The rationale for including the 3 groups was to represent the precision across a large range of potential muscle densities (Fig. 4). Younger adults were a convenience sample of local community participants. Older adults were a random sample of women from the Hamilton chapter of the Canadian Multicentre Osteoporosis Study. Individuals with SCI were recruited from local physiatrists’ clinics. Exclusion criteria included bilateral metal implants or prior fracture of the tibia, contractures limiting knee and ankle range of motion bilaterally, or metabolic bone diseases known to affect bone density and structure (Paget’s disease, osteogenesis imperfecta, hyperthyroidism, hyperparathyroidism, renal bone disease, chronic liver disease, and hypogonadism).
Fig. 4.
Illustration of fatty infiltration across cohorts. Peripheral quantitative computed tomography images illustrating the amount of fatty infiltration into calf muscles in spinal cord injury (SCI) adults compared with younger and older normal adults. For each pair of images—left = native computed tomography scan; right = segmentation of tissues using watershed algorithm. Magenta = subcutaneous fat; blue = muscle; green = bone marrow; and pink = bone.
pQCT Scans
Using a model XCT2000 pQCT scanner (Stratec; Orthometrix Inc., White Plains, NY), a single 2.3 ± 0.5 mm thick slice acquired with computed tomography scan speed of 15 mm/s, 38 kVp X-ray beam energy, and matrix size of 256 × 256 providing 500 μm in-plane resolution was obtained from the 66% site of the tibia, as measured from the distal end of the medial malleolus toward the proximal end of the medial tibial plateau. The right tibia was measured except in the case of severe spasticity or other contraindications. After the first scan was complete, the leg was removed from the scanner. The process of measuring leg length, repositioning the leg, and scan acquisition was repeated.
Calf Muscle Segmentation
All images were randomized and blinded to the reader. Those with significant motion artifact as identified by a discontinuous cortical bone border were excluded from analyses.
Threshold-Based Edge Detection
Automatic threshold-based iterative edge detection-guided segmentation of muscle from bone was performed using a density threshold of 280 mg/cm3 with contour mode 1 and peel mode 2 (bone area and mass). Segmentation of muscle from subcutaneous fat followed a threshold of 40 mg/cm3 with contour mode 3 and peel mode 1 (total muscle + bone area and mass). A segmentation was considered a failure if there were areas of muscle that were not segmented on visual inspection. If this first-step segmentation failed, a contour was drawn manually within the subcutaneous fat just outside the muscle, and a second-step segmentation was run (Figs. 1 and 2). Otherwise, cases that continued to fail the second step were labeled as undefined. A crosstab of first- and second-step failures was recorded. All threshold-based segmentations were performed using Stratec Analysis software, version 6.0 (Orthometrix Inc., White Plains, NY). To determine MCSA, bone area was subtracted from total bone + muscle area. Similarly, bone mass was subtracted from total bone + muscle mass to derive muscle mass. MD was computed by dividing total muscle mass by MCSA. Because scans were not routinely performed with an air-water-bone phantom, Hounsfield unit calibration was not available. To better express meaningful values, units were retained in milligrams per cubic centimeter based on a calibration using a hydroxyapatite-equivalent European forearm phantom. For reference, the linear attenuation coefficient could be back calculated using the following equation: linear attenuation coefficient = ([MD + 322.06]/1724.41).
Watershed Algorithm-Guided Manual Segmentation
Alternatively, muscle-subcutaneous fat boundary identification was guided by the watershed algorithm available from sliceOmatic software package, version 4.3 (Tomovision, Magog, Quebec, Canada). Muscle bone, and subcutaneous fat areas were manually traced by a single reader (SS). Briefly, a fine watershed gradient was selected, generating a series of small watershed pools representing groupings of pixels within the image that were filled by a single click (Fig. 3). By dragging across pools with a selected paintbrush color, each of subcutaneous fat, muscle, cortical bone, and bone marrow were differentially labeled. Each tagged tissue was saved as a mask for density, mass, and area computations. All values were reported as calibrated density values in milligrams per cubic centimeter and areas in square millimeter.
For a subset of 10 participants’ calf scans, images were segmented using the watershed algorithm by a second rater (CM) to obtain inter-rater reliability estimates.
Data Analyses
Root mean square coefficients of variation (RMSCV) and root mean square standard deviations (RMSSD) along with short-term least significant change were calculated for MD and MCSA derived from repeated pQCT scans according to the method by Gluer et al (18); precision for each subgroup (i.e., young, older, and SCI adults) were presented. Inter-rater reliability for MD and MCSA measures derived from the watershed algorithm was also determined using RMSCV and RMSSD measures. Bland-Altman plots and limits of agreement (LOA) were computed for MD and MCSA for test-retests within the same segmentation method and the first image acquisition between the 2 segmentation methods. A general linear model determined difference in MD and MCSA between segmentation methods adjusting for participant group (SCI adults, younger adults, older adults). All statistical analyses were performed by SAS version 9.1.3 SP4 (SAS Institute, Cary, NC) and evaluated at the 95% confidence level.
Results
A total of 86 participants were recruited and successfully completed the study (Table 1). A larger proportion of participants with SCI were men, and a larger proportion of the younger adults were women. Mean body mass index was within a normal range for all 3 cohorts. On visual inspection, those with SCI had noticeable infiltration of fat into muscle groups—although the degree to which this occurred for each individual varied within this cohort (Figs. 1 and 2). A total of 35 of 172 (20.3%) images failed step 1 segmentation using the threshold-based edge detection method—of these, 11 (31.4%) failed step 2. All images segmented with the watershed algorithm successfully segmented the entire muscle area on visual inspection.
Table 1.
Participant Characteristics
| Characteristics | Younger adults | Older adults | Adults with SCI |
|---|---|---|---|
| N (women/men) | 19 (12/7) | 50 (50/0) | 17 (5/12) |
| Age (yr) | 26.1 ± 3.1 | 74.0 ± 9.2 | 42.9 ± 10.1 |
| BMI (kg/m2) | 23.5 ± 4.7 | 25.7 ± 4.0 | 23.9 ± 3.3 |
| MD (mg/cm3)—TB | 73.28 ± 3.61 | 70.13 ± 3.86 | 49.43 ± 13.37 |
| MD (mg/cm3)—WS | 75.54 ± 3.16 | 71.67 ± 4.33 | 60.04 ± 15.12 |
| MCSA (mm2)—TB | 7273.50 ± 1817.20 | 5754.28 ± 896.01 | 5056.21 ± 1593.02 |
| MCSA (mm2)—WS | 7198.62 ± 1419.97 | 5985.91 ± 880.98 | 4029.89 ± 1351.69 |
Note: Study participant characteristics according to group.
Abbr: BMI, body mass index; MCSA, muscle cross-sectional area; MD, muscle density; SCI, spinal cord injury; TB, threshold-based segmentation method; WS, watershed-guided manual segmentation method.
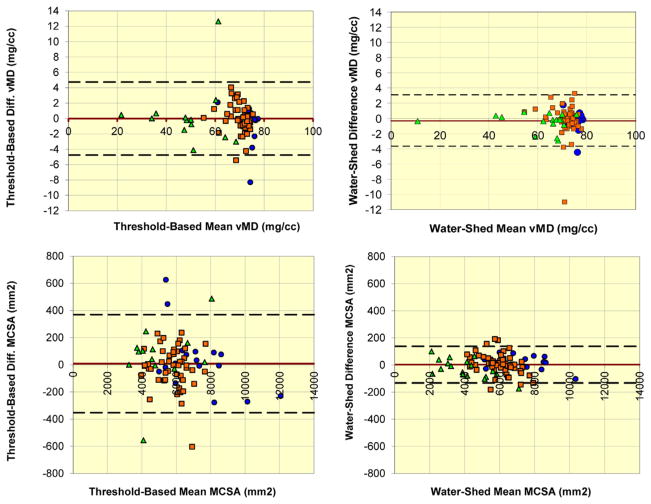
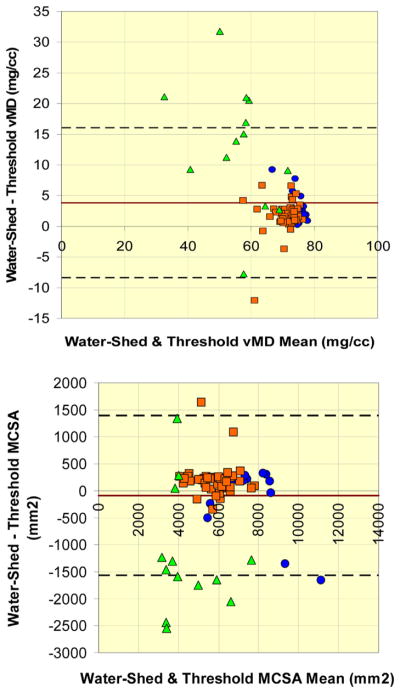
Most test-retest RMSCV and RMSSD values for threshold-based edge detection segmentations were larger than watershed-guided manual segmentations across the 3 cohorts for both MCSA and MD (Table 2). The same patterns were reflected in the short-term least significant change values (Table 3). Inter-rater reliability for MCSA (RMSCV: 3.24%, RMSSD: 159 mm2) and MD (RMSCV: 3.88%, RMSSD: 2.62 mg/cm3) was well within 5% error. The LOA for MD obtained using the watershed algorithm was −3.68 to 3.09 mg/cm3 (N = 85); versus on threshold-based segmentation, −4.75 to 4.75 mg/cm3 (N = 81). The LOA for MCSA was −132.80 to 137.50 mm2 (N = 85) and −353.19 to 369.28 mm2 (N = 81) for watershed versus threshold-based segmentation, respectively (Fig. 5). Watershed-guided manual segmentation (70.2 ± 9.2 mg/cm3) provided larger (p < 0.001) densities compared with threshold-based segmentation (67.4 ± 10.3 mg/cm3) overall (Table 2). However, the higher density value for watershed-guided segmentation was most apparent for the participants with SCI, with a mean discrepancy of 10.61 mg/cm3 (p < 0.001). Correspondingly, the MCSA obtained from watershed-guided segmentations was smaller than for threshold-based segmentations within the participants with SCI (p < 0.001) (Fig. 6).
Table 2.
Precision Error for Test-Retest Imaging Compared Between Methods
| Reliability data
|
RMSSD (units)
|
RMSCV (% error)
|
||||
|---|---|---|---|---|---|---|
| Variable and method | Young | Older | SCI | Young | Older | SCI |
| Watershed MD (mg/cm3) | 0.89 | 1.43 | 0.85 | 1.18 | 2.01 | 1.42 |
| Threshold-based MD (mg/cm3) | 1.73 | 1.22 | 2.43 | 2.36 | 1.77 | 4.06 |
| Watershed MCSA (mm2) | 34.96 | 53.97 | 52.34 | 0.49 | 0.93 | 1.38 |
| Threshold-based MCSA (mm2) | 154.35 | 105.37 | 142.10 | 2.57 | 1.77 | 2.94 |
Note: Comparing reliability of peripheral quantitative computed tomography muscle measures obtained by watershed vs threshold-based edge detection segmentation separated by participant subgroups.
Abbr: MCSA, muscle cross-sectional area; MD, muscle density; RMSCV, root mean square coefficients of variation; RMSSD, root mean square standard deviation; SCI, spinal cord injury.
Table 3.
LSC for Muscle Outcomes
| Reliability data
|
LSC
|
||
|---|---|---|---|
| Variable and method | Young | Older | SCI |
| Watershed MD (mg/cm3) | 2.47 | 3.96 | 2.36 |
| Threshold-based MD (mg/cm3) | 4.80 | 3.38 | 6.74 |
| Watershed MCSA (mm2) | 96.90 | 149.60 | 145.08 |
| Threshold-based MCSA (mm2) | 427.84 | 292.07 | 393.88 |
Note: Short-term LSC compared between watershed and threshold-based edge detection methods for segmenting muscle from surrounding fat and bone.
Abbr: LSC, least significant change; MCSA, muscle cross-sectional area; MD, muscle density; SCI, spinal cord injury.
Fig. 5.
Test-retest discrepancies within each method. Bland-Altman plots of test-retest differences for MD (top row) and MCSA (bottom row) within each of threshold-based segmentation (left column) and watershed algorithm-guided manual segmentation (right column). Green triangles = spinal cord injury adults, orange squares = older adults, and blue circles = younger adults. Upper and lower dashed lines indicate Bland-Altman 95% limits of agreement. Red line indicates mean of differences between test and retest values. MCSA, muscle cross-sectional area; MD, muscle density. (For interpretation of references to color in this figure legend, the reader is referred to the web version of this article.)
Fig. 6.
Analyze-reanalyze discrepancies between methods. Bland-Altman plots of differences between watershed algorithm-guided manual segmentation and threshold-based segmentation for (top) MD and (bottom) MCSA. Green triangles = spinal cord injury adults, orange squares = older adults, and blue circles = younger adults. Upper and lower dashed lines indicate Bland-Altman 95% limits of agreement. Red line indicates mean of differences between test and retest values. MCSA, muscle cross-sectional area; MD, muscle density. (For interpretation of references to color in this figure legend, the reader is referred to the web version of this article.)
No differential mean value-dependent patterns in precision were observed between test and retest scans for MCSA and MD values. Between threshold-based edge detection and watershed-guided segmentation methods, the discrepancies appeared to be larger for smaller MD values and were particularly evident for scans from participants with SCI. Intermethod discrepancies in MCSA appeared to be present across the range of MCSA values with discrepancies found more frequently at lower MCSA values for those with SCI, midrange values for older adults, and higher MCSA values for younger adults (Fig. 6).
Discussion
Summary of Results
The watershed-guided manual segmentation method resulted in superior precision compared with the threshold-based segmentation method overall but particularly for those with SCI. Notably, MD values obtained by the watershed method were larger and MCSA smaller than computations derived from the threshold-based edge detection method. Bland-Altman analyses did not suggest that the watershed or threshold-based edge detection methods performed well only with certain values or groups. Despite the variability in muscle quality, both methods were able to yield precision error values for MCSA and MD well below 5% across all 3 cohorts. A substantial number of scans from individuals with SCI could not be segmented using the threshold-based method.
Factors Affecting Precision of pQCT-Derived Muscle Measurements
Our estimates of RMSCV for MD and MCSA in 3 clinical populations were within acceptable limits and similar to those reported previously. In a study of the lower extremities in men and women by Burrows et al (19), the RMSCV for MCSA was 2.4% and even between 2 models of pQCT (XCT2000 and XCT3000) remained at 2.1%. Szabo et al (20) saw even lower precision error for leg MCSA in a cohort of postmenopausal women (0.6%), but neither Szabo nor Burrow’s studies quantified MD. Swinford and Warden (21) further demonstrated that short-term precision error for leg MCSA (1.4%) and MD (0.6%) was both lower than subcutaneous fat segmentation error (2.8%) but higher than precision errors for volumetric bone density estimates (0.3%). Precision error was larger when 66% leg measurements were performed 1 wk apart vs on the same day; and precision error was larger for those with higher body mass index. We have demonstrated that precision varies with clinical population. The larger interscan discrepancies found within older adults for watershed segmentation could be explained by slightly more motion artifact observed in this group compared with younger adults. Although more severe motion artifacts have been excluded during quality assurance, the remaining scans bearing some motion still generates minor streaks of higher signal intensity within the muscle. Muscle smoothing filters (i.e., F03F05) (7) can average the local signal, reducing the contribution of these streaks, but this correction remains imperfect. Despite minor differences in precision across groups, all RMSCV values were within a benchmark of 5%, suggesting reliable application for longitudinal studies.
Comparison Between Segmentation Algorithms
Problematic scans exhibit a ruffled border between the subcutaneous fat and muscle. The subcutaneous fat contains a larger amount of embedded high-intensity pixels (lighter gray specs) (Figs. 1 and 2). Both these features cause edge detection to fail. The threshold-based edge detection and concentric peeling steps were designed for segmenting bone where ruffled borders and noncircular geometry are not to be encountered. To overcome the ruffled fat-muscle border, a stronger filter can be applied (i.e., F03F05F05), but ultimately, one must manually attempt to exclude the ruffled geometry and provide a smoother trace just exterior to the muscle. This step introduces error despite the software still automatically reidentifying the border after thresholding. Although not completely manual, the watershed algorithm was still able to achieve lower precision error values, and no scans failed to segment. The watershed pools limit variability in pixels selected along the fat-muscle border. However, when muscle-fat borders are more ruffled, the definition of the border may be poor leading to potential for oversegmentation. A smoothing filter to the image can be applied to round these borders, but in more extreme cases, this method may otherwise fail. Similarity metrics can be applied to merge adjacent regions sharing similar texture, intensity, and size (22). However, the result of a segmentation after such an attempt at smoothing the border may not necessarily reflect what is truly considered muscle versus fat. Currently, there is no algorithm to apply fusion by similarity metrics in conjunction with the watershed method.
We have demonstrated that MD computed using the watershed algorithm was larger than those obtained using the threshold-based segmentation method (Table 1), suggesting that more subcutaneous or intermuscular fat was included within the segmentations using the latter method. On occasion, intermuscular fat found within the fascia just exterior to the muscles may be excluded from muscle segmentation, particularly for threshold-based edge detection. The fact that intermuscular fat exterior to the muscles is excluded but that fat found between muscle groups is included during segmentation raises the question of what MD actually represents. Because it is not always possible to visualize the fascia line in pQCT scans, it is not feasible to systematically include the intermuscular fat just beneath the fascia. At present, there is no solution but to recognize the limitations of this inconsistency.
Limitations
Motion streaks flanking the cortical bone occasionally extend to the muscle fascia, which could interfere with segmentation efforts. As a standard protocol, scans bearing motion with clear discontinuities in the cortical bone were excluded. Because of difficulties in transporting and recruiting individuals with SCI, this cohort was smaller. A larger sample may be able to better encompass more variability in fatty infiltration into muscle. The older adult cohort only included women. It remains unknown whether there are significant sex-related differences in the severity of muscle fat infiltration.
In conclusion, using a watershed algorithm reproducibly segments muscle from subcutaneous fat in pQCT images, yielding a test-retest precision error that is smaller than threshold-based edge detection provided by the manufacturer’s software. The watershed technique is superior especially for individuals such as older adults or those with SCI in whom there is a marked level of fatty infiltration into muscle. Although more time is required to segment muscle using the watershed algorithm, the more precise estimates of MD are desirable, particularly in longitudinal cohort studies or clinical trials aiming to quantify change over time or studies examining individuals who exhibit a high degree of fatty infiltration into muscle.
Acknowledgments
Andy Kin On Wong was funded by a Vanier CGS Doctoral Award at the time of this project (CGV-104858). Yves Martel and the Tomovision team are kindly thanked for their assistance implementing analysis capabilities to pQCT images and for continued software support. All participants are thanked for their volunteerism.
References
- 1.Butner KL, Creamer KW, Nickols-Richardson SM, et al. Fat and muscle indices assessed by pQCT: relationships with physical activity and type 2 diabetes risk. J Clin Densitom. 2012;15(3):355–361. doi: 10.1016/j.jocd.2012.01.012. [DOI] [PubMed] [Google Scholar]
- 2.Miljkovic-Gacic I, Gordon CL, Goodpaster BH, et al. Adipose tissue infiltration in skeletal muscle: age patterns and association with diabetes among men of African ancestry. Am J Clin Nutr. 2008;87(6):1590–1595. doi: 10.1093/ajcn/87.6.1590. [DOI] [PMC free article] [PubMed] [Google Scholar]
- 3.Cesari M, Leeuwenburgh C, Lauretani F, et al. Frailty syndrome and skeletal muscle: results from the Invecchiare in Chianti study. Am J Clin Nutr. 2006;83(5):1142–1148. doi: 10.1093/ajcn/83.5.1142. [DOI] [PMC free article] [PubMed] [Google Scholar]
- 4.Bonnefoy M, Jauffret M, Jusot JF. Muscle power of lower extremities in relation to functional ability and nutritional status in very elderly people. J Nutr Health Aging. 2007;11(3):223–228. [PubMed] [Google Scholar]
- 5.Sinha R, Dufour S, Petersen KF, et al. Assessment of skeletal muscle triglyceride content by (1)H nuclear magnetic resonance spectroscopy in lean and obese adolescents: relationships to insulin sensitivity, total body fat, and central adiposity. Diabetes. 2002;51(4):1022–1027. doi: 10.2337/diabetes.51.4.1022. [DOI] [PubMed] [Google Scholar]
- 6.Karakelides H, Irving BA, Short KR, et al. Age, obesity, and sex effects on insulin sensitivity and skeletal muscle mitochondrial function. Diabetes. 2010;59(1):89–97. doi: 10.2337/db09-0591. [DOI] [PMC free article] [PubMed] [Google Scholar]
- 7.MacIntyre NJ, Rombough R, Brouwer B. Relationships between calf muscle density and muscle strength, mobility and bone status in the stroke survivors with subacute and chronic lower limb hemiparesis. J Musculoskelet Neuronal Interact. 2010;10(4):249–255. [PubMed] [Google Scholar]
- 8.Cawthon PM, Fox KM, Gandra SR, et al. Clustering of strength, physical function, muscle, and adiposity characteristics and risk of disability in older adults. J Am Geriatr Soc. 2011;59(5):781–787. doi: 10.1111/j.1532-5415.2011.03389.x. [DOI] [PMC free article] [PubMed] [Google Scholar]
- 9.Taaffe DR, Marcus R. The muscle strength and bone density relationship in young women: dependence on exercise status. J Sports Med Phys Fitness. 2004;44(1):98–103. [PubMed] [Google Scholar]
- 10.Blain H, Jaussent A, Thomas E, et al. Appendicular skeletal muscle mass is the strongest independent factor associated with femoral neck bone mineral density in adult and older men. Exp Gerontol. 2010;45(9):679–684. doi: 10.1016/j.exger.2010.04.006. [DOI] [PubMed] [Google Scholar]
- 11.Goodpaster BH, Kelley DE, Thaete FL, et al. Skeletal muscle attenuation determined by computed tomography is associated with skeletal muscle lipid content. J Appl Physiol. 2000;89(1):104–110. doi: 10.1152/jappl.2000.89.1.104. [DOI] [PubMed] [Google Scholar]
- 12.Beattie KA, MacIntyre NJ, Ramadan K, et al. Longitudinal changes in intermuscular fat volume and quadriceps muscle volume in the thighs of women with knee osteoarthritis. Arthritis Care Res. 2012;64(1):22–29. doi: 10.1002/acr.20628. [DOI] [PMC free article] [PubMed] [Google Scholar]
- 13.Karampinos DC, Baum T, Nardo L, et al. Characterization of the regional distribution of skeletal muscle adipose tissue in type 2 diabetes using chemical shift-based water/fat separation. J Magn Reson Imaging. 2012;35(4):899–907. doi: 10.1002/jmri.23512. [DOI] [PMC free article] [PubMed] [Google Scholar]
- 14.Miljkovic-Gacic I, Wang X, Kammerer CM, et al. Fat infiltration in muscle: new evidence for familial clustering and associations with diabetes. Obesity (Silver Spring) 2008;16(8):1854–1860. doi: 10.1038/oby.2008.280. [DOI] [PMC free article] [PubMed] [Google Scholar]
- 15.Wu GA, Bogie KM. Not just quantity: gluteus maximus muscle characteristics in able-bodied and SCI individuals—implications for tissue viability. J Tissue Viability. 2013;22(3):74–82. doi: 10.1016/j.jtv.2013.03.003. [DOI] [PubMed] [Google Scholar]
- 16.Fu G, Hojjat SA, Colchester AC. Integrating watersheds and critical point analysis for object detection in discrete 2D images. Med Image Anal. 2004;8(3):177–185. doi: 10.1016/j.media.2004.06.002. [DOI] [PubMed] [Google Scholar]
- 17.Maly MR, Calder KM, Macintyre NJ, Beattie KA. Relationship of intermuscular fat volume in the thigh with knee extensor strength and physical performance in women at risk of or with knee osteoarthritis. Arthritis Care Res. 2013;65(1):44–52. doi: 10.1002/acr.21868. [DOI] [PMC free article] [PubMed] [Google Scholar]
- 18.Gluer CC, Blake G, Lu Y, et al. Accurate assessment of precision errors: how to measure the reproducibility of bone densitometry techniques. Osteoporos Int. 1995;5(4):262–270. doi: 10.1007/BF01774016. [DOI] [PubMed] [Google Scholar]
- 19.Burrows M, Cooper DM, Liu D, McKay HA. Bone and muscle parameters of the tibia: agreement between the XCT 2000 and XCT 3000 instruments. J Clin Densitom. 2009;12(2):186–194. doi: 10.1016/j.jocd.2008.09.005. [DOI] [PubMed] [Google Scholar]
- 20.Szabo KA, Webber CE, Gordon C, et al. Reproducibility of peripheral quantitative computed tomography measurements at the radius and tibia in healthy pre- and postmenopausal women. Can Assoc Radiol J. 2011;62(3):183–189. doi: 10.1016/j.carj.2010.04.011. [DOI] [PMC free article] [PubMed] [Google Scholar]
- 21.Swinford RR, Warden SJ. Factors affecting short-term precision of musculoskeletal measures using peripheral quantitative computed tomography (pQCT) Osteoporos Int. 2010;21(11):1863–1870. doi: 10.1007/s00198-009-1151-3. [DOI] [PubMed] [Google Scholar]
- 22.Zanaty EA, Afifi A. A watershed approach for improving medical image segmentation. Comput Methods Biomech Biomed Engin. 2013;16(12):1262–1272. doi: 10.1080/10255842.2012.666794. [DOI] [PubMed] [Google Scholar]


