Abstract
Eustachian tube dysfunction can cause fluid to collect within the middle ear cavity and form a middle ear effusion (MEE). MEEs can persist for weeks or months and cause hearing loss as well as speech and learning delays in young children. The ability of a physician to accurately identify and characterize the middle ear for signs of fluid and/or infection is crucial to provide the most appropriate treatment for the patient. Currently, middle ear infections are assessed with otoscopy, which provides limited and only qualitative diagnostic information. In this study, we propose a method utilizing cross-sectional depth-resolved optical coherence tomography to noninvasively measure the diffusion coefficient and viscosity of colloid suspensions, such as a MEE. Experimental validation of the proposed technique on simulated MEE phantoms with varying viscosity and particulate characteristics is presented, along with some preliminary results from in vivo and ex vivo samples of human MEEs.
Keywords: Correlation, Ear infection, Middle ear effusion, Biofilm, Optical coherence tomography
Graphical Abstract
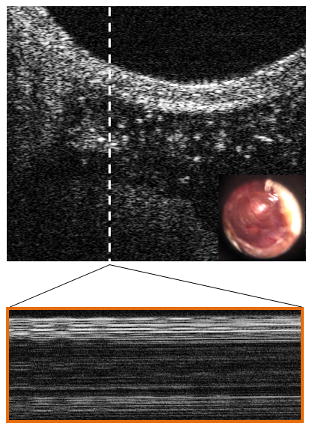
Middle ear disease is commonly evaluated with otoscopy, providing limited qualitative information about the tympanic membrane and middle-ear content. Here a method is presented to assess the general state of the middle ear with cross-sectional optical coherence tomography images that directly reveal the presence of a scattering effusion. Relative Stokes-Einstein coefficients are calculated for various suspensions and phantoms and both in vivo and ex vivo human middle ear effusion samples.
1. Introduction
A middle ear effusion (MEE) is a collection of fluid within the middle ear, and is indicative and characteristic of inflammation in the ear. An effusion commonly results from the blockage, constriction, or dysfunction of the Eustachian tube commonly associated with otitis media (OM), or middle-ear infection. This dysfunction causes negative pressure to develop in the middle ear cavity, which draws out fluid from the surrounding middle ear and mastoid tissue. At least 75% of children under 3 years of age have experienced some form of OM and MEE [1]. Depending on the infectious conditions of the ear and the immune response of the body, MEEs can become increasingly purulent and mucous-filled. Typically, MEEs can persist for weeks or months, and can eventually lead to the formation of a “glue ear”, or a thick, mucoid effusion. The altered viscosity of a MEE prevents efficient clearance by middle-ear cilia [2], and likely is related to repeated episodes of OM [3].
It is therefore critical to accurately diagnose and characterize the many different presentations of OM, including MEEs, to ensure that appropriate and sufficient treatment is provided to the patient. Generally, MEEs may be serous or mucoid, can eventually become purulent [4], and may present with a host of other OM related symptoms (e.g. injection, inflammation, or pain). Clinically, MEEs can cause varying degrees of hearing loss in the short term. In the long term, MEEs can cause even more serious complications such as structural damage to finer structures in the middle ear, and speech or learning delays if left untreated. Prescribing an effective treatment for MEEs is difficult, as antibiotics may not immediately clear an effusion, and surgery may be an unnecessary risk if there is not sufficient cause for concern (e.g. hearing loss, speech delay, damage to middle ear bones, persistence for longer than 3–6 months, etc.) [5,6]. However, the persistence and prevalence of OM is the reason why it is one of the most common surgically treated conditions in children under anesthesia [7,8].
The presence and the degree of severity of a MEE is not always clear when observed with standard otoscopic methods, which is why pneumatic otoscopy is often cited as the “gold-standard” to assess the presence of MEEs [5], although rarely performed in practice. Tympanometry and acoustic reflectometry techniques are also useful to help identify MEEs [9–11], but are recommended to be compared alongside pneumatic otoscopy results. Tympanocentesis, the removal of a MEE by aspiration through a needle, can be performed to remove and directly examine a MEE[12], but it is rarely performed in most primary care clinics as it is considered an invasive procedure that carries additional risk to the patient. Ultrasound-based methods for assessing for the presence of a MEE have excellent accuracy [13], but lack the ability to spatially resolve middle ear biofilms, and typically require unobstructed water-based coupling through the outer ear canal. As a result, there is an unmet need for a technique in the clinician’s toolbox that can visually identify and quantitatively characterize a MEE, as well as assess the middle ear for infection noninvasively and in vivo.
Presented here is the application of an optical coherence tomography (OCT)-based dynamic light scattering (DLS) technique for an objective assessment of MEEs. DLS is a widely applicable technique in many fields, including medicine [14,15] and biophysics [16,17], and is used to determine the Stokes-Einstein (S-E) diffusion coefficient of particles undergoing Brownian motion by analyzing the intensity-autocorrelation of the light scattered from the diffusing particles. Since the backscattering cross-section is the primary source of contrast in OCT, DLS measurements can be readily performed using OCT data [18–24]. While these measurements can also be made using low-coherence interferometry (non-scanning OCT), the combination of cross-sectional OCT images and DLS measurements of a MEE can be used to rapidly identify spatial non-uniformities across the tympanic membrane (TM) and MEE, compared to the single depth scans provided by LCI (non-scanning OCT). In this study, we present the application of OCT-based DLS measurements to observe MEEs in vivo and characterize their physical properties, such as viscosity. The proposed method is first validated by estimating the S-E diffusion coefficient of suspensions of varying viscosities and particulate characteristics, as well as phantoms developed to mimic OM with MEE. Finally, this method is used to characterize several in vivo and ex vivo MEE samples from human subjects.
2. Methods and Materials
2.1. Portable, handheld, optical coherence tomography system
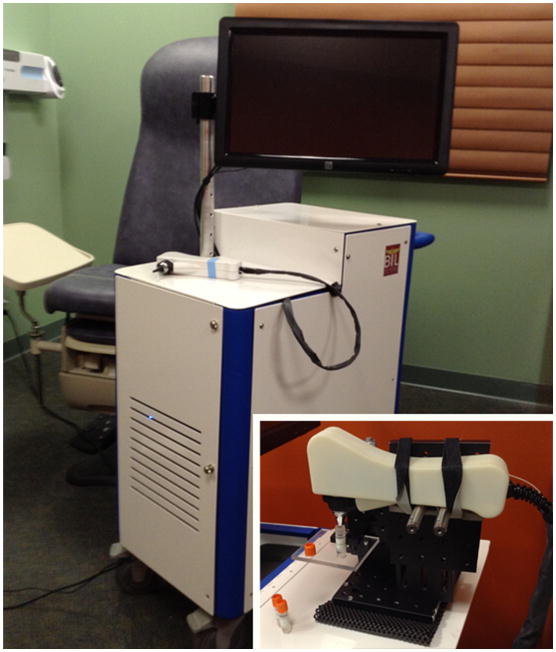
The portable, handheld, OCT system used in this study was developed in-house for clinical use, and is shown in Figure 1. The system has a broadband optical source (Superlum) centered at 860 nm with a bandwidth of approximately 135 nm full width at half maximum (FWHM). The axial and transverse resolutions of the system are 2.4 μm and 15 μm, respectively, in air. Each cross-sectional image (B-scan) is 2048 pixels in depth, given by the line scan camera-based spectrometer (Wasatch Photonics, Basler), with 1000 adjacent columns (A-lines), collected at a frame rate of approximately 30 frames per second (FPS). Transverse beam scanning for acquiring B-scans was performed using a MEMS scanning unit (Advanced MEMS). To collect DLS data, a non-scanning (low-coherence interferometry) configuration was used, with the beam incident on the sample. Subsequently, a commercial USB video otoscope (Welch Allyn) was used to collect high resolution surface images of the TM. Further details about the system dimensions and specifications can be found in earlier publications [25,26].
Fig. 1.
Handheld optical imaging system utilizing OCT. System is designed to be portable and can be easily transported to and from clinical sites. Handheld probe utilizes interchangeable tips to allow for both a wide field-of-view during benchtop imaging as well as compatibility with speculum tips used during human subject imaging. Inset: Handheld probe in a mounted configuration used to measure phantom samples or aspirated ex vivo middle ear effusions.
M-mode (repeated A-lines acquired at a fixed transverse position over time) OCT data was obtained from the microparticle suspensions and MEE phantoms by fixing the probe in a mounted configuration (Figure 1, inset). Before imaging, all samples were allowed to equilibrate to room temperature, approximately 25 °C, and to limit the effects of turbulence from movement. Twenty sequential M-mode images, each consisting of a total of 4,000 sequential A-lines (each A-line taken at a 31 μs exposure) were acquired from each of the samples.
The handheld probe illuminates the TM with a 2.5 mW beam. Taking into account the dwell time needed for each of these non-scanning measurements (124 ms) and the central wavelength of 860 nm, our system provides a radiant exposure to the TM that is approximately 420 times lower than the ANSI Maximum Permissible Exposure (MPE) limit for skin [27]. This optical exposure is further reduced during normal OCT imaging, as the beam rapidly sweeps over tissue at approximately 30 FPS, with far less single-point dwell time. This system, therefore, operates well below the ANSI MPE limit in either mode.
2.2. Microparticle suspensions and middle ear phantoms
To calculate an accurate value of the diffusion coefficient, particles undergoing Brownian motion at a known temperature and in a medium of known properties, including refractive index and viscosity, were needed. Therefore, to independently study the effect of particle size and viscosity on the S-E coefficient, two sets of three microparticle suspensions were created. For the first set, to vary the particle size, suspensions of non-functionalized polymer microbeads (Bangs Labs) of three different average diameters, 0.54 μm, 1.14 μm, and 1.73 μm, were prepared by mixing the microparticles in distilled water. The second set was prepared by mixing 1.14 μm microbeads in three different water-glycerol mixtures (90/10, 70/30, 50/50, % vol/vol), to obtain suspensions of varying viscosity. To ensure accurate mixing ratios, stock solutions of the water-glycerol mixtures were first created using a large diameter syringe to pipette glycerol, which was then diluted down to meet the specified mixture parameters [28]. Microparticles were subsequently added to form the suspension and were thoroughly mixed with a standard touch vortex mixer for approximately two minutes.
Two types of phantoms were created to simulate the in vivo conditions of two infections by varying the viscosity of the MEE and the overall appearance and thickness of a simulated biofilm. A biofilm is defined as an group of bacterial micro-organisms within a self-produced extracellular polymer matrix that has been found affixed to the TM and middle ear mucosa and is commonly found in chronic or recurrent OM [7,26,29]. The phantoms were created using two of the same microparticle suspensions described previously using 1.14 μm microbeads and water-glycerol mixtures (90/10 and 50/50, %vol/vol). Thin plastic sheets typically used in a head/ear training model for pneumatic otoscopy exams (Nasco) were used as a TM phantom, and petroleum jelly was used as a moderately scattering biofilm phantom. These phantoms will be used to ensure that it is still possible to recover the diffusion coefficient in a more complex, multi-structured sample.
2.3. Algorithm requirements and testing
For this study, a reformulated version of the traditional method of cumulants [30] was used, which is one of the most commonly used technique for data analysis in DLS. In the method of cumulants, the intensity autocorrelation function of the scattered light is expressed in terms of a distribution of decay rates. Since this formulation takes into account the variability in the decay rate of the sample, and the fitting is performed around the mean utilizing the moments of the autocorrelation function, it is generally more robust to noise in the data [30].
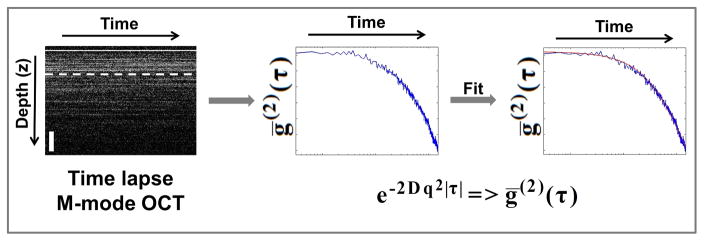
Figure 2 describes how the S-E diffusion coefficient is calculated for a sample. First, the raw spectral domain M-mode OCT data is resampled to be linear in wavenumber (k), and processed with a custom dispersion correction and FFT algorithm [31]. Next, the temporal intensity autocorrelation function is calculated for each depth over a user-specified depth range:
| (1) |
Fig. 2.
Data analysis and processing flow: (Left) Starting with time-lapse axial depth scans (A-lines), a depth is selected and the intensity autocorrelation decay curve (Blue) is calculated (center). The analytical expression for the second order intensity autocorrelation is fitted (Red) to the experimentally obtained temporal intensity autocorrelation data (Blue) to estimate the diffusion coefficient D. M-mode OCT scale bar is approximately 200 μm in depth. ḡ(2)(τ): averaged temporal intensity-based autocorrelation function, D: Stokes-Einstein diffusion constant and q: scanning parameter as defined in the text.
Then, an average of the resulting autocorrelation functions is taken over repeated measurements to calculate a mean value for each depth. This helps to reduce the inherent statistical variation otherwise present. This data is then fit using the method of cumulants to estimate the parameter Γ=Dq2. The parameter Γ, called the decay rate, characterizes the rate of decay of the intensity autocorrelation function. The expression for Γ contains both the (S-E) diffusion coefficient , and q is the scanning parameter , where θ is defined as the scattering angle. These parameters are used to fit the data according to:
| (2) |
The intensity autocorrelation of a suspension of higher viscosity decays at a slower rate (has smaller Γ) than a suspension of lower viscosity. This means that in general, more viscous MEEs would be characterized by a smaller value of Γ, compared to less viscous MEEs.
If we assume that the directly backscattered light from the sample (θ = 180°) is collected with OCT, the term becomes unity and the expression for the scanning parameter simplifies to . Once q is known, an average value and standard deviation can be estimated for the diffusion coefficient D (cm2/s). If D is accurately estimated and the particle size r is known, η can then be determined. When imaging in vivo, data for analysis was collected from regions near the TM-MEE interface. This site selection helped to standardize data analysis between subjects by identifying a common feature, and helped reduce the contribution from multiple scattering effects that can alter the detected decay time [18,32].
2.4. Clinical human subject imaging
Clinical imaging and data acquisition was performed under a protocol approved by the Institutional Review Boards of Carle Foundation Hospital in Urbana, IL and the University of Illinois at Urbana-Champaign, and under the supervision of the attending surgeon and staff. Human subjects with chronic OM and in need of surgical placement of tympanostomy tubes to treat their infection as per the standard-of-care participated in this study, following informed consent.
The subjects were imaged in the surgical suite with a handheld OCT probe (Figure 1). If present, effusions were first imaged in vivo immediately after the induction of anesthesia, but prior to myringotomy (incision in the TM) and tympanostomy tube placement. After myringotomy, the MEE was aspirated using a small metal cannula and vacuum line that fed to an exudate trap. The aspirated ex vivo MEEs were then observed and imaged in the trap using the handheld probe in the mounted configuration as described previously.
3. Results and Discussion
3.1. Phantoms of varying particle size and viscosity
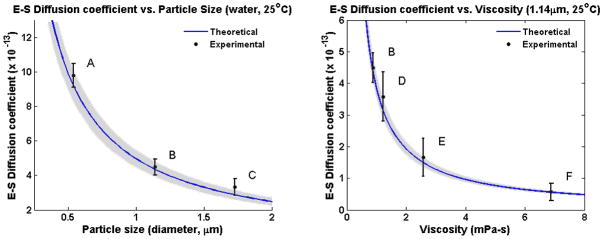
Figure 3 describes the results from the experimental calculation of particle size and viscosity of the suspensions using this technique. The theoretical curve (blue) displays the expected value based on the known properties of the samples: viscosity, room temperature, and particle diameter, while the average and standard deviation of the experimentally obtained S-E diffusion coefficient data points are shown in black. The experimentally determined data closely matches the expected theoretical values.
Fig. 3.
Experimentally determined Stokes-Einstein diffusion coefficients for microparticle solutions of varying particle sizes or viscosity. Blue curves show the theoretical trend for both cases, and the gray shaded areas define the approximate accuracy of the calculated theory, which is a function of microparticle manufacturing tolerances. Left: Observed microparticles of increasing diameter (A = 0.54 μm, B = 1.14 μm, C = 1.73 μm) suspended in water at room temperature. Right: Observed 1.14 μm particles suspended in water and glycerol mixtures of varying increasing viscosity (B = 100/0, D = 90/10, E = 70/30, F = 50/50; % vol/vol) at room temperature. Average and standard deviation of measured data are displayed (N = 20). Note: Point B in both plots reflects the same data point.
In general, the agreement between the experimental and theoretical values depends on the accuracy of the known parameters of the S-E coefficient D, namely, the hydrodynamic particle size (r) and viscosity (η). In the presented experiments, the variance in the experimental estimates can be mainly attributed to the accuracy of the suspension preparation and volume mixing, as well as any variability in particle size diameter due to manufacturing tolerances, stated by the manufacturer to be near 5–10% [33]. Gray shaded regions in both plots of Figure 3 reflect a 7% variance in size from the product specification, which provides reasonable limits on the accuracy of the particles’ theoretically calculated behavior. Moreover, viscosity can change with temperature, although this is less of a concern in these well controlled samples.
3.2. Middle ear phantoms
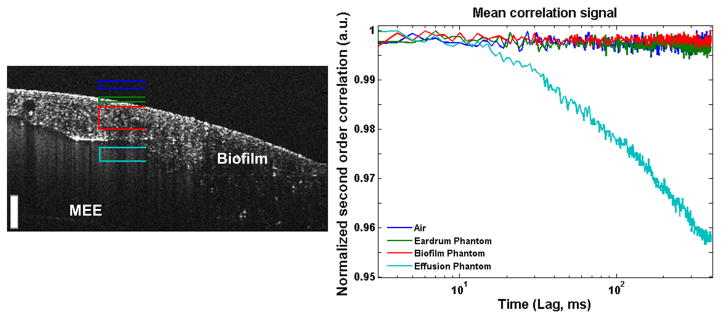
To investigate the feasibility of the proposed method for characterizing MEEs non-invasively, it is imperative to image through other interfaces or tissue, namely the TM and any potential biofilm-related structures that may be affixed to the TM. The proposed technique has the benefit of depth-resolved measurements by using OCT, which is detailed in Figure 4. The four marked depth ranges were processed through the algorithm, showing no appreciable signals from the static non-moving portions of the phantom, namely, the air within the ear canal, the TM tissue, or the thick adherent biofilm phantom. This demonstrates that any meaningful signals are acquired only from the effusion, and not from other fixed structures or potential sources of error or noise.
Fig. 4.
Results of testing the feasibility of the proposed method for non-invasive characterization of MEEs in a middle ear phantom. Different depth ranges corresponding to air above the phantom (Dark Blue), simulated TM (Green), simulated biofilm (Red), and simulated effusion (Teal) were analyzed using the proposed technique. As expected, only the simulated effusion provides a meaningful decay curve (right). Scale bar is 100 micron in depth.
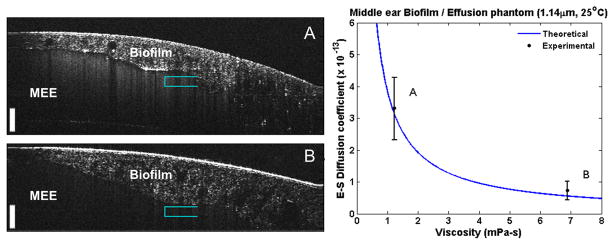
Subsequently, we tested the proposed method on MEE phantoms (Figure 5) based on phantom samples D and F from Figure 4, which were selected to more closely mimic the biomechanical properties of MEEs. This phantom served as a final proof-of-concept measurement using water- and glycerol-based samples observed through a more realistic phantom with simulated TM and biofilm. The cross-sectional OCT images of the phantoms shown in Figure 5A and Figure 5B clearly show the additional biofilm-like structure and the scattering effusion-like features. The experimental S-E coefficient of each phantom was determined and found to match the theoretical value of the MEE phantom, as shown in the right panel of Figure 5. It is important to note that by looking solely at the static OCT images, no obvious determination can be made to differentiate these samples. A prior study of roughly 100 subjects used a commercial magnetic rheometer to observe MEE samples and showed a measurable difference in human MEE viscosity between serous and mucoid effusion types [34]. The findings of this previous study, along with the analysis of MEE phantoms presented here, lends credibility that this technique can effectively analyze different types of MEE samples.
Fig. 5.
Stokes-Einstein diffusion coefficient measurements of middle ear phantoms. The phantoms (A, B) each contain a different effusion-like suspension (suspension of water, glycerol, and micro-particle mixtures) to mimic the physiological qualities of a ‘serous’ and ‘mucoid’ middle ear effusion. Scale bars represent 100 μm in depth. Right: Calculated S-E diffusion coefficients from effusions plotted against the theoretical trend. Measurements taken near teal-colored brackets (N = 15).
3.3. Analysis of in vivo and ex vivo clinical data
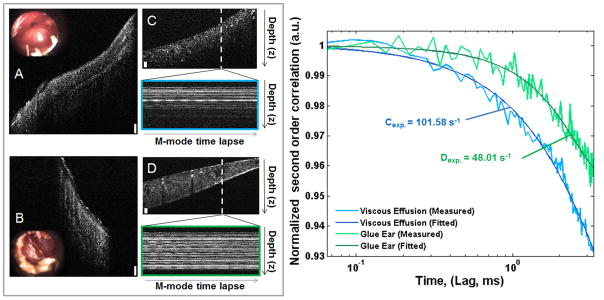
To test the utility of this technique in a clinical setting, human MEEs were evaluated with representative results shown in Figure 6 and Figure 7. Figure 6 shows the comparison between two separate MEE samples. Figure 6A shows an in vivo cross-sectional OCT image and inset high-resolution otoscope image from a patient with a thick effusion, while Figure 6B shows an effusion from another patient. Figure 6C and 6D show cross-sectional images of the respective aspirated ex vivo MEEs in an exudate trap, with the subsequently measured time-lapse M-mode OCT data. The plot in Figure 6 (right) shows the comparison of the normalized second order correlation plots of the aspirated ex vivo MEEs, where the data from Figure 6A has a decay constant of 101.58 s−1, while the data from Figure 6B has a value of 48.01 s−1. These quantitative results suggest that the effusion from the subject shown in Figure 6B has a more viscous effusion than the subject in Figure 6A, which is in agreement with the qualitative clinical assessment.
Fig. 6.
Comparison of two ex vivo MEEs. (A, B): In vivo cross-sectional OCT images and inset video otoscope stills. (C, D): Corresponding ex vivo cross-sectional OCT images of MEE in exudate trap after aspiration, with M-mode time-lapse data (OCT A-scans taken repeatedly at the white dotted line over time) displayed below. All scale bars are approximately 100 μm in depth. Right: Decay curves for both C (Blue, Γ =101.58 s−1) and D (Green, Γ = 48.01 s−1) ex vivo MEE samples.
Fig. 7.
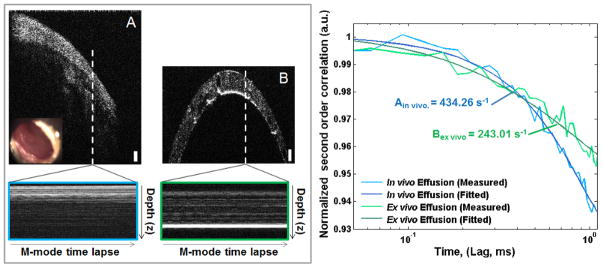
Comparison of MEE in vivo, and ex vivo after aspiration. (A): In vivo cross-sectional image and inset video otoscope still. (B): Ex vivo cross-sectional image from a cylindrical transparent exudate trap. Below: M-mode time-lapse data, single OCT A-scans taken repeatedly at the white dotted line through time. Scale bars approximately 100 μm in depth. Right: Decay curves for both A (Blue, Γ = 434.26 s−1) and B (Green, Γ = 243.01 s−1) MEE. Although observing the same sample, changes in the decay constants shows the viscosity related changes induced after aspiration and cooling.
Figure 7 shows the comparison of a MEE observed in vivo and then ex vivo after aspiration. Figure 7A shows the cross-sectional OCT image and inset high-resolution otoscope image of the ear. Figure 7B shows the aspirated MEE within the cylindrical transparent exudate trap. The white dotted-lines in Figures 7A and 7B define the location of time-lapse M-mode OCT scans, shown below and bordered blue and green, respectively. The decay curves show the comparison of the normalized second order correlation plots, where the in vivo data from Figure 7A has a decay constant of 434.26 s−1, while the autocorrelation function in Figure 7B has a decay constant of 243.01 s−1. The discrepancies in the two measurements can be partly explained by the differences in the imaging conditions of the two samples – within the middle ear and after aspiration within the exudate trap. These sample conditions will differ mainly in structure and temperature. The aspiration process will disturb the biofilm structure affixed to the TM and rapidly cool the total contents of the MEE, including any fluid and bacterial components, from body temperature to operating room temperature (from approximately 37 °C to 22 °C as measured with an in-room thermometer). As in most fluids or colloids, a drop in temperature will cause an increase in viscosity, which most likely caused the lengthening of the decay time in the ex vivo MEE sample with respect to the in vivo MEE sample.
3.4. Limitations and future work
Since this study is based on the principle of DLS, it suffers from the inherent limitations of DLS. For instance, it is assumed that the particles undergoing undisturbed Brownian motion are spherical in shape and are suspended in a uniformly viscous solution. However, MEEs can be complex, perhaps aggregated mixtures of different sized and likely non-spherical particles (e.g. immune cells, blood cells, and bacteria), which could potentially introduce errors in our analysis. While this problem was partially mitigated by employing the cumulants method for analyzing the data, which takes into account the possible polydisperse nature of the MEE, further studies on a larger subject pool are warranted to better understand the effect of varying particle sizes and shapes on the estimation of the S-E diffusion coefficient. Despite the heterogeneous composition of the MEEs, the results of this study are promising in that they suggest that the proposed method is able to quantitatively evaluate or grade different types of chronic viscous and mucopurulent effusions, and do so in vivo.
As a part of future work, the proposed method will be further validated in a larger number of patients with a broader range of types of MEEs and viscosities. In this patient population, subjects with more chronic mucoid MEEs associated with chronic OM that require surgery are common, however, few, if any, serous MEEs are regularly found. Surgical interventions are also postponed, if possible, until no active infection is present, which further limits the incidence of serous effusions encountered during surgery. Additional subjects, therefore, will be needed to observe and characterize statistical differences between serous and mucoid MEEs from patients, both in vivo and ex vivo.
Currently, for benchtop scans, motion and positional stability is required for at least 124 ms per M-mode image to collect sufficient data to adequately sample the decay. In this regard, increasing the speed of the algorithm is needed, as avoiding motion artifacts resulting from either patient or probe movement can be a challenge. To ensure the stability of the handheld probe over a sufficiently long period of time, the probe could be mounted on a rigid or articulated arm to reduce operator movement. Additionally, no measures were taken to minimize ambient noise within the operating room, although standard noise levels were low-to-moderate. Any auditory stimulus within the room may provide additional and unwanted stimulus to the TM, ossicle chain, and subsequently the MEE. Future studies will investigate the effects of varying levels of auditory stimuli to better understand the overall requirements needed for this technique. Similarly, further bench-top simulations will be performed to study the effect of probe and sample movement on the performance of the proposed method, as well as explore methods to reduce the required number of points needed for each measurement. Implementation of a recently developed phase-correction method could be beneficial in this regard [35–37] to ensure phase-stability in these measurements.
4. Conclusion
OCT-based ear imaging shows strong potential for clinical impact. In addition to the already established use of OCT for structural imaging and characterization of the middle ear, it is feasible using this presented technique to characterize the viscosity of MEEs non-invasively and in vivo. Eventually, this expanded set of information may be used to more accurately diagnose the wide spectrum of OM infection, and help physicians improve clinical decision making.
Acknowledgments
The authors thank Andrew J. Bower and Adeel Ahmad at the Beckman Institute for Advanced Science and Technology for helpful discussions, Barbara Hall, Kevin Osborne, and Deveine Toney at Carle Research for help with IRB management, the nursing staff at both the Expanding Children’s Hearing Opportunities (ECHO) and Surgicenter (ASC) sites at Carle Foundation Hospital for their clinical assistance, and Eric Chaney at the Beckman Institute for help supporting our IRB protocols. This work was supported in part by an NIH NIBIB Bioengineering Research Partnership grant (R01 EB013723), and a grant from the Center for Integration of Medicine and Innovative Technology (CIMIT). Additional information can be found at: http://biophotonics.illinois.edu.
Footnotes
Conflict of Interest statement
S.A.B., R.L.S., and R.M.N. are co-founders of PhotoniCare, Inc., which is commercializing optical coherence tomography for imaging the ear. The remaining authors have no other funding, financial relationships, or conflicts of interest to disclose.
References
- 1.Ramakrishnan KSR, Berryhill WE. American Family Physician. 2007;76:11. [PubMed] [Google Scholar]
- 2.Takeuchi K, Saida S, Majima Y, Sakakura Y. European Archives of Oto-Rhino-Laryngology. 1990;247(5):323–325. doi: 10.1007/BF00176546. [DOI] [PubMed] [Google Scholar]
- 3.Haggard M. British Society of Audiology. 1999;34:121–123. [Google Scholar]
- 4.Paparella MM. Annals of Otology Rhinology and Laryngology. 1976;85(2):8–11. doi: 10.1177/00034894760850S202. [DOI] [PubMed] [Google Scholar]
- 5.American Academy of Pediatrics Subcommittee on Otitis Media With Effusion. Pediatrics. 2004;113(5):1412–1429. doi: 10.1542/peds.113.5.1412. [DOI] [PubMed] [Google Scholar]
- 6.Rosenfeld RM, Schwartz SR, Pynnonen MA, Tunkel DE, Hussey HM, Fichera JS, Grimes AM, Hackell JM, Harrison MF, Haskell H, Haynes DS, Kim TW, Lafreniere DC, LeBlanc K, Mackey WL, Netterville JL, Pipan ME, Raol NP, Schellhase KG. Otolaryngology -- Head and Neck Surgery. 2013;149(1 suppl):S1–S35. doi: 10.1177/0194599813487302. [DOI] [PubMed] [Google Scholar]
- 7.Nguyen CT, Jung W, Kim J, Chaney EJ, Novak M, Stewart CN, Boppart SA. Proceedings of the National Academy of Sciences. 2012;109(24):9529–9535. doi: 10.1073/pnas.1201592109. [DOI] [PMC free article] [PubMed] [Google Scholar]
- 8.Nguyen CT, Tu H, Chaney EJ, Stewart CN, Boppart SA. Biomedical Optics Express. 2010;1(4):1104–1116. doi: 10.1364/BOE.1.001104. [DOI] [PMC free article] [PubMed] [Google Scholar]
- 9.Smith CG, Paradise JL, Sabo DL, Rockette HE, Kurs-Lasky M, Bernard BS, Colborn DK. Pediatrics. 2006;118(1):1–13. doi: 10.1542/peds.2005-1879. [DOI] [PubMed] [Google Scholar]
- 10.Helenius KK, Laine MK, Tahtinen PA, Lahti E, Ruohola A. Pediatric Infectious Diseases Journal. 2012;31(10):1003–1006. doi: 10.1097/INF.0b013e31825cac94. [DOI] [PubMed] [Google Scholar]
- 11.Laine MK, Tahtinen PA, Helenius KK, Luoto R, Ruohola A. Pediatric Infectious Disease Journal. 2012;31(10):1007–1011. doi: 10.1097/INF.0b013e31825caf45. [DOI] [PubMed] [Google Scholar]
- 12.Chung MH, Choi JY, Lee WS, Kim HN, Yoon JH. Laryngoscope. 2002;112(1):152–155. doi: 10.1097/00005537-200201000-00027. [DOI] [PubMed] [Google Scholar]
- 13.Discolo CM, Byrd MC, Bates T, Hazony D, Lewandowski J, Koltai PJ. Archives of Otolaryngology–Head & Neck Surgery. 2004;130(12):1407–1410. doi: 10.1001/archotol.130.12.1407. [DOI] [PubMed] [Google Scholar]
- 14.Elisabeth M-S, Keddie B, Audrey L, Andre M, Otto G. Physics in Medicine and Biology. 2006;51(15):3747. [Google Scholar]
- 15.Rovati L, Fankhauser IIF, Docchio F, Van Best J. Journal of Biomedical Optics. 1998;3(3):357–363. doi: 10.1117/1.429882. [DOI] [PubMed] [Google Scholar]
- 16.Panchal J, Kotarek J, Marszal E, Topp EM. The AAPS Journal. 2014;16(3):440–451. doi: 10.1208/s12248-014-9579-6. [DOI] [PMC free article] [PubMed] [Google Scholar]
- 17.Hassan PA, Rana S, Verma G. Langmuir. 2015;31(1):3–12. doi: 10.1021/la501789z. [DOI] [PubMed] [Google Scholar]
- 18.Kalkman J, Sprik R, Leeuwen TG. Physical Review Letters. 2010;105 doi: 10.1103/PhysRevLett.105.198302. [DOI] [PubMed] [Google Scholar]
- 19.Kim CS, Qi W, Zhang J, Kwon YJ, Chen Z. Journal of Biomedical Optics. 2013;18(3) doi: 10.1117/1.JBO.18.3.030504. [DOI] [PMC free article] [PubMed] [Google Scholar]
- 20.Wang R, Ding H, Mir M, Tangella K, Popescu G. Biomedical Optics Express. 2011;2(3):485–490. doi: 10.1364/BOE.2.000485. [DOI] [PMC free article] [PubMed] [Google Scholar]
- 21.Weiss N, van Leeuwen TG, Kalkman J. Optics Express. 2015;23(3):3448–3459. doi: 10.1364/OE.23.003448. [DOI] [PubMed] [Google Scholar]
- 22.Hajjarian Z, Nadkarni SK. Scientific Reports. 2012;2 doi: 10.1038/srep00316. [DOI] [PMC free article] [PubMed] [Google Scholar]
- 23.Weiss N, van Leeuwen TG, Kalkman J. Physical Review E. 2013;88(4):042312. doi: 10.1103/PhysRevE.88.042312. [DOI] [PubMed] [Google Scholar]
- 24.Kim CS, Qi W, Zhang J, Kwon YJ, Chen Z. Journal of Biomedical Optics. 2013;18(3):030504. doi: 10.1117/1.JBO.18.3.030504. [DOI] [PMC free article] [PubMed] [Google Scholar]
- 25.Hubler Z, Shemonski ND, Shelton RL, Monroy GL, Nolan RM, Boppart SA. Quantitative Imaging in Medicine and Surgery. 2015;5(1):69–77. doi: 10.3978/j.issn.2223-4292.2014.11.32. [DOI] [PMC free article] [PubMed] [Google Scholar]
- 26.Monroy GL, Shelton RL, Nolan RM, Nguyen CT, Novak MA, Hill MC, McCormick DT, Boppart SA. The Laryngoscope. 2015;125(8):E276–282. doi: 10.1002/lary.25141. [DOI] [PMC free article] [PubMed] [Google Scholar]
- 27.American National Standards Institute. Z136 Laser safety standards. 2007. [Google Scholar]
- 28.Cheng NS. Industrial & Engineering Chemistry Research. 2008;47(9):3285–3288. [Google Scholar]
- 29.Hall-Stoodley L, Hu FZ, Gieseke A, Nistico L, Nguyen D, Hayes J, Forbes M, Greenberg DP, Dice B, Burrows A, Wackym PA, Stoodley P, Post JC, Ehrlich GD, Kerschner JE. Journal of the American Medical Association. 2006;296(2):202–211. doi: 10.1001/jama.296.2.202. [DOI] [PMC free article] [PubMed] [Google Scholar]
- 30.Frisken BJ. Applied optics. 2001;40(24):4087–4091. doi: 10.1364/ao.40.004087. [DOI] [PubMed] [Google Scholar]
- 31.Marks DL, Oldenburg AL, Reynolds JJ, Boppart SA. Applied optics. 2003;42(2):204–217. doi: 10.1364/ao.42.000204. [DOI] [PubMed] [Google Scholar]
- 32.Bizheva KK, Siegel AM, Boas DA. Physics Review Letters E. 1998;58:7664–7667. [Google Scholar]
- 33.Bangs Laboratories Inc. Non-functionalized polymer microbeads. 2016. [Google Scholar]
- 34.Takeuchi KMY, Hirata K, Morishita A, Hattori M, Sakakura Y. European Archives of OtoRhinoLaryngology. 1990;247:60–62. doi: 10.1007/BF00240953. [DOI] [PubMed] [Google Scholar]
- 35.Shemonski ND, Ahn SS, Liu Y-Z, South FA, Carney PS, Boppart SA. Biomedical Optics Express. 2014;5(12):4131–4143. doi: 10.1364/BOE.5.004131. [DOI] [PMC free article] [PubMed] [Google Scholar]
- 36.Shemonski ND, Adie SG, Liu Y-Z, South FA, Carney PS, Boppart SA. Optics Express. 2014;22(16):19183–19197. doi: 10.1364/OE.22.019183. [DOI] [PMC free article] [PubMed] [Google Scholar]
- 37.Shemonski ND, Ahmad A, Adie SG, Liu Y-Z, South FA, Carney PS, Boppart SA. Optics Express. 2014;22(16):19314–19326. doi: 10.1364/OE.22.019314. [DOI] [PMC free article] [PubMed] [Google Scholar]


