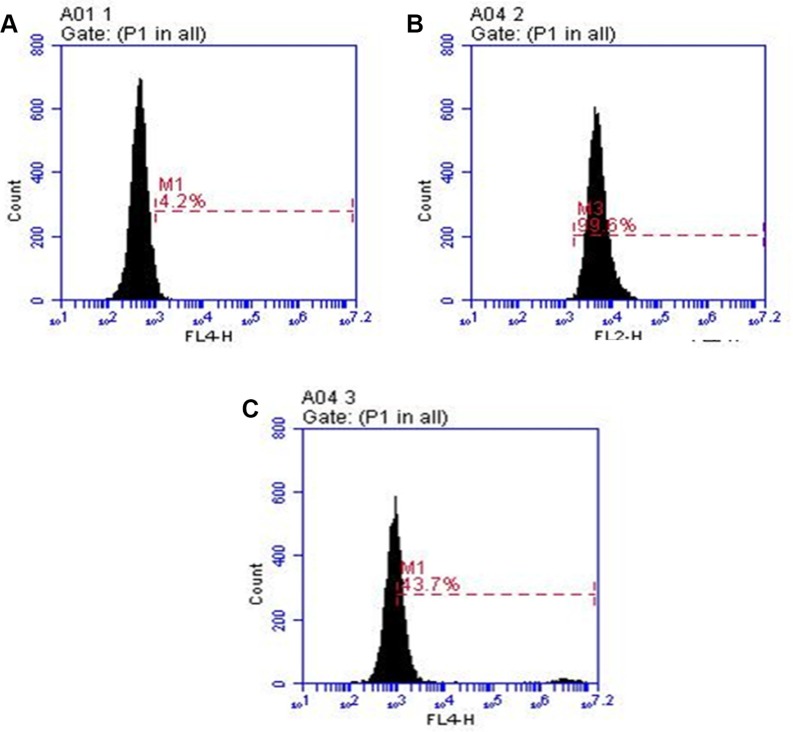
Figure 3. Comparison of binding by 7 to the cells with untreated Herceptin.
A549 cells were stained with the Herceptin and conjugate 7 and analyzed by flow cytometry. Images: (A) shows unstained A549 cells. (B) shows pure Herceptin binding. (C) shows binding of 7. The cell line was cultured as described in the methods section.

