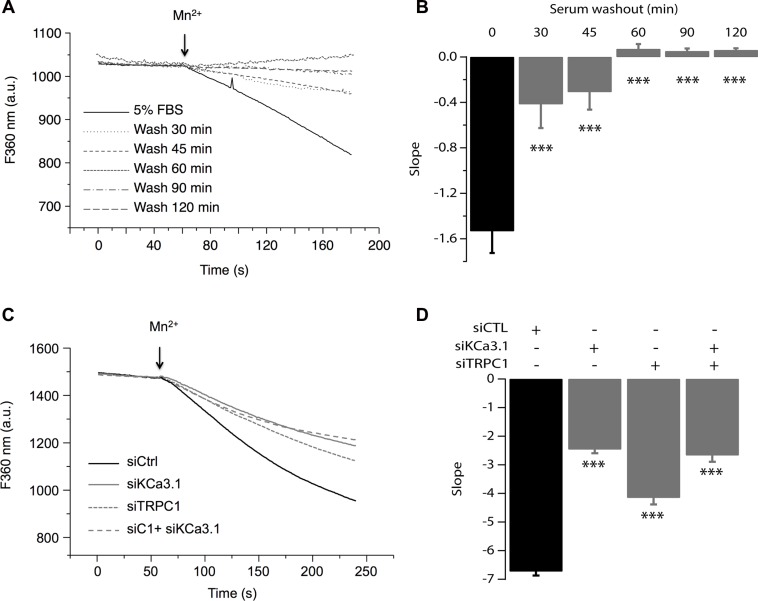
Figure 4. TRPC1 and KCa3.1 channels regulate the basal Ca2+ entry.
(A) Representative traces of Mn2+ quenching in cells at different time points after washing out the culture medium. (B) The graph represents the average slope value of 9 measurements for each condition. ***p < 0.001. (C) Representative traces of Mn2+ quenching in cells transfected with siCTL, siKCa3.1, or siTRPC1). Slope values are: −6.73 ± 0.14, for siCTL, −2.46 ± 0.13 for siKCa3.1, −4.15 ± 0.23 for siTRPC1 and −2.67 ± 0.22 for co-transfection of siKCa3.1 and siTRPC1. (D) The graph represents the average slope value of 31 measurements for each condition. ***p < 0.001.

