
Figure 3. Analysis of copy number alterations in FFPE specimens from SqCLC patients.
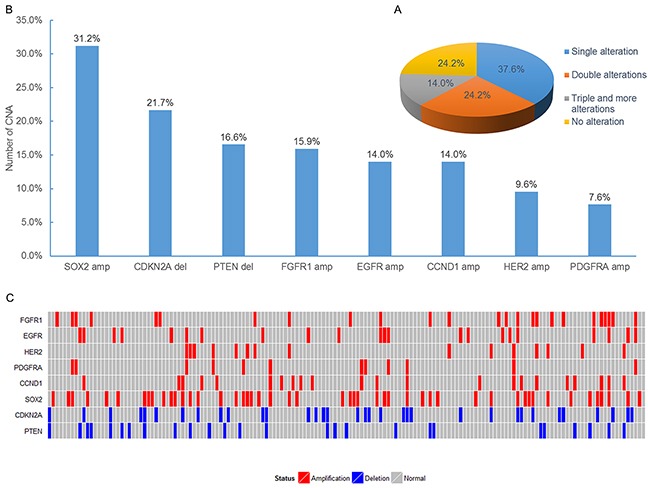
A. The pie chart demonstrated the distribution for the number of copy number alterations detected in specimens. B. Number of copy number alterations in each of the 8 analyzed genes for the 157 specimens. C. Profiles of copy number alteration for all the patients analyzed in this study.