

Abstract
The injury and repair of renal tubular epithelial cells play an important role in the pathological process of acute kidney injury (AKI). This study aimed to clarify the role of cell cycle change in renal tubular epithelial cell injury and repair in vivo and in vitro. Sprague-Dawley rats received bilateral renal pedicle clamping for 45 min (ischemia) followed by reperfusion. Pifithrin-α, a p53 inhibitor, was administered at 24 h before renal ischemia and 3 and 14 days after reperfusion. Results showed the tubular epithelial cells in M phase increased significantly at 2 h to 72 h after ischemia/reperfusion (I/R), while pifithrin-α decreased them. Renal I/R caused renal tubular epithelial damage in rats, which was improved by pifithrin-α. The α-SMA mRNA expression was up-regulated significantly after I/R, while it was down-regulated by pifithrin-α.NRK-52E cells were cultured in vitro, cell damage was induced by addition of TNF-α, and then cells were treated with pifithrin-α. Cells treated with TNF-α alone in G2/M phase increased significantly, but they were reduced in the presence of pifithrin-α. In NRK-52E cells treated with pifithrin-α for 6 h, NGAL mRNA expression was significantly lower than in cells without pifithrin-α treatment. After NRK-52E cells were treated with pifithrin-α for 24 h, α-SMA and FN mRNA expression was significantly lower than in cells without the treatment. In summary, pifithrin-α can facilitate the progression of renal tubular epithelial cells through G2/M phase, protecting them against injury.
Keywords: Acute kidney injury (AKI), renal tubular epithelial cell, cell cycle, G2/M phase, pifithrin-α
Introduction
Acute kidney injury (AKI) has emerged as a major public health problem that affects millions of patients worldwide and leads to decreased survival and increased incidence of underlying chronic kidney disease (CKD) [1,2]. The incidence of AKI in hospitalized patients has generally been reported to ranging from 2% to 7%. In the intensive care unit (ICU), incidence of AKI is as high as 5%-10%, and this incidence is higher in patients with multiple organ dysfunction or sepsis [3]. Despite advances have been achieved in the prevention and supportive therapy of AKI, it continues to be associated with high morbidity and high mortality, particularly in those admitted to the ICU, where in-hospital mortality may exceed 50% [3,4]. In addition to the high mortality of AKI patients - generally reported to be 30%-70%- it has relationship with chronic consequences even if the patients have survived from acute illness, with a high risk for CKD or even end-stage renal disease (ESRD) [3,5]. Therefore, the mechanism of renal injury and repair following AKI has become a hot topic in current studies.
The pathogenesis of kidney injury has involvement of a variety of signaling pathways driven by the interplay of inflammatory cytokines/chemokines, reactive oxygen species (ROS), and apoptosis related factors [6-8]. Renal ischemia/reperfusion injury (IRI), a common cause of AKI, results from a generalized or localized impairment of oxygen and nutrient delivery to and waste product removal from cells of the kidney [3], leading to cellular oxygen insufficiency and accumulation of waste products of metabolism. As a result, the tubular epithelial cells undergo injury and, if it is severe, they will die by apoptosis and necrosis, as noted by the clinical term acute tubular necrosis (ATN), which then causes functional impairment of water and electrolyte homeostasis and reduces the excretion of waste products of metabolism [3,9].
Renal tubular epithelial cells are the main type of cells damaged in case of AKI, and they are also the main type of cells involved in the regeneration and repair after renal injury. AKI activates several pathways related to the death and proliferation of renal tubular epithelial cells. Ortiz et al found that the repair following AKI was dependent on the proliferation of surviving cells that replaced the damaged cells leading to recovery [10]. The incapacity of tubular epithelial cells to proliferate is ascribed to the pathogenesis of renal fibrosis. The proliferation of tubular epithelial cells requires their entry into cell cycle progression (G1, S, G2 and M phases) which are related to a lot of molecular and cellular events [10,11].
P53 is a protein closely related to the pathogenesis of cancers. It may inhibit cell proliferation and promote cell apoptosis. Studies have shown that p53 is an important participant in the G2/M checkpoint. Pifithrin-α is an inhibitor of p53 and may block the translocation of p53 into the nucleus, leading to the cell cycle transition. This study aimed to investigate the protective effects of pifithrin-α on the injury to tubular epithelial cells in vivo and in vitro.
Materials & methods
Main reagents
Pifithrin-α (S2929) was purchased from Selleck, and tumor necrosis factor-alpha (TNF-α, 400-14-20) was purchased from peproTech. Neutrophil gelatinase associated lipocalin (NGAL) polyclonal antibody (ab63929), α-smooth muscle actin (α-SMA) polyclonal antibody (ab5694) and fibronectin (FN) polyclonal antibody (ab2413) were purchased from Abcam. Phospho-Histone H3 (p-H H3) polyclonal antibody (SC-8656-R) was purchased from Santa Cruz. Horseradish peroxidase (HRP)-conjugated secondary antibodies (111-035-003) and fluorescence-conjugated anti-rabbit secondary antibodies (111-165-144) were purchased from Jackson. PrimeScriptTM RT reagent Kit (RR037A) were purchased from TaKaRa, SYBR Select Master Mix (473369) were purchased from Invitrogen, Life Technologies.
Rats
Sprague Dawley rats aged 6-8 weeks (150-180 g) were purchased from Shanghai Laboratory Animal Center, CAS (SLACCAS), Shanghai, China. All animals were housed in individual and standard cages under controlled environment with temperature control (22-24°C) and 12 h/12 h light/dark cycle, and were given ad libitum access to standard chow and water. All experimental protocols were previously reviewed and approved by the Ethics Committee for Animal Experimentation of Shanghai Jiao Tong University.
Experimental model of renal IRI
Animals were further randomly divided into AIKI group (n=64), sham group (n=64), PIF+AIKI group (n=64) and PIF+ sham group (n=24). Rats in AIKI group and PIF+AIKI group were intraperitoneally anesthetized with pentobarbital sodium (Merck) at 40 mg/kg, then a midline incision was made, and bilateral renal pedicles were cross-clamped for 45 min. Rats in sham group and PIF+ sham group received renal pedicle separation without clamping. During the whole procedures, animals were kept well hydrated with saline and at a constant temperature (37°C) with a heating pad. The clamps were removed at 45 min after ischemia. Then, the wound was closed, and animals were placed back to cages with free access to food and water. All the procedures were performed under a sterilized condition.
Pifithrin-α treatment
Rats in PIF+AIKI group and PIF+ sham group were intraperitoneally pretreated with pifithrin-α at 3 mg/kg before surgery as well as 3 days and 14 days after reperfusion.
Sample collection
Eight rats were randomly selected from AIKI group, sham group and PIF+AIKI group, and three rats from PIF+ sham group and sacrificed at 2 h, 6 h, 24 h, 48 h, 72 h, 1 week, 2 weeks and 4 weeks of reperfusion. In brief, rats were intraperitoneally anesthetized with pentobarbital sodium, and venous blood (2 ml) was obtained and transferred into Eppendorf tubes. The kidneys were collected, washed in saline and separated along the longitudinal axis. Half of kidneys were fixed in 4% paraformaldehyde (Sigma) and the remaining kidney tissues were stored in liquid nitrogen.
Determination of serum creatinine (Scr)
Serum was collected from blood by centrifugation at 2,000 rpm for 10 min, and the serum creatinine concentration were measured with an automatic biochemical analyzer (HITACHI 7180).
Reverse Transcription-PCR (RT-PCR)
Total RNA from the kidney cortex was isolated with TRIzol reagent (Invitrogen), and subsequently reverse transcribed into cDNA using PrimeScriptTM RT reagent Kit. Quantitative polymerase chain reaction (qPCR) was performed in Light Cycler® 96 qPCR machine (Roche) using SYBR Select Master Mix. The mRNA expression of target genes was normalized to that of glyceraldehyde-3-phosphate dehydrogenase (GAPDH). The primers used in PCR were as follows: NGAL: 5’CCGACACTGACTACGACCAG’3 and 5’CATTGGTCGGTGGGAACAGA’3; GAPDH: 5’AAGGGCTCATGACCACAGTC’3 and 5’GGATGCAGGGATGATGTTCT’3; α-SMA: 5’GGC-ATCCACGAAACCACCT’3 and 5’CCGCCGATCCAGACAGAAT’3; and FN: 5’ATCTCCTCCCATCCACTCAA’3 and 5’AAACAGCCAGGCTTGCTCTGA’3.
Tubulointerstitial injury scoring
The paraformaldehyde-fixed renal tissues were dehydrated in alcohol and embedded in paraffin. 3-μm sections were obtained, deparaffinized and stained with hemotoxylin and eosin (H&E) using standard methods. Histological examination was performed by a renal pathologist in a blinded fashion. Tubulointerstitial injury was defined as tubular atrophy, dilatation, brush border loss, cellular infiltration, and widening of the interstitium. The degree of tubulointerstitial injury in the cortex was determined using a semiquantitative grade scale, where 0=no abnormality, 1=minimal damage (involvement of less than 25% of cortex), 2=mild damage (25%-50%), 3=moderate damage (50%-75%), and 4=severe damage (>75%). Two sections were randomly selected from each animal and ten fields were randomly selected at a magnification of 400× from each section under a light microscope (Leica DM2500) [12].
Immunohistochemistry
The 3-μm paraffin-embedded sections were conventionally deparaffinized, hydrated, and then treated with 3% hydrogen peroxide in methanol to inactivate the peroxide enzyme. After antigen retrieval in citrate buffer, sections were blocked with 3% bovine serum albumin. Sections were incubated with p-H H3 polyclonal antibody (1:400) overnight at 4°C. After washing in PBS, sections were treated with HRP-conjugated secondary antibodies (1:200) at 37°C for 45 min. After washing in PBS, sections were stained with DAB. The positive cells were counted (exclusion of glomerular and renal vessels) at a magnification of 400× under the Leica microscope (DM2500). Ten non-overlapping fields were randomly selected from the cortex of each section, and the average was calculated for further analysis.
Cell culture and main reagent
The normal rat kidney cells NRK-52E (CRL-1571) were purchased from the American Type Culture Collection. Cells were cultured as described previously [13]. Briefly, NRK-52E cells were cultured in Dulbecco’s modified Eagle’s medium (DMEM, GIBCO) containing 5% fetal bovine serum (FBS) and 4 mM L-glutamine at 37°C in an environment containing 95% air and 5% CO2 (Thermo HERACELL 150i).
TNF-α induced acute injury to NRK-52E cells
TNF-α is a cell signaling protein involved in systemic inflammation. It has been used as one of cytokines reflecting acute injury. NRK-52E cells were seeded into 6-well plates (3×10⁵/well) and incubated until the confluence reached 80%. The cells were maintained in serum-free DMEM for 6 h, and then treated with 10 ng/ml TNF-α for 0, 6, 12 and 24 h. The injury was evaluated by determining the protein expression of NGAL, a biomarker of kidney injury [14], by RT-PCR and immunofluorescent staining.
Fluorescence-activated cell sorting for cell cycle distribution
NRK-52E cells were prepared for propidium iodide (Sigma) staining according to standard protocols. DNA content was determined with a FACSCaliber (Becton Dickinson FACScan) Analyzer. Through ultraviolet-MoFlo sorting (DakoCytomation High Speed MoFlo Sorter), cells in G0/G1 or G2/M phase were isolated.
Immunofluorescent staining
NRK-52E cells were fixed in 4% paraformaldehyde in PBS at room temperature for 30 min. Cells were then blocked in PBS with 1% bovine serum albumin (BSA), 4% normal serum and 0.4% TritonX100 for 30 min. Then, these cells were incubated with NGAL polyclonal antibody (1:200), α-SMA polyclonal antibody (1:100) or FN polyclonal antibody (1:2,000) for 2 h at room temperature. Subsequently, cells were treated with fluorescence-conjugated anti-rabbit secondary antibodies. Cells morphology was visualized under a fluorescence microscope (Leica DM2500).
Statistical analysis
Statistical analysis was performed with SAS version 6.12. All data are expressed as mean ± standard deviation. The Student’s t-test was used for comparisons between groups, and one-way ANOVA for multiple groups. A value of P<0.05 was considered statistically significant.
Results
Percentage of renal tubular epithelial cells in M phase
Cells in M phase can be labeled by p-H H3, and thus the percentage of renal tubular epithelial cells in M phase was determined after p-H H3 immunohistochemistry. The tubular epithelial cells in M phase increased significantly at 2 h to 72 h after ischemia/reperfusion, while p53 inhibitor pifithrin-α decreased the these cells (Figure 1; Table 1).
Figure 1.

Immunohistochemistry for p-H H3 in renal tubular epithelial cells (400×). Immunohistochemistry for p-H H3 was performed in renal tubular epithelial cells after 2-h, 6-h, 24-h, 48-h and 72-h reperfusion. Tubular epithelial cells in M phase increased significantly at 2 h to 72 h after ischemia/reperfusion, while p53 inhibitor pifithrin-α decreased these cells.
Table 1.
Percentage of p-H H3 positive cells in four groups (%)
| Time point | Sham (n=8) | AIKI (n=8) | PIF+ Sham (n=3) | PIF+AIKI (n=8) |
|---|---|---|---|---|
| 2 h | 1.61 ± 0.56 | 19.63 ± 4.03* | 1.22 ± 0.14 | 14.95 ± 4.16#,§ |
| 6 h | 1.51 ± 0.50 | 16.29 ± 4.77* | 1.08 ± 0.14 | 11.99 ± 3.15# |
| 24 h | 1.26 ± 0.36 | 7.56 ± 4.08* | 0.91 ± 0.22 | 5.46 ± 1.92# |
| 48 h | 1.13 ± 0.36 | 5.33 ± 2.37* | 1.18 ± 0.48 | 4.81 ± 1.54# |
| 72 h | 0.98 ± 0.28 | 2.84 ± 0.82* | 0.95 ± 0.39 | 3.92 ± 1.46# |
| 1 w | 1.26 ± 0.40 | 0.99 ± 0.26 | 0.98 ± 0.42 | 1.88 ± 1.15 |
| 2 w | 0.95 ± 0.28 | 0.81 ± 0.28 | 1.10 ± 0.38 | 1.09 ± 0.51 |
| 4 w | 0.86 ± 0.34 | 1.01 ± 0.21 | 1.03 ± 0.35 | 1.35 ± 0.47 |
P<0.05 vs Sham group;
P<0.05 vs PIF+ Sham group;
P<0.05 vs AIKI group.
Change in the degree of renal injury
To investigate the degree of renal injury, the serum creatinine (Table 2) was measured, NGAL mRNA expression was detected in kidney tissues by RT-PCR (Table 3), and the tubulointerstitial injury was scored (Figure 2; Table 4). Renal tubular epithelial damage could be caused by renal ischemia/reperfusion in rats, but pifithrin-α improved the damage or promoted the recovery.
Table 2.
Serum creatinine of four groups (μmol/L)
| Time point | Sham (n=8) | AIKI (n=8) | PIF+ Sham (n=3) | PIF+AIKI (n=8) |
|---|---|---|---|---|
| 2 h | 15.13 ± 2.47 | 45.25 ± 12.21* | 15.00 ± 1.79 | 46.25 ± 8.75# |
| 6 h | 15.07 ± 2.53 | 57.88 ± 26.61* | 12.67 ± 1.37 | 29.14 ± 9.99#,§ |
| 24 h | 11.13 ± 2.90 | 60.29 ± 15.27* | 13.67 ± 1.63 | 28.13 ± 14.34§ |
| 48 h | 14.50 ± 1.85 | 61.38 ± 32.73* | 17.67 ± 1.37 | 28.00 ± 9.06§ |
| 72 h | 17.88 ± 1.89 | 25.71 ± 6.55* | 16.33 ± 2.58 | 19.86 ± 2.04§ |
| 1 w | 19.63 ± 2.45 | 17.25 ± 2.38 | 16.67 ± 0.52 | 18.00 ± 2.25 |
| 2 w | 18.13 ± 2.38 | 18.88 ± 5.67 | 18.60 ± 1.34 | 17.00 ± 1.31 |
| 4 w | 17.13 ± 2.36 | 17.88 ± 2.90 | 18.00 ± 3.23 | 16.75 ± 4.44 |
P<0.05 vs Sham group;
P<0.05 vs PIF+ Sham group;
P<0.05 vs AIKI group.
Table 3.
NGAL mRNA expression in kidney tissues of four groups (2-ΔΔCT)
| Time point | Sham (n=8) | AIKI (n=8) | PIF+ Sham (n=3) | PIF+AIKI (n=8) |
|---|---|---|---|---|
| 2 h | 0.32 ± 0.07 | 2.00 ± 0.47* | 0.41 ± 0.17 | 1.41 ± 0.25# |
| 6 h | 0.42 ± 0.10 | 5.43 ± 1.84* | 0.32 ± 0.15 | 3.48 ± 1.09#,§ |
| 24 h | 0.40 ± 0.14 | 6.98 ± 2.98* | 0.56 ± 0.47 | 3.29 ± 1.93#,§ |
| 48 h | 0.33 ± 0.10 | 5.84 ± 2.56* | 0.56 ± 0.41 | 3.30 ± 2.37#,§ |
| 72 h | 0.43 ± 0.16 | 5.79 ± 2.29* | 0.33 ± 0.09 | 3.35 ± 2.21#,§ |
| 1 w | 0.46 ± 0.14 | 5.90 ± 2.23* | 0.25 ± 0.12 | 3.37 ± 1.79#,§ |
| 2 w | 0.56 ± 0.34 | 2.32 ± 0.79* | 0.28 ± 0.16 | 2.89 ± 2.22# |
| 4 w | 0.27 ± 0.11 | 1.55 ± 0.81* | 0.25 ± 0.22 | 2.17 ± 1.50# |
P<0.05 vs Sham group;
P<0.05 vs PIF+ Sham group;
P<0.05 vs AIKI group.
Figure 2.

H&E staining of renal tissues in four groups (400×). Rats of AIKI group and PIF+AIKI group were subjected to bilateral renal pedicle clamping for 45 min, and rats of PIF+AIKI group and PIF+ Sham group were treated with pifithrin-α. H&E staining was performed after 2-h, 6-h, 24-h, 48-h and 72-h reperfusion respectively.
Table 4.
Tubulointerstitial injury scores of four groups
| Time points | Sham (n=8) | AIKI (n=8) | PIF+ Sham (n=3) | PIF+AIKI (n=8) |
|---|---|---|---|---|
| 2 h | 0.16 ± 0.07 | 1.15 ± 0.28* | 0.63 ± 0.26* | 2.06 ± 0.53#,§ |
| 6 h | 0.19 ± 0.10 | 1.95 ± 0.50* | 1.07 ± 0.21* | 1.96 ± 0.46# |
| 24 h | 0.15 ± 0.08 | 2.98 ± 0.47* | 0.53 ± 0.21* | 1.70 ± 0.29#,§ |
| 48 h | 0.16 ± 0.07 | 3.49 ± 0.30* | 0.27 ± 0.15 | 1.74 ± 0.30#,§ |
| 72 h | 0.16 ± 0.09 | 3.01 ± 0.47* | 0.23 ± 0.06 | 1.66 ± 0.28#,§ |
| 1 w | 0.18 ± 0.09 | 2.49 ± 0.44* | 0.13 ± 0.06 | 1.63 ± 0.33#,§ |
| 2 w | 0.16 ± 0.09 | 2.21 ± 0.54* | 0.17 ± 0.12 | 0.83 ± 0.16#,§ |
| 4 w | 0.17 ± 0.09 | 1.58 ± 0.38* | 0.17 ± 0.12 | 0.46 ± 0.18#,§ |
P<0.05 vs Sham group;
P<0.05 vs PIF+ Sham group;
P<0.05 vs AIKI group.
α-SMA and FN expression
In order to evaluate the role of ECM in the repair from renal tubular injury after renal ischemia/reperfusion, the mRNA expression of ECM associated markers (α-SMA and FN) was detected by RT-PCR. Results showed α-SMA mRNA expression was up-regulated signific-antly after ischemia/reperfusion, while p53 inhibitor pifithrin-α down-regulatedα-SMA mRNA expression (Table 5). Similar trend was also observed in FN mRNA expression although there was no significant difference (Table 6).
Table 5.
α-SMA mRNA expression of four groups (2-ΔΔCT)
| Time points | Sham (n=8) | AIKI (n=8) | PIF+ Sham (n=3) | PIF+AIKI (n=8) |
|---|---|---|---|---|
| 2 h | 0.46 ± 0.25 | 1.62 ± 0.34* | 0.42 ± 0.13 | 1.39 ± 0.26# |
| 6 h | 0.43 ± 0.13 | 2.05 ± 1.07* | 0.37 ± 0.24 | 1.56 ± 0.63# |
| 24 h | 0.32 ± 0.13 | 2.33 ± 1.10* | 0.40 ± 0.20 | 0.75 ± 0.19#,§ |
| 48 h | 0.34 ± 0.09 | 1.07 ± 0.27* | 0.50 ± 0.30 | 0.63 ± 0.36 |
| 72 h | 0.25 ± 0.06 | 0.82 ± 0.33* | 0.53 ± 0.25* | 0.57 ± 0.05 |
| 1 w | 0.30 ± 0.16 | 0.60 ± 0.16* | 0.44 ± 0.19 | 0.69 ± 0.31 |
| 2 w | 0.41 ± 0.21 | 0.78 ± 0.31* | 0.48 ± 0.38 | 0.69 ± 0.32 |
| 4 w | 0.30 ± 0.08 | 0.59 ± 0.29* | 0.32 ± 0.15 | 0.66 ± 0.29 |
P<0.05 vs Sham group;
P<0.05 vs PIF+ Sham group;
P<0.05 vs AIKI group.
Table 6.
FN mRNA expression of four groups (2-ΔΔCT)
| Time points | Sham (n=8) | AIKI (n=8) | PIF+ Sham (n=3) | PIF+AIKI (n=8) |
|---|---|---|---|---|
| 2 h | 1.07 ± 0.21 | 0.57 ± 0.16* | 0.71 ± 0.36 | 0.60 ± 0.16 |
| 6 h | 0.92 ± 0.37 | 0.50 ± 0.09* | 0.78 ± 0.15 | 0.76 ± 0.23 |
| 24 h | 1.41 ± 0.35 | 1.44 ± 0.71 | 1.07 ± 0.36 | 0.90 ± 0.25 |
| 48 h | 1.16 ± 0.24 | 1.60 ± 0.93 | 1.04 ± 0.30 | 1.39 ± 0.48 |
| 72 h | 1.56 ± 0.23 | 3.27 ± 1.43 | 1.33 ± 0.24 | 2.98 ± 1.59 |
| 1 w | 2.28 ± 0.57 | 3.02 ± 1.22 | 1.98 ± 0.88 | 2.65 ± 1.22 |
| 2 w | 1.81 ± 0.40 | 2.30 ± 0.86 | 1.65 ± 0.40 | 1.83 ± 0.90 |
| 4 w | 1.66 ± 0.52 | 2.20 ± 0.89 | 1.39 ± 0.32 | 1.57 ± 0.78 |
P<0.05 vs Sham group.
Cell cycle distribution of NRK-52E cells treated with pifithrin-α
NRK-52E cells were treated with different concentrations of pifithrin-α for 2 h, 6 h, 12 h and 24 h, and cell cycle distribution was detected. The percentage of NRK-52E cells in G2/M phase after treatment with pifithrin-α decreased gradually (Table 7).
Table 7.
Percentage of NRK-52E cells in G2/M phase after pifithrin-α treatment (%)
| 2 h | 6 h | 12 h | 24 h | |
|---|---|---|---|---|
| Sham | 29.23 ± 1.51 | 30.30 ± 3.36 | 18.45 ± 2.08 | 18.16 ± 2.24 |
| TNF-α 10 ng/ml | 25.00 ± 4.68 | 29.96 ± 2.74 | 16.53 ± 1.91 | 16.76 ± 1.46 |
| TNF-α 10 ng/ml+PIF-α 5 μg/ml | 27.12 ± 4.56 | 32.49 ± 3.76 | 16.95 ± 0.21 | 19.71 ± 1.41 |
| TNF-α 10 ng/ml+PIF-α 10 μg/ml | 28.74 ± 1.53 | 33.19 ± 2.76 | 14.63 ± 1.23 | 15.45 ± 1.43 |
| TNF-α 10 ng/ml+PIF-α 20 μg/ml | 27.60 ± 0.69 | 31.12 ± 4.49 | 11.71 ± 0.88# | 20.41 ±2.10 |
| TNF-α 10 ng/ml+PIF-α 40 μg/ml | 20.60 ± 0.18# | 24.43 ± 0.47* | 12.74 ± 0.89* | 17.19 ± 1.28 |
P<0.05 vs Sham group, n=3;
P<0.01 vs Sham group, n=3.
NGAL expression of NRK-52E cells treated with pifithrin-α
After NRK-52E cells were treated with TNF-α for 2 h to 24 h, NGAL mRNA expression gradually increased. After NRK-52E cells were treated with pifithrin-α for 6 h, NGAL mRNA expression was significantly lower than in cells without pifithrin-α treatment (Figure 3). After NRK-52E cells were treated with pifithrin-α for 24 h, the NGAL immunofluorescence intensity was lower than in cells without pifithrin-α treatment (Figure 4).
Figure 3.

NGAL mRNA expression in NRK-52E cells treated with pifithrin-α. NRK-52E cells with/without TNF-α treatment were incubated with different concentration of pifithrin-α for 2 h, 6 h, 12 h and 24 h. NGAL mRNA expression in NRK-52E cells was measured By RT-PCR (If the groups had not the same letters, P<0.05, n=3).
Figure 4.
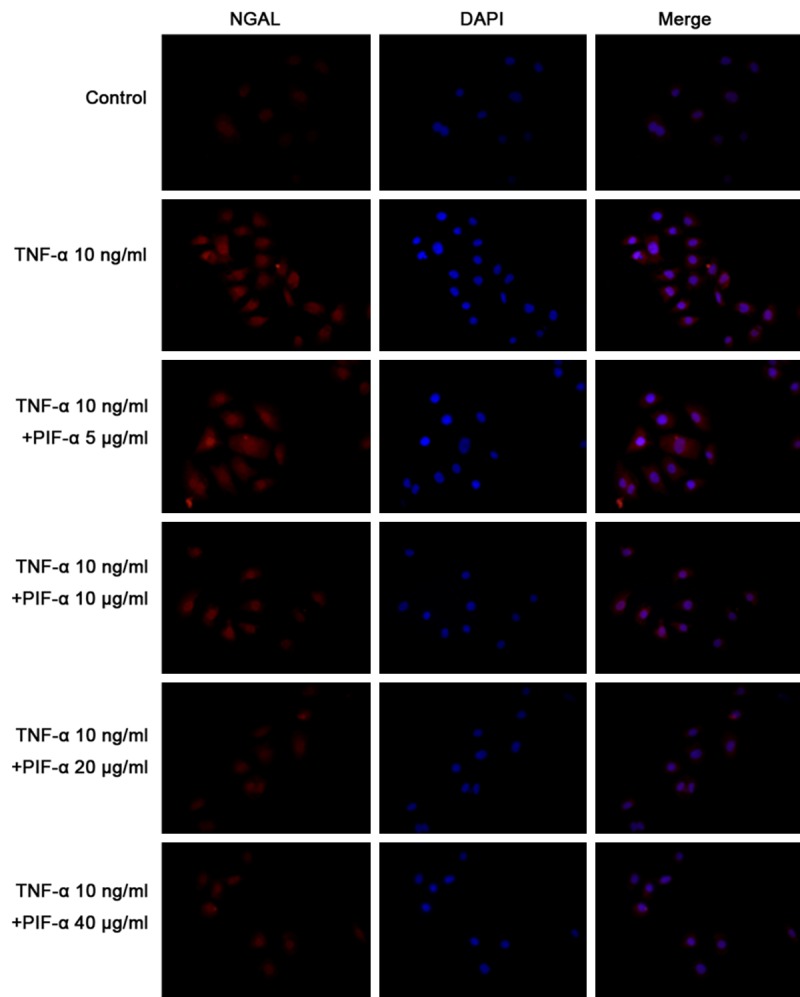
NGAL immunofluorescence staining in cells treated with pifithrin-α (400×). NRK-52E cells with/without TNF-αtreatment were incubated with different concentration of pifithrin-α for 2 h, 6 h, 12 h and 24 h. NGAL immunofluorescence staining was performed in NRK-52E cells. After NRK-52E cells were treated with pifithrin-α for 24 h, the NGAL immunofluorescence intensity was lower than in cells without pifithrin-α treatment.
α-SMA expression in NRK-52E cells treated with pifithrin-α
After NRK-52E cells were treated by TNF-α for 6 h or 24 h, α-SMA mRNA expression significantly increased. After NRK-52E cells were treated with TNF-α and pifithrin-α for 24 h, α-SMA mRNA expression significantly reduced when compared with cells without pifithrin-α treatment (Figure 5). After NRK-52E cells were treated with TNF-α and pifithrin-α for 24 h, the α-SMA immunofluorescence intensity was lower than in cells without pifithrin-α treatment (Figure 6).
Figure 5.

α-SMA mRNA expression in NRK-52E cells treated with pifithrin-α. NRK-52E cells with/without TNF-α treatment were incubated with different concentrations of pifithrin-α for 2 h, 6 h, 12 h and 24 h. α-SMA mRNA expression was measured in NRK-52E cells. (If the groups had different letters (A-C), P<0.05).
Figure 6.

α-SMA immunofluorescence staining of cells treated with pifithrin-α (400×). NRK-52E cells with/without TNF-α treatment were incubated with different concentrations of pifithrin-α for 2 h, 6 h, 12 h and 24 h. α-SMA immunofluorescence intensity of NRK-52E cells was measured. After NRK-52E cells were treated with TNF-α and pifithrin-α for 24 h, α-SMA immunofluorescence intensity was lower than in cells without pifithrin-α treatment.
FN expression in NRK-52E cells treated with pifithrin-α
After NRK-52E cells were treated with TNF-α for 24 h, FN mRNA expression significantly increased. After NRK-52E cells were treated with TNF-α and pifithrin-α for 24 h, FN mRNA expression was significantly lower than in cells without pifithrin-α treatment (Figure 7). After NRK-52E cells were treated with TNF-α and pifithrin-α for 24 h, α-SMA immunofluorescence intensity was lower than in cells without pifithrin-α treatment (Figure 8).
Figure 7.

FN mRNA expression in NRK-52E cells treated with pifithrin-α. NRK-52E cells with/without TNF-α treatment were incubated with different concentrations of pifithrin-α for 2 h, 6 h, 12 h and 24 h. FN mRNA expression of NRK-52E cells was measured (If the groups had different letters (A-C), P<0.05).
Figure 8.

FN immunofluorescence staining of cells treated with pifithrin-α (400×). NRK-52E cells with/without TNF-α treatment were incubated with different concentrations of pifithrin-α for 2 h, 6 h, 12 h and 24 h. FN immunofluorescence intensity of NRK-52E cells was measured. After NRK-52E cells were treated with TNF-α and pifithrin-α for 24 h, α-SMA immunofluorescence intensity was lower than in cells without pifithrin-α treatment.
Discussion
Kidney injury and tissue repair are dynamic events in the progression and regression of kidney disease [7]. Regeneration of damaged tubular epithelial cells has been found to occur mainly from populations of surviving epithelial cells post injury. These surviving tubular epithelial cells may proliferate and produce new cells or even dedifferentiate and reenter the cell cycle [7]. Acute renal injury may result in cell necrosis, apoptosis, and detachment of cells, leading to the denudation of the tubular basement membrane. The repair process is accomplished by the migration of new cells into the injured area, reconstituting a functional tubular epithelium [15].
Surviving renal tubular epithelial cells quickly enter the cell cycle, start the repair process, and achieve renal tubular regeneration through the precise, orderly, correct cell cycle regulation. Renal tubular epithelial cells enter the G1, S, G2 or M phases and the cell cycle orderly progresses through the regulation by a series of cycle related genes and molecules. If the cell cycle is arrested, tubular epithelial cells will not enter the following phase of cell cycle, the cell apoptosis and proliferation balance will be disrupted, and the repair after chronic injury or hyperplasia may induce renal fibrosis, resulting in CKD. Therefore, the cell cycle progression plays an extremely important role in the renal tubular repair [3,11,16]. Thus, this study was undertaken to investigate the renal tubular epithelial cell cycle after AKI in rats.
P-H H3 as a DNA binding protein can be used to label cells in M (mitosis) phase [17-19]. In this study, the renal tubular epithelial cells in M phase were investigated after AIKI by p-H H3 immunohistochemistry. Results showed tubular epithelial cells in M phase increased significantly at 2 h to 72 h after ischemia/reperfusion, showing that the renal tubular epithelial cells remain in M phase. Cells in G2/M phase may be crucial the renal tubular damage repair. G2/M checkpoint is usually activated by DNA damage, which may prevent the entry of cells with into cell cycle. This process is associated with ATM/Chk2/Cdc25 signaling pathway and/or ATR/Chk1/Cdc25 signaling pathway [20,21].
An important feature of the maladaptive repair after severe injury is the presence of cell cycle arrest in G2/M phase [22]. There is a subsequent activation of DNA repair response with the occurrence of a secretory phenotype whereby profibrotic factors are released [22]. After severe injury, the proximal tubule cellular response is impaired and its proliferative response is altered due to cell cycle arrest in G2/M phase, resulting in the production of profibrotic factors including cytokines, growth factors and matrix proteins [23]. Therefore, measure was taken in the present study to promote the cell cycle progression through the G2/M phase, in order to understand the degree of kidney damage and the fibrosis.
p53 can inhibit cell proliferation and promote cell apoptosis. Pifithrin-α, a p53 specific inhibitor, is able to promote cell cycle progression by blocking the p53 protein in the nucleus [24]. In this study, pifithrin-α was used to promote the progression of renal tubular epithelial cells through G2/M phase, which promotes renal tubular epithelial cells, attenuates cell damage and therefore reduces renal fibrosis.
Kailong et al found that the p53 inhibition was able to promote the progression of renal tubular epithelial cells from G2 phase to M phase, and prevent the renal interstitial cells against fibrosis in ischemic AKI mice [25]. Yang et al demonstrated that G2/M-arrested proximal tubular cells activated c-jun NH2-terminal kinase (JNK) signaling to up-regulate the production of profibrotic cytokines; treatment with a JNK inhibitor, or bypassing the G2/M arrest by administration of a p53 inhibitor or the removal of the contralateral kidney, rescued fibrosis in the unilateral ischemic injured kidney in ischemic, toxic and obstructive mouse model of AKI [26]. Chiara et al used histone deacetylase inhibitor methyl-4-(phenylthio) butanoate to treat zebrafish larvae and mice at 24-48 h after AKI [27]. In zebrafish, treatment with this compound increased the larval survival and the proliferation of renal tubular epithelial cells. In mice, treatment accelerated recovery, reduced postinjury tubular atrophy and interstitial fibrosis, and increased the regenerative capacity of actively cycling renal tubular cells by decreasing cells with G2/M arrest.
The specific mechanism of G2/M arrest and renal tubular epithelial cells fibrosis following AIKI is unclear now. It may be related to the renal tubular epithelial cell dedifferentiation after serious renal tubular damage, which may produce bioactive molecules, be harmful to the renal tubules and cause fibrosis by autocrine and paracrine [28-30]. De Borst et al found JNK activation correlated strongly with interstitial macrophage accumulation, renal inflammation, tubulointerstitial fibrosis, and renal dysfunction [31]. The G2/M arrest in proximal tubular cells may activate JNK signaling pathway, and increase the production of fibrosis related cytokines [25]. However, the specific role of G2/M arrest in the renal tubular epithelial cell damage and repair remains to be further elucidated.
In conclusion, our results show pifithrin-α is able to promote the progression of renal tubular epithelial cells through G2/M phase, and improve the renal tubular epithelial cell injury and repair. Thus, G2/M phase plays an important role in the renal tubular epithelial cells damage and repair.
Acknowledgements
This work was supported by Chinese National Natural Science Foundation (No: 81370813 to Wen-Yan Huang) and Scientific Research innovation projects of Shanghai Municipal Education Commission (13ZZ013 to Wen-Yan Huang). We would also like to thank the Department of Central Laboratory, Shanghai Children’s Hospital, Shanghai Jiao Tong University, China.
Disclosure of conflict of interest
None.
References
- 1.Singbartl K, Kellum JA. AKI in the ICU: definition, epidemiology, risk stratification, and outcomes. Kidney Int. 2012;81:819–825. doi: 10.1038/ki.2011.339. [DOI] [PubMed] [Google Scholar]
- 2.Goldstein SL. Acute kidney injury in children and its potential consequences in adulthood. Blood Purif. 2012;33:131–137. doi: 10.1159/000334143. [DOI] [PubMed] [Google Scholar]
- 3.Bonventre JV, Yang L. Cellular pathophysiology of ischemic acute kidney injury. J Clin Invest. 2011;121:4210–4221. doi: 10.1172/JCI45161. [DOI] [PMC free article] [PubMed] [Google Scholar]
- 4.Garzotto F, Piccinni P, Cruz D, Gramaticopolo S, Dal Santo M, Aneloni G, Kim JC, Rocco M, Alessandri E, Giunta F, Michetti V, Iannuzzi M, Belluomo Anello C, Brienza N, Carlini M, Pelaia P, Gabbanelli V, Ronco C. RIFLE-based data collection/management system applied to a prospective cohort multicenter Italian study on the epidemiology of acute kidney injury in the intensive care unit. Blood Purif. 2011;31:159–171. doi: 10.1159/000322161. [DOI] [PubMed] [Google Scholar]
- 5.Coca SG, Yusuf B, Shlipak MG, Garg AX, Parikh CR. Long-term risk of mortality and other adverse outcomes after acute kidney injury: a systematic review and meta-analysis. Am J Kidney Dis. 2009;53:961–973. doi: 10.1053/j.ajkd.2008.11.034. [DOI] [PMC free article] [PubMed] [Google Scholar]
- 6.Bagshaw SM, Bellomo R, Devarajan P, Johnson C, Karvellas CJ, Kutsiogiannis DJ, Mehta R, Pannu N, Romanovsky A, Sheinfeld G, Taylor S, Zappitelli M, Gibney RT. [Review article: Acute kidney injury in critical illness] . Can J Anaesth. 2010;57:985–998. doi: 10.1007/s12630-010-9375-4. [DOI] [PubMed] [Google Scholar]
- 7.El Sabbahy M, Vaidya VS. Ischemic kidney injury and mechanisms of tissue repair. Wiley Interdiscip Rev Syst Biol Med. 2011;3:606–618. doi: 10.1002/wsbm.133. [DOI] [PMC free article] [PubMed] [Google Scholar]
- 8.Pakula AM, Skinner RA. Acute Kidney Injury in the Critically Ill Patient: A Current Review of the Literature. J Intensive Care Med. 2016;31:319–324. doi: 10.1177/0885066615575699. [DOI] [PubMed] [Google Scholar]
- 9.Schrier RW. Need to intervene in established acute renal failure. J Am Soc Nephrol. 2004;15:2756–2758. doi: 10.1097/01.ASN.0000141324.49873.11. [DOI] [PubMed] [Google Scholar]
- 10.Ortiz A, Ucero AC, Egido J. Unravelling fibrosis: two newcomers and an old foe. Nephrol Dial Transplant. 2010;25:3492–3495. doi: 10.1093/ndt/gfq518. [DOI] [PubMed] [Google Scholar]
- 11.Price PM, Safirstein RL, Megyesi J. The cell cycle and acute kidney injury. Kidney Int. 2009;76:604–613. doi: 10.1038/ki.2009.224. [DOI] [PMC free article] [PubMed] [Google Scholar]
- 12.Sayhan MB, Kanter M, Oguz S, Erboga M. Protective effect of Urtica dioica L. on renal ischemia/reperfusion injury in rat. J Mol Histol. 2012;43:691–698. doi: 10.1007/s10735-012-9436-9. [DOI] [PubMed] [Google Scholar]
- 13.de Larco JE, Todaro GJ. Epithelioid and fibroblastic rat kidney cell clones: epidermal growth factor (EGF) receptors and the effect of mouse sarcoma virus transformation. J Cell Physiol. 1978;94:335–342. doi: 10.1002/jcp.1040940311. [DOI] [PubMed] [Google Scholar]
- 14.Devarajan P. Review: neutrophil gelatinase-associated lipocalin: a troponin-like biomarker for human acute kidney injury. Nephrology (Carlton) 2010;15:419–428. doi: 10.1111/j.1440-1797.2010.01317.x. [DOI] [PubMed] [Google Scholar]
- 15.Benigni A, Morigi M, Remuzzi G. Kidney regeneration. Lancet. 2010;375:1310–1317. doi: 10.1016/S0140-6736(10)60237-1. [DOI] [PubMed] [Google Scholar]
- 16.Bonventre JV. Pathophysiology of AKI: injury and normal and abnormal repair. Contrib Nephrol. 2010;165:9–17. doi: 10.1159/000313738. [DOI] [PubMed] [Google Scholar]
- 17.Lopez-Sanchez N, Muller U, Frade JM. Lengthening of G2/mitosis in cortical precursors from mice lacking beta-amyloid precursor protein. Neuroscience. 2005;130:51–60. doi: 10.1016/j.neuroscience.2004.09.020. [DOI] [PubMed] [Google Scholar]
- 18.Farinetti A, Tomasi S, Foglio B, Ferraris A, Ponti G, Gotti S, Peretto P, Panzica GC. Testosterone and estradiol differentially affect cell proliferation in the subventricular zone of young adult gonadectomized male and female rats. Neuroscience. 2015;286:162–170. doi: 10.1016/j.neuroscience.2014.11.050. [DOI] [PubMed] [Google Scholar]
- 19.Jacob V, Chernyavskaya Y, Chen X, Tan PS, Kent B, Hoshida Y, Sadler KC. DNA hypomethylation induces a DNA replication-associated cell cycle arrest to block hepatic outgrowth in uhrf1 mutant zebrafish embryos. Development. 2015;142:510–521. doi: 10.1242/dev.115980. [DOI] [PMC free article] [PubMed] [Google Scholar]
- 20.Krempler A, Deckbar D, Jeggo PA, Lobrich M. An imperfect G2M checkpoint contributes to chromosome instability following irradiation of S and G2 phase cells. Cell Cycle. 2007;6:1682–1686. doi: 10.4161/cc.6.14.4480. [DOI] [PubMed] [Google Scholar]
- 21.Brown EJ, Baltimore D. Essential and dispensable roles of ATR in cell cycle arrest and genome maintenance. Genes Dev. 2003;17:615–628. doi: 10.1101/gad.1067403. [DOI] [PMC free article] [PubMed] [Google Scholar]
- 22.Bonventre JV. Maladaptive proximal tubule repair: cell cycle arrest. Nephron Clin Pract. 2014;127:61–64. doi: 10.1159/000363673. [DOI] [PubMed] [Google Scholar]
- 23.Yang L, Humphreys BD, Bonventre JV. Pathophysiology of acute kidney injury to chronic kidney disease: maladaptive repair. Contrib Nephrol. 2011;174:149–155. doi: 10.1159/000329385. [DOI] [PubMed] [Google Scholar]
- 24.Ortenzi V, Meschini R, Berni A, Mancinelli P, Palitti F. Study on X-ray-induced apoptosis and chromosomal damage in G2 human lymphocytes in the presence of pifithrin-alpha, an inhibitor of p53. Mutat Res. 2011;726:29–35. doi: 10.1016/j.mrgentox.2011.07.013. [DOI] [PubMed] [Google Scholar]
- 25.Kailong L, Du X, Yani H, Lin Z, Jvrong Y, Ruihua S, Lin C. P53-Rb signaling pathway is involved in tubular cell senescence in renal ischemia/reperfusion injury. Biocell. 2007;31:213–223. [PubMed] [Google Scholar]
- 26.Yang L, Besschetnova TY, Brooks CR, Shah JV, Bonventre JV. Epithelial cell cycle arrest in G2/M mediates kidney fibrosis after injury. Nat Med. 2010;16:535–543. doi: 10.1038/nm.2144. [DOI] [PMC free article] [PubMed] [Google Scholar]
- 27.Cianciolo Cosentino C, Skrypnyk NI, Brilli LL, Chiba T, Novitskaya T, Woods C, West J, Korotchenko VN, McDermott L, Day BW, Davidson AJ, Harris RC, de Caestecker MP, Hukriede NA. Histone deacetylase inhibitor enhances recovery after AKI. J Am Soc Nephrol. 2013;24:943–953. doi: 10.1681/ASN.2012111055. [DOI] [PMC free article] [PubMed] [Google Scholar]
- 28.Venkatachalam MA, Griffin KA, Lan R, Geng H, Saikumar P, Bidani AK. Acute kidney injury: a springboard for progression in chronic kidney disease. Am J Physiol Renal Physiol. 2010;298:F1078–1094. doi: 10.1152/ajprenal.00017.2010. [DOI] [PMC free article] [PubMed] [Google Scholar]
- 29.Li Y, Wen X, Liu Y. Tubular cell dedifferentiation and peritubular inflammation are coupled by the transcription regulator Id1 in renal fibrogenesis. Kidney Int. 2012;81:880–891. doi: 10.1038/ki.2011.469. [DOI] [PMC free article] [PubMed] [Google Scholar]
- 30.Kimura M, Asano M, Abe K, Miyazaki M, Suzuki T, Hishida A. Role of atrophic changes in proximal tubular cells in the peritubular deposition of type IV collagen in a rat renal ablation model. Nephrol Dial Transplant. 2005;20:1559–1565. doi: 10.1093/ndt/gfh872. [DOI] [PubMed] [Google Scholar]
- 31.De Borst MH, Prakash J, Sandovici M, Klok PA, Hamming I, Kok RJ, Navis G, van Goor H. c-Jun NH2-terminal kinase is crucially involved in renal tubulo-interstitial inflammation. J Pharmacol Exp Ther. 2009;331:896–905. doi: 10.1124/jpet.109.154179. [DOI] [PubMed] [Google Scholar]