Abstract
Long noncoding RNAs (lncRNAs) have been demonstrated to be dysregulated in many disease states and have pivotal roles in various pathophysiological processes. However, the expression, roles and potential mechanism of lncRNA ZEB1-AS1 in osteosarcoma are still unknown. In this study, we measured ZEB1-AS1 expression and the results showed that ZEB1-AS1 was upregulated in osteosarcoma tissues and cells. Increased expression of ZEB1-AS1 is correlated with larger tumor size, progressed Enneking stage, tumor metastasis, worse recurrence-free and overall survival of osteosarcoma patients. Functional experiments showed that enhanced expression of ZEB1-AS1 promotes osteosarcoma cells proliferation and migration. By contrast, ZEB1-AS1 knockdown inhibits osteosarcoma cells proliferation and migration. Mechanistically, ZEB1-AS1 directly binds and recruits p300 to the ZEB1 promoter region, induces an open chromatin structure, and activates ZEB1 transcription. There is a significant correlation between the expression of ZEB1-AS1 and ZEB1 in osteosarcoma tissues. ZEB1 depletion abrogates the roles of ZEB1-AS1 on the proliferation and migration of osteosarcoma cells. Collectively, these findings demonstrated that ZEB1-AS1 functions as an oncogene in osteosarcoma via epigenetically activating ZEB1 and could be a potential target for osteosarcoma treatment.
Keywords: Long noncoding RNA, oncogene, osteosarcoma, epigenetics, ZEB1
Introduction
Osteosarcoma is the most frequent type of malignant primary bone tumor deriving from bone-forming mesenchymal cells [1]. At present, the standard therapy for primary osteosarcoma is neoadjuvant and adjuvant chemotherapy combined with surgery [2,3]. Although the standard therapy advances have improved the clinical outcome of some osteosarcoma patients, the overall prognosis remains dissatisfying owing to tumor recurrence and metastases [4,5]. Thus it is urgent to understand the molecular mechanisms underlying osteosarcoma tumorigenesis and progression, and to discover novel prognostic and therapeutic targets for osteosarcoma [6].
To date, the study on molecular mechanisms of osteosarcoma has mainly focused on the deregulation and function of protein-coding genes [7,8]. However, recent studies have indicated that many non-protein-coding genes also have critical roles in various pathophysiological processes [9,10]. Among these non-protein-coding transcripts transcribed from non-protein-coding genes, long noncoding RNA (lncRNA) is a class of endogenous RNA with more than 200 nucleotides in length [11,14]. lncRNAs have been reported to be dysregulated in many disease states, particularly in tumors, and play critical roles in the control of a wide array of pathophysiological processes [15,22].
LncRNA ZEB1 Antisense 1 (ZEB1-AS1) is first reported to be upregulated in hepatocellular carcinoma, promote hepatocellular carcinoma metastasis and predict poor prognosis of hepatocellular carcinoma patients [23]. ZEB1-AS1 orients in antisense direction with respect to ZEB1, a critical transcription factor functioning in many tumors [24]. Previous studies have that shown that antisense transcripts could regulate the transcription and/or translation of their sense strand genes [25,28]. However, whether and how ZEB1-AS1 regulates ZEB1 expression remains largely unknown. Moreover, the functions and clinical significances of ZEB1-AS1 in osteosarcoma are also unknown.
In this study, we measured the expression of ZEB1-AS1 in osteosarcoma and analyzed its association with clinicopathologic characteristics and patients’ outcome. We further studied the biological function of ZEB1-AS1 in osteosarcoma using gain-of-function and loss-of-function methods. Furthermore, we investigated the molecular mechanisms through which ZEB1-AS1 promotes osteosarcoma progression.
Materials and methods
Human tissue samples
Fifty pairs of osteosarcoma tissues and corresponding adjacent normal tissues were biopsy obtained with informed consent from patients prior to any treatment at Taizhou Municipal Hospital (Taizhou, China). The tissue specimens were confirmed by histological diagnosis. This study was approved by the Review Board of Taizhou Municipal Hospital.
Cell cultures
The human normal osteoblast cell line hFOB 1.19 and osteosarcoma cell lines HOS, U-2 OS, MG-63, and Saos-2 were acquired from Cell Bank of Chinese Academy of Sciences (Shanghai, China). hFOB 1.19, HOS, MG-63, and Saos-2 cells were maintained in DMEM, and U-2 OS cells were maintained in RPMI 1640 medium. All mediums were supplemented with 10% fetal bovine serum (Gibco BRL, Gaithersburg, MD, USA) and the cells were cultured at 37°C in 5% CO2 atmosphere.
RNA extraction and quantitative reverse transcription-polymerase chain reaction (qRT-PCR)
Total RNA was extracted by the Trizol Reagent (Invitrogen, Carlsbad, CA, USA) according to the manufacturer’s protocols. Reverse transcription was performed to generate the first-strand cDNA using M-MLV Reverse Transcriptase (Invitrogen). qRT-PCR was performed using SYBR® Premix Ex Taq™ II (Takara, Dalian, China) in the StepOne Plus system (Applied Biosystems, Foster City, CA, USA) according to the manufacturer’s protocols. The expression of target gene was normalized against GAPDH. The primers used are as follows: ZEB1-AS1: 5’-CCGTGGGCACTGCTGAAT-3’ (forward) and 5’-CTGCTGGCAAGCGGAACT-3’ (reverse); ZEB1: 5’-ACTCTGATTCTACACCGC-3’ (forward) and 5’-TGTCACATTGATAGGGCTT-3’ (reverse); and GAPDH: 5’-GGTCTCCTCTGACTTCAACA-3’ (forward) and 5’-GTGAGGGTCTCTCTCTTCCT-3’ (reverse). The gene expression was calculated using the comparative Ct method.
Vectors construction
The full-length ZEB1-AS1 cDNA was PCR amplified using the Takara Ex Taq® Hot Start Version DNA Polymerase (Takara) and subcloned into the Kpn I and Xba I sites of pcDNA3.1 vector (Invitrogen). The primers used are as follows: 5’-GGGGTACCTCTCGCTTGTGTCTAAATGC-3’ (forward) and 5’-GCTCTAGACATGTTTAAAGCAGTAATTTATTCTG-3’ (reverse). pcDNA3.1 empty vector was used as negative control for ZEB1-AS1 overexpression vector (pcDNA3.1-ZEB1-AS1). The oligonucleotides for shRNA inhibiting ZEB1-AS1 expression were synthesized and inserted to the shRNA expression vector pGPH1/Neo (GenePharma, Shanghai, China). The shRNA sequences are: 5’-GACAGATGTGATCTCTGAACCTGAT-3’. A scrambled shRNA was used as negative control for shRNA-ZEB1-AS1.
Small interfering RNA (siRNA) synthesis and transfection
siRNA specifically targeting ZEB1 was synthesized by Invitrogen. The siRNA sequences for ZEB1 are: 5’-CCTGTGTGCTGTAAGTGCCATTTCT-3’. A scrambled siRNA was used as negative control for siRNA-ZEB1. Transfection was performed using Lipofectamine 3000 (Invitrogen) according to the manufacturer’s protocols.
Generation of cells stably overexpressing or depleting ZEB1-AS1
To obtain cell lines stably overexpressing ZEB1-AS1 or control, HOS cells were transfected with the pcDNA3.1-ZEB1-AS1 plasmid or pcDNA3.1 empty plasmid, and selected with neomycin for four weeks. To obtain cell lines stably depleting ZEB1-AS1 or control, Saos-2 cells were transfected with the shRNA-ZEB1-AS1 plasmid or scrambled shRNA plasmid, and selected with neomycin for four weeks. The stably overexpressing or depleting cell lines were confirmed by qRT-PCR.
Cell proliferation assays
Cell proliferation was analyzed using Cell Counting Kit-8 (CCK-8) assays and Ethynyl deoxyuridine (EdU) incorporation assays. For CCK-8 assays, a total of approximately 2.0 × 10³ cells/well was plated in 96-well plate. After culture for 24, 48, 72, and 96 hours, cell proliferation was assessed using the cell counting kit 8 (Dojindo, Kumamoto, Japan). The absorbance value at 450 nm of each well was measured. The cell growth curves were plotted using the absorbance value at each time point. EdU incorporation assays were performed with an EdU kit (Roche, Mannheim, Germany) according to the manufacturer’s protocol.
Cell migration assays
The migration potential of osteosarcoma cells was assessed using a transwell assay, which was performed in 24-well plates using poly-carbonate transwell filters (Corning, 8 μm). A sample of 1 × 10⁵ cells were seeded into the upper well. After incubation for 48 hours, cells on the upper surface of the well were scraped off with a cotton swab, and cells on the lower surface were fixed, stained and counted.
Western blot
Cell lysates were prepared in a 1 × sodium dodecyl sulfate loading buffer. Total proteins were separated by sodium dodecyl sulfate-polyacrylamide gel electrophoresis and electroblotted onto polyvinylidene fluoride membranes. After incubation with primary antibodies specific for ZEB1 or GAPDH (Abcam, Hong Kong, China), the blots were incubated with goat anti-rabbit or anti-mouse secondary antibody (Abcam) and visualized with enhanced chemiluminescence.
Chromatin immunoprecipitation (ChIP)
ChIP experiments were performed with the EZ-Magna ChIP™ A/G Chromatin Immunoprecipitation Kit (Millipore, Bedford, MA, USA) according to the manufacturer’s instructions. The antibodies used were as follows: H3K9ac antibody (Millipore), H3K27ac antibody (Millipore), H4ac antibody (Millipore), and p300 antibody (Millipore). The retrieved DNA was quantified with SYBR® Premix Ex Taq™ II (Takara) in the StepOne Plus system (Applied Biosystems). The primers specific for the ZEB1 gene promoter were as follows: 5’-GCCGAGCCTCCAACTTTAC-3’ (forward) and 5’-ACCGTGGGCACTGCTGAAT-3’ (reverse).
RNA immunoprecipitation (RIP)
RIP assays were performed with the Magna RIP™ RNA-Binding Protein Immunoprecipitation Kit (Millipore) and p300 antibody (Millipore) according to the manufacturer’s protocols. The retrieved RNA was quantified by qRT-PCR.
Chromatin isolation by RNA purification (ChIRP)
ChIRP experiments were performed using the Magna ChIRPTM RNA Interactome Kits (Millipore) according to the manufacturer’s instructions. Antisense DNA probes against ZEB1-AS1 were designed by Biosearch Probe Designer (1, 5’-Aaagccgggagtgtcgtaaa-3’; 2, 5’-Atctcattgaagtcacttcc-3’; 3, 5’-Gatgaccgctcatttaggaa-3’; 4, 5’-Tttccttattc gaaggaggt-3’; 5, 5’-Atcatcagacttcagctgta-3’; 6, 5’-Aagcaaagcaaggacaccgt-3’; 7, 5’-Tgaaggaagcttagcaggga-3’; 8, 5’-ccttactgtcaagaacaggg-3’). The retrieved DNA was quantified with SYBR® Premix Ex Taq™ II (Takara) in the StepOne Plus system (Applied Biosystems). The primers specific for the ZEB1 gene promoter were as follows: 5’-GCCGAGCCTCCAACTTTAC-3’ (forward) and 5’-ACCGTGGGCACTGCTGAAT-3’ (reverse).
Statistical analysis
All statistical analyses were performed using SPSS 18.0 software package (Chicago, IL, USA). For comparisons, Wilcoxon signed-rank test, Mann-Whitney test, Student’s t test, Pearson chi-square test, Log-rank test, and Pearson correlation analysis were performed as indicated. A P value < 0.05 was defined as statistically significant.
Results
ZEB1-AS1 is overexpressed in osteosarcoma and indicates poor prognosis of osteosarcoma patients
ZEB1-AS1 expression was measured using qRT-PCR in 50 pairs of osteosarcoma tissues and adjacent normal tissues. The results showed that ZEB1-AS1 expression level was significantly higher in osteosarcoma tissues than that in adjacent normal tissues (P < 0.001 by Wilcoxon signed-rank test) (Figure 1A). In addition, we measured ZEB1-AS1 expression in human normal osteoblast cell line hFOB 1.19 and human osteosarcoma cell lines HOS, U-2 OS, MG-63, and Saos-2 by qRT-PCR. The results showed that ZEB1-AS1 expression level was significantly higher in osteosarcoma cell lines than that in normal osteoblast cell line (Figure 1B).
Figure 1.
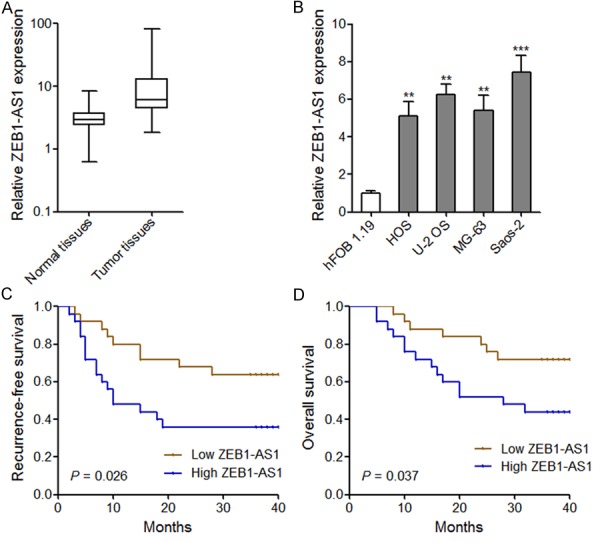
Overexpression of ZEB1-AS1 in osteosarcoma and its association with poor prognosis of osteosarcoma patients. A. ZEB1-AS1 Expression level in 50 pairs of osteosarcoma tissues and adjacent normal tissues. The expression of ZEB1-AS1 was quantified by qRT-PCR. The horizontal lines in the box plots represent the medians, the boxes represent the interquartile range, and the whiskers represent the minimum and maximum values. P < 0.001 by Wilcoxon signed-rank test. B. ZEB1-AS1 expression level in osteosarcoma cell lines and human normal osteoblast cell line. Data are shown as mean ± SD based on at least three independent experiments. **P < 0.01, ***P < 0.001 by Student’s t test. C, D. Kaplan-Meier analyses of correlations between ZEB1-AS1 expression level and recurrence-free or overall survival of osteosarcoma patients. The median expression level of ZEB1-AS1 was used as the cutoff. P values were calculated by Log-rank test.
We further analyzed the association between ZEB1-AS1 expression level and clinicopathologic characteristics of the 50 osteosarcoma patients. As shown in Table 1, higher ZEB1-AS1 expression level was significantly associated with larger tumor size (P = 0.037), advanced Enneking stage (P = 0.026), and tumor metastasis (P = 0.042). Furthermore, Kaplan-Meier survival estimates showed that higher ZEB1-AS1 expression in osteosarcoma tissues is significantly associated with shorter recurrence-free and overall survival time (Figure 1C and 1D). These results demonstrate that ZEB1-AS1 is overexpressed in osteosarcoma and its overexpression predicts poor prognosis of osteosarcoma patients. These data imply that ZEB1-AS1 may have critical roles in the pathogenesis of osteosarcoma.
Table 1.
Associations between ZEB1-AS1 expression and clinicopathologic characteristics of osteosarcoma
| Features | ZEB1-AS1 | χ2 | P value* | |
|---|---|---|---|---|
|
| ||||
| Low | High# | |||
| Age | 0.347 | 0.556 | ||
| > 20 | 10 | 8 | ||
| ≤ 20 | 15 | 17 | ||
| Gender | 0.082 | 0.774 | ||
| Male | 14 | 15 | ||
| Female | 11 | 10 | ||
| Location | 0.439 | 0.508 | ||
| Femur/Tibia | 20 | 18 | ||
| Elsewhere | 5 | 7 | ||
| Tumor size (cm) | 4.367 | 0.037 | ||
| > 8 | 5 | 12 | ||
| ≤ 8 | 20 | 13 | ||
| Enneking stage | 7.265 | 0.026 | ||
| I | 10 | 5 | ||
| II | 14 | 12 | ||
| III | 1 | 8 | ||
| Tumor metastasis | 4.153 | 0.042 | ||
| Present | 1 | 6 | ||
| Absent | 24 | 19 | ||
Median expression level was used as the cutoff. Low expression of ZEB1-AS1 in 50 patients was defined as a value below the 50th percentile. High expression of ZEB1-AS1 in 50 patients was defined as a value above the 50th percentile.
P value was acquired by Pearson chi-square test.
Overexpression of ZEB1-AS1 promotes osteosarcoma cells proliferation and migration
To investigate the biological functions of ZEB1-AS1 in osteosarcoma, we stably overexpressed ZEB1-AS1 in osteosarcoma cell line HOS (Figure 2A). CCK-8 assays and EdU incorporation assays were performed to measure cell proliferation. The growth curves determined by CCK-8 assays showed that ZEB1-AS1 overexpression promoted HOS cells proliferation (Figure 2B). Consistently, EdU incorporation assays showed that ZEB1-AS1-overexpressing HOS cells had increased number of EdU positive nuclei than control cells (Figure 2C). Furthermore, transwell assays were performed to measure the effects of ZEB1-AS1 on cell migration. The results showed that ZEB1-AS1 overexpression significantly promoted HOS cells migration (Figure 2D). These data suggest that ZEB1-AS1 could promote osteosarcoma cells proliferation and migration.
Figure 2.
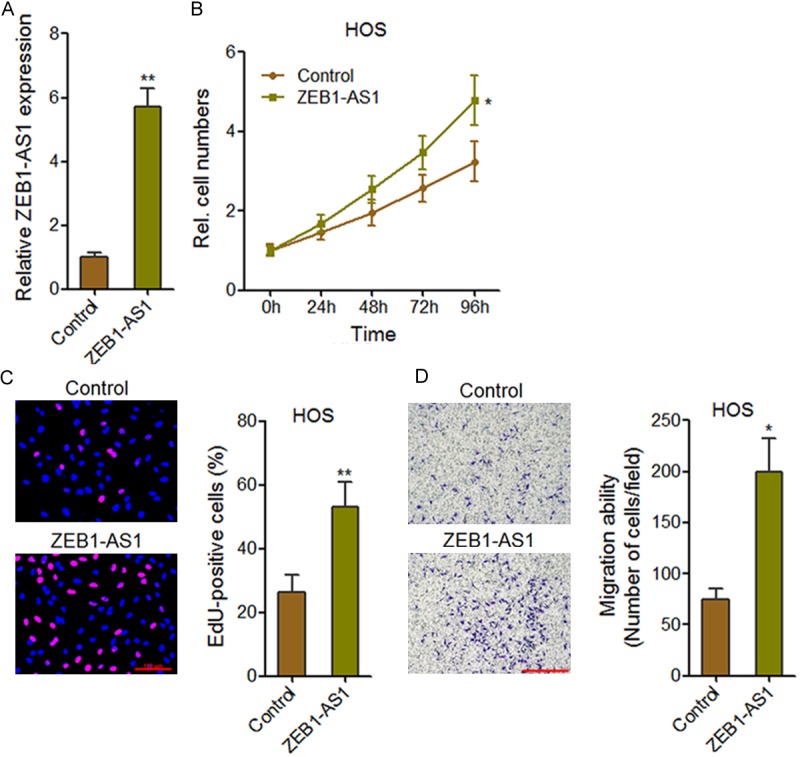
Overexpression of ZEB1-AS1 promotes osteosarcoma cell proliferation and migration. A. ZEB1-AS1 expression level in ZEB1-AS1 stably overexpressed and control HOS cells. B. ZEB1-AS1 overexpression promotes HOS cells proliferation. Cell growth curves were determined by CCK-8 assays. C. The effects of ZEB1-AS1 on HOS cells proliferation were assessed using EdU incorporation assays. The red color indicates EdU-positive nuclei. Scale bars = 100 µm. D. Transwell assays showed that ZEB1-AS1 overexpression promotes HOS cells migration. Data are shown as mean ± SD based on at least three independent experiments. *P < 0.05, **P < 0.01 by Student’s t test.
Knockdown of ZEB1-AS1 inhibits osteosarcoma cells proliferation and migration
To further confirm the biological functions of ZEB1-AS1, we stably inhibited ZEB1-AS1 expression in osteosarcoma cell line Saos-2 (Figure 3A). The growth curves determined by CCK-8 assays showed that knockdown of ZEB1-AS1 inhibited Saos-2 cells proliferation (Figure 3B). EdU incorporation assays showed that ZEB1-AS1-depleting Saos-2 cells had decreased number of EdU positive nuclei than control cells (Figure 3C). Transwell assays showed that knockdown of ZEB1-AS1 significantly inhibited Saos-2 cells migration (Figure 3D). These data further confirm the pro-proliferation and pro-migration functions of ZEB1-AS1 in osteosarcoma.
Figure 3.
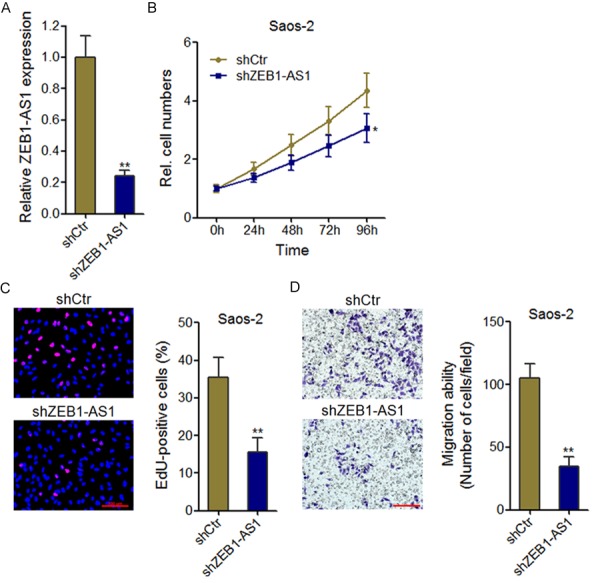
Knockdown of ZEB1-AS1 inhibits osteosarcoma cell proliferation and migration. A. ZEB1-AS1 expression level in ZEB1-AS1 stably depleted and control Saos-2 cells. B. Knockdown of ZEB1-AS1 inhibits Saos-2 cells proliferation. Cell growth curves were determined by CCK-8 assays. C. The effects of ZEB1-AS1 knockdown on Saos-2 cells proliferation were assessed using EdU incorporation assays. The red color indicates EdU-positive nuclei. Scale bars = 100 µm. D. Transwell assays showed that knockdown of ZEB1-AS1 inhibits Saos-2 cells migration. Data are shown as mean ± SD based on at least three independent experiments. *P < 0.05, **P < 0.01 by Student’s t test.
ZEB1-AS1 upregulates ZEB1 expression
ZEB1-AS1 is an antisense transcript along the ZEB1 locus, comprising promoter and part of the first exon of ZEB1, and extending further upstream (Figure 4A). Many antisense transcripts have been reported to regulate the expression of their sense strand genes transcriptionally or post-transcriptionally, such as Ube3a-ATS and Antisense Uchl1 [25,29]. To identify whether and how ZEB1-AS1 regulate ZEB1 expression, we first measured the mRNA and protein levels of ZEB1 in ZEB1-AS1 stably overexpressed HOS cells and ZEB1-AS1 stably depleted Saos-2 cells. The results showed that ZEB1-AS1 overexpression significantly increased the mRNA and protein levels of ZEB1 in HOS cells (Figure 4B and 4C). Conversely, knockdown of ZEB1-AS1 significantly decreased the mRNA and protein levels of ZEB1 in Saos-2 cells (Figure 4D and 4E).
Figure 4.
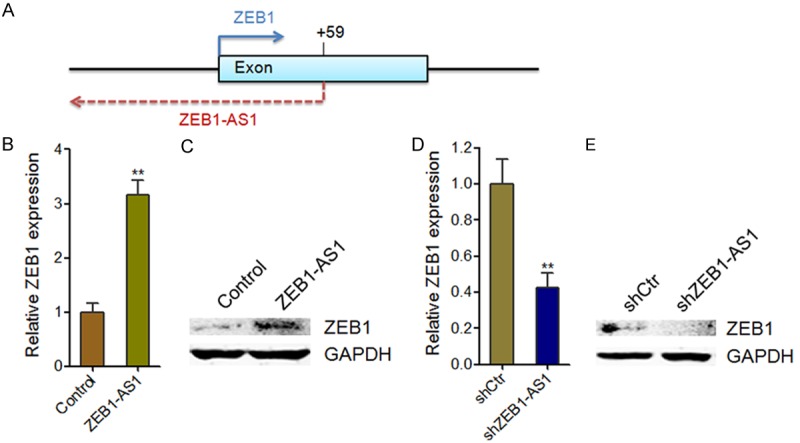
ZEB1-AS1 upregulates ZEB1 expression. A. Schematic of the human ZEB1-AS1 locus. Arrows mark transcription start sites. B. ZEB1 mRNA levels in ZEB1-AS1 stably overexpressed and control HOS cells. C. ZEB1 protein levels in ZEB1-AS1 stably overexpressed and control HOS cells. D. ZEB1 mRNA levels in ZEB1-AS1 stably depleted and control Saos-2 cells. E. ZEB1 protein levels in ZEB1-AS1 stably depleted and control Saos-2 cells. Data are shown as mean ± SD based on at least three independent experiments. **P < 0.01 by Student’s t test.
ZEB1-AS1 mediates epigenetic changes at the ZEB1 promoter
To further understand the underlying molecular mechanism by which ZEB1-AS1 upregulates ZEB1 expression, we examined the euchromatic histone markers at the ZEB1 promoter in ZEB1-AS1 stably overexpressed HOS cells and ZEB1-AS1 stably depleted Saos-2 cells. As shown in Figure 5A, the euchromatic histone markers at the ZEB1 promoter were significantly increased in ZEB1-AS1 overexpressed HOS cells compared with that in control HOS cells. The knockdown of ZEB1-AS1 significantly decr-eased the euchromatic histone markers at the ZEB1 promoter in Saos-2 cells (Figure 5B).
Figure 5.
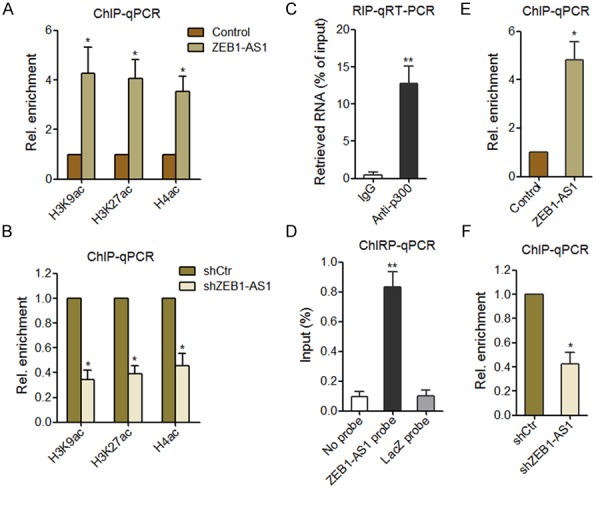
ZEB1-AS1 induces epigenetic changes at the ZEB1 promoter. A. ChIP shows the euchromatic histone marks at the ZEB1 promoter in ZEB1-AS1 stably overexpressed and control HOS cells. Data were normalized to input values and are shown in reference to control HOS cells. B. ChIP shows the euchromatic histone marks at the ZEB1 promoter in ZEB1-AS1 stably depleted and control Saos-2 cells. Data were normalized to input values and are shown in reference to control Saos-2 cells. C. RIP experiments were performed in HOS cells using an p300 antibody or nonspecific IgG, and the retrieved RNA was measured by qRT-PCR to detect ZEB1-AS1. Data are shown as percent of input. D. ChIRP experiments in HOS cells were performed with antisense probe sets against ZEB1-AS1 or LacZ (negative control), and the retrieved DNA was measured by qPCR to detect ZEB1 promoter region. Data are shown as percent of input. E. ChIP shows the occupancy of p300 on the ZEB1 promoter in ZEB1-AS1 stably overexpressed and control HOS cells. Data were normalized to input values and are shown in reference to control HOS cells. F. ChIP shows the occupancy of p300 on the ZEB1 promoter in ZEB1-AS1 stably depleted and control Saos-2 cells. Data were normalized to input values and are shown in reference to control Saos-2 cells. Data are shown as mean ± SD based on at least three independent experiments. *P < 0.05, **P < 0.01 by Student’s t test.
To identify the chromatin regulators that are recruited by ZEB1-AS1 and responsible to the changes of euchromatic histone markers at the ZEB1 promoter, we monitored the association of ZEB1-AS1 with histone acetyltransferase p300, PCAF, CBP, and Tip60 by RIP. The results showed that p300 was specifically associated with ZEB1-AS1 (Figure 5C). In support of ZEB1-AS1 recruiting p300 to the ZEB1 promoter, ChIRP assays showed that ZEB1-AS1 had a significant genomic occupancy on the ZEB1 promoter (Figure 5D). Moreover, the occupancy of p300 on the ZEB1 promoter was strongly enriched in ZEB1-AS1 overexpressed HOS cells (Figure 5E). Conversely, the occupancy of p300 on the ZEB1 promoter was strongly decreased in ZEB1-AS1 depleted Soas-2 cells (Figure 5F). These results suggest that ZEB1-AS1 associated with and recruited p300 to ZEB1 promoter, upregulated euchromatic histone markers at the ZEB1 promoter, and activated ZEB1 transcription.
ZEB1 expression level is associated with that of ZEB1-AS1 in osteosarcoma
Because ZEB1-AS1 activates the transcription of ZEB1, we investigated whether a correlation exists between ZEB1-AS1 expression level and ZEB1 mRNA level in osteosarcoma tissues. We measured ZEB1 mRNA level in the same tissues shown in Figure 1A. The results showed that ZEB1 mRNA level was significantly higher in osteosarcoma tissues than that in adjacent normal tissues (P < 0.001 by Wilcoxon signed-rank test) (Figure 6A). In addition, a statistically significant correlation was found between ZEB1 mRNA level and ZEB1-AS1 transcript level (r = 0.651, P < 0.001, Pearson’s correlation) (Figure 6B), supporting the role of ZEB1-AS1 in ZEB1 transcription.
Figure 6.
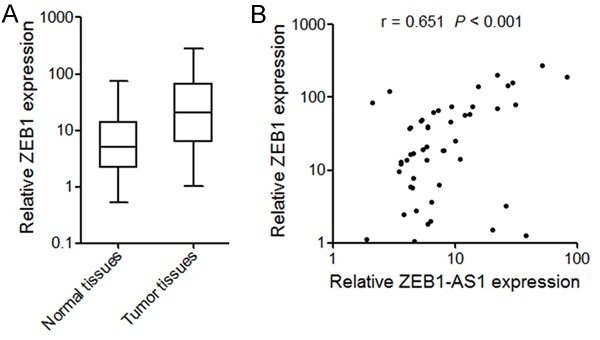
ZEB1-AS1 and ZEB1 expression levels are significantly correlated in osteosarcoma. A. ZEB1 Expression level in 50 pairs of osteosarcoma tissues and adjacent normal tissues. The expression of ZEB1 was quantified by qRT-PCR. The horizontal lines in the box plots represent the medians, the boxes represent the interquartile range, and the whiskers represent the minimum and maximum values. P < 0.001 by Wilcoxon signed-rank test. B. ZEB1-AS1 and ZEB1 expression levels are significantly correlated in these osteosarcoma tissues. r = 0.651, P < 0.001 by Pearson correlation analysis.
ZEB1 is critical for ZEB1-AS1 induced proliferation and migration
As ZEB1 has been reported to promote osteosarcoma proliferation and metastasis [30,31], and ZEB1-AS1 activates ZEB1 transcription, we next investigated whether ZEB1 is needed for ZEB1-AS1 induced proliferation and migration. We inhibited ZEB1 expression in ZEB1-AS1 stably overexpressed HOS cells by transfecting ZEB1 specific siRNAs (Figure 7A). CCK-8 assays showed that the depletion of ZEB1 abolished the pro-proliferation role of ZEB1-AS1 (Figure 7B). In accord with this result, EdU incorporation assays also showed that the depletion of ZEB1 abolished the increasing of EdU positive nuclei number in ZEB1-AS1-overexpressing HOS cells (Figure 7C). Transwell assays showed that the depletion of ZEB1 abolished the pro-migration role of ZEB1-AS1 (Figure 7D). These data suggest that ZEB1 is critical for ZEB1-AS1 induced proliferation and migration.
Figure 7.
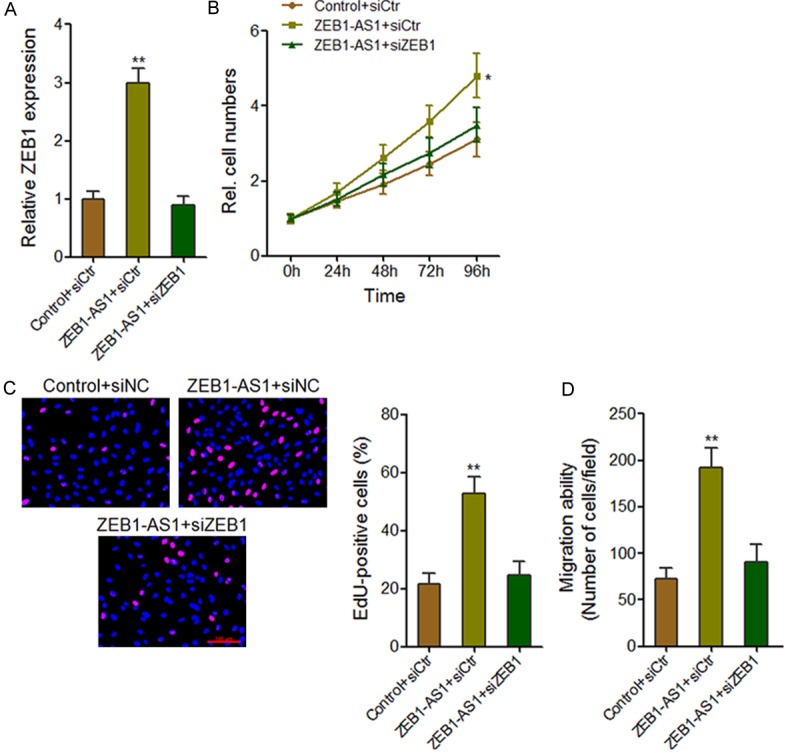
ZEB1-AS1-induced proliferation and migration are dependent on ZEB1. A. After the transfection of ZEB1specific siRNAs or control siRNAs into ZEB1-AS1 stably overexpressed HOS cells, ZEB1-AS1 expression level was measured by qRT-PCR. B. Cell growth curves determined by CCK-8 assays showed that the depletion of ZEB1 abrogated the pro-proliferation effect of ZEB1-AS1. C. EdU incorporation assays showed that the depletion of ZEB1 abrogated the pro-proliferation effect of ZEB1-AS1. The red color indicates EdU-positive nuclei. Scale bars = 100 µm. D. Transwell assays showed that the depletion of ZEB1 abrogated the pro-migration effect of ZEB1-AS1. Data are shown as mean ± SD based on at least three independent experiments. *P < 0.05, **P < 0.01 by Student’s t test.
Discussion
In this study, we found that ZEB1-AS1 is upregulated in osteosarcoma tissues and cell lines in comparison with adjacent normal tissues and normal osteoblast cell line. Increased expression of ZEB1-AS1 is associated with larger tumor size, advanced Enneking stage, and tumor metastasis. High ZEB1-AS1 expression in osteosarcoma tissues predicts worse recurrence-free and overall survival of osteosarcoma patients. Functional experiments showed that ZEB1-AS1 overexpression promotes osteosarcoma cells proliferation and migration, while ZEB1-AS1 knockdown inhibits osteosarcoma cells proliferation and migration. These data indicate that ZEB1-AS1 functions as an oncogene in osteosarcoma. These results were consistent with previous reports about the expression, function and clinical significance of ZEB1-AS1 in hepatocellular carcinoma and esophageal squamous cell carcinoma [32,33]. Combining with these reports, our results further confirm that ZEB1-AS1 is an important oncogene in tumors.
Recent evidences suggest that antisense lncRNAs usually acts as regulator of the opposite strand genes through changing the chromatin state and transcription, or interacting with the opposite strand mRNA and changing its stability and/or translation [25,26,28,34]. ZEB1-AS1 gene locus mainly overlaps the promoter of ZEB1. Consistent with this, our results showed that ZEB1-AS1 activates ZEB1 transcription. ChIRP assays showed the specific binding of ZEB1-AS1 to the ZEB1 promoter region. RIP assays showed the specific association between ZEB1-AS1 and histone acetyltransferase p300. ChIP assays further indicated that ZEB1-AS1 recruited p300 to the ZEB1 promoter region and increased the euchromatic histone markers at this region. p300 is a critical histone acetyltransferase, which induces histone acetylation and open chromatin structure to activate gene transcription [35,37]. Our results showed that through associating with ZEB1 promoter region and p300, ZEB1-AS1 could recruit p300 to the ZEB1 promoter region, induce an open chromatin structure, and activate ZEB1 transcription. A correlation between ZEB1 mRNA level and ZEB1-AS1 transcript level in osteosarcoma tissues further supports the regulation of ZEB1 by ZEB1-AS1. Furthermore, functional experiments showed that the pro-proliferation and pro-migration roles of ZEB1-AS1 on osteosarcoma are dependent on the activation of ZEB1, indicating that the upregulation of ZEB1 is critical for the effects of ZEB1-AS1 on osteosarcoma.
Taken together, our studies showed that ZEB1-AS1 is upregulated in osteosarcoma, predicts poor prognosis of osteosarcoma patients, and promotes osteosarcoma cells proliferation and migration. Mechanistically, ZEB1-AS1 associates with and recruits p300 to the ZEB1 promoter region, induces an open chromatin structure, and activates ZEB1 transcription. Our results indicate that ZEB1-AS1 may be a potential prognostic biomarker and therapeutic target for osteosarcoma.
Acknowledgements
This work was supported by grant from Zhejiang Medicine, Health, and Science (2013KYB295).
Disclosure of conflict of interest
None.
References
- 1.Mohseny AB, Szuhai K, Romeo S, Buddingh EP, Briaire-de Bruijn I, de Jong D, van Pel M, Cleton-Jansen AM, Hogendoorn PC. Osteosarcoma originates from mesenchymal stem cells in consequence of aneuploidization and genomic loss of Cdkn2. J Pathol. 2009;219:294–305. doi: 10.1002/path.2603. [DOI] [PubMed] [Google Scholar]
- 2.Jaffe N, Puri A, Gelderblom H. Osteosarcoma: evolution of treatment paradigms. Sarcoma. 2013;2013:203531. doi: 10.1155/2013/203531. [DOI] [PMC free article] [PubMed] [Google Scholar]
- 3.Mir O, Ropert S, Goldwasser F. Neoadjuvant chemotherapy with high-dose methotrexate in osteosarcoma. Lancet Oncol. 2008;9:1198. doi: 10.1016/S1470-2045(08)70309-7. [DOI] [PubMed] [Google Scholar]
- 4.El-Naggar AM, Veinotte CJ, Cheng H, Grunewald TG, Negri GL, Somasekharan SP, Corkery DP, Tirode F, Mathers J, Khan D, Kyle AH, Baker JH, LePard NE, McKinney S, Hajee S, Bosiljcic M, Leprivier G, Tognon CE, Minchinton AI, Bennewith KL, Delattre O, Wang Y, Dellaire G, Berman JN, Sorensen PH. Translational Activation of HIF1alpha by YB-1 Promotes Sarcoma Metastasis. Cancer Cell. 2015;27:682–697. doi: 10.1016/j.ccell.2015.04.003. [DOI] [PubMed] [Google Scholar]
- 5.Kansara M, Teng MW, Smyth MJ, Thomas DM. Translational biology of osteosarcoma. Nat Rev Cancer. 2014;14:722–735. doi: 10.1038/nrc3838. [DOI] [PubMed] [Google Scholar]
- 6.Lamoureux F, Baud’huin M, Rodriguez Calleja L, Jacques C, Berreur M, Redini F, Lecanda F, Bradner JE, Heymann D, Ory B. Selective inhibition of BET bromodomain epigenetic signalling interferes with the bone-associated tumour vicious cycle. Nat Commun. 2014;5:3511. doi: 10.1038/ncomms4511. [DOI] [PubMed] [Google Scholar]
- 7.Chen Y, Di Grappa MA, Molyneux SD, McKee TD, Waterhouse P, Penninger JM, Khokha R. RANKL blockade prevents and treats aggressive osteosarcomas. Sci Transl Med. 2015;7:317ra197. doi: 10.1126/scitranslmed.aad0295. [DOI] [PubMed] [Google Scholar]
- 8.Boro A, Arlt MJ, Lengnick H, Robl B, Husmann M, Bertz J, Born W, Fuchs B. Prognostic value and in vitro biological relevance of Neuropilin 1 and Neuropilin 2 in osteosarcoma. Am J Transl Res. 2015;7:640–653. [PMC free article] [PubMed] [Google Scholar]
- 9.Geng Z, Xu F, Zhang Y. MiR-129-5p-mediated Beclin-1 suppression inhibits endothelial cell autophagy in atherosclerosis. Am J Transl Res. 2016;8:1886–1894. [PMC free article] [PubMed] [Google Scholar]
- 10.Yoon AJ, Wang S, Shen J, Robine N, Philipone E, Oster MW, Nam A, Santella RM. Prognostic value of miR-375 and miR-214-3p in early stage oral squamous cell carcinoma. Am J Transl Res. 2014;6:580–592. [PMC free article] [PubMed] [Google Scholar]
- 11.Ponting CP, Oliver PL, Reik W. Evolution and functions of long noncoding RNAs. Cell. 2009;136:629–641. doi: 10.1016/j.cell.2009.02.006. [DOI] [PubMed] [Google Scholar]
- 12.Fatica A, Bozzoni I. Long non-coding RNAs: new players in cell differentiation and development. Nat Rev Genet. 2014;15:7–21. doi: 10.1038/nrg3606. [DOI] [PubMed] [Google Scholar]
- 13.Yan X, Hu Z, Feng Y, Hu X, Yuan J, Zhao SD, Zhang Y, Yang L, Shan W, He Q, Fan L, Kandalaft LE, Tanyi JL, Li C, Yuan CX, Zhang D, Yuan H, Hua K, Lu Y, Katsaros D, Huang Q, Montone K, Fan Y, Coukos G, Boyd J, Sood AK, Rebbeck T, Mills GB, Dang CV, Zhang L. Comprehensive Genomic Characterization of Long Non-coding RNAs across Human Cancers. Cancer Cell. 2015;28:529–540. doi: 10.1016/j.ccell.2015.09.006. [DOI] [PMC free article] [PubMed] [Google Scholar]
- 14.Mercer TR, Dinger ME, Mattick JS. Long non-coding RNAs: insights into functions. Nat Rev Genet. 2009;10:155–159. doi: 10.1038/nrg2521. [DOI] [PubMed] [Google Scholar]
- 15.Guo X, Xia J, Deng K. Long non-coding RNAs: emerging players in gastric cancer. Tumour Biol. 2014;35:10591–10600. doi: 10.1007/s13277-014-2548-y. [DOI] [PubMed] [Google Scholar]
- 16.Lin A, Li C, Xing Z, Hu Q, Liang K, Han L, Wang C, Hawke DH, Wang S, Zhang Y, Wei Y, Ma G, Park PK, Zhou J, Zhou Y, Hu Z, Marks JR, Liang H, Hung MC, Lin C, Yang L. The LINK-A lncRNA activates normoxic HIF1alpha signalling in triple-negative breast cancer. Nat Cell Biol. 2016;18:213–224. doi: 10.1038/ncb3295. [DOI] [PMC free article] [PubMed] [Google Scholar]
- 17.Yuan JH, Yang F, Wang F, Ma JZ, Guo YJ, Tao QF, Liu F, Pan W, Wang TT, Zhou CC, Wang SB, Wang YZ, Yang Y, Yang N, Zhou WP, Yang GS, Sun SH. A long noncoding RNA activated by TGF-beta promotes the invasion-metastasis cascade in hepatocellular carcinoma. Cancer Cell. 2014;25:666–681. doi: 10.1016/j.ccr.2014.03.010. [DOI] [PubMed] [Google Scholar]
- 18.Yang F, Xue X, Zheng L, Bi J, Zhou Y, Zhi K, Gu Y, Fang G. Long non-coding RNA GHET1 promotes gastric carcinoma cell proliferation by increasing c-Myc mRNA stability. FEBS J. 2014;281:802–813. doi: 10.1111/febs.12625. [DOI] [PubMed] [Google Scholar]
- 19.He C, Jiang B, Ma J, Li Q. Aberrant NEAT1 expression is associated with clinical outcome in high grade glioma patients. APMIS. 2016;124:169–174. doi: 10.1111/apm.12480. [DOI] [PubMed] [Google Scholar]
- 20.Pandey GK, Mitra S, Subhash S, Hertwig F, Kanduri M, Mishra K, Fransson S, Ganeshram A, Mondal T, Bandaru S, Ostensson M, Akyurek LM, Abrahamsson J, Pfeifer S, Larsson E, Shi L, Peng Z, Fischer M, Martinsson T, Hedborg F, Kogner P, Kanduri C. The risk-associated long noncoding RNA NBAT-1 controls neuroblastoma progression by regulating cell proliferation and neuronal differentiation. Cancer Cell. 2014;26:722–737. doi: 10.1016/j.ccell.2014.09.014. [DOI] [PubMed] [Google Scholar]
- 21.Wang F, Yuan JH, Wang SB, Yang F, Yuan SX, Ye C, Yang N, Zhou WP, Li WL, Li W, Sun SH. Oncofetal long noncoding RNA PVT1 promotes proliferation and stem cell-like property of hepatocellular carcinoma cells by stabilizing NOP2. Hepatology. 2014;60:1278–1290. doi: 10.1002/hep.27239. [DOI] [PubMed] [Google Scholar]
- 22.Bayram S, Sumbul AT, Batmaci CY, Genc A. Effect of HOTAIR rs920778 polymorphism on breast cancer susceptibility and clinicopathologic features in a Turkish population. Tumour Biol. 2015;36:3863–3870. doi: 10.1007/s13277-014-3028-0. [DOI] [PubMed] [Google Scholar]
- 23.Li T, Xie J, Shen C, Cheng D, Shi Y, Wu Z, Deng X, Chen H, Shen B, Peng C, Li H, Zhan Q, Zhu Z. Upregulation of long noncoding RNA ZEB1-AS1 promotes tumor metastasis and predicts poor prognosis in hepatocellular carcinoma. Oncogene. 2016;35:1575–1584. doi: 10.1038/onc.2015.223. [DOI] [PubMed] [Google Scholar]
- 24.Kim T, Veronese A, Pichiorri F, Lee TJ, Jeon YJ, Volinia S, Pineau P, Marchio A, Palatini J, Suh SS, Alder H, Liu CG, Dejean A, Croce CM. p53 regulates epithelial-mesenchymal transition through microRNAs targeting ZEB1 and ZEB2. J Exp Med. 2011;208:875–883. doi: 10.1084/jem.20110235. [DOI] [PMC free article] [PubMed] [Google Scholar]
- 25.Carrieri C, Cimatti L, Biagioli M, Beugnet A, Zucchelli S, Fedele S, Pesce E, Ferrer I, Collavin L, Santoro C, Forrest AR, Carninci P, Biffo S, Stupka E, Gustincich S. Long non-coding antisense RNA controls Uchl1 translation through an embedded SINEB2 repeat. Nature. 2012;491:454–457. doi: 10.1038/nature11508. [DOI] [PubMed] [Google Scholar]
- 26.Sun J, Wang X, Fu C, Zou J, Hua H, Bi Z. Long noncoding RNA FGFR3-AS1 promotes osteosarcoma growth through regulating its natural antisense transcript FGFR3. Mol Biol Rep. 2016;43:427–436. doi: 10.1007/s11033-016-3975-1. [DOI] [PubMed] [Google Scholar]
- 27.Stazic D, Lindell D, Steglich C. Antisense RNA protects mRNA from RNase E degradation by RNA-RNA duplex formation during phage infection. Nucleic Acids Res. 2011;39:4890–4899. doi: 10.1093/nar/gkr037. [DOI] [PMC free article] [PubMed] [Google Scholar]
- 28.Faghihi MA, Modarresi F, Khalil AM, Wood DE, Sahagan BG, Morgan TE, Finch CE, St Laurent G 3rd, Kenny PJ, Wahlestedt C. Expression of a noncoding RNA is elevated in Alzheimer’s disease and drives rapid feed-forward regulation of beta-secretase. Nat Med. 2008;14:723–730. doi: 10.1038/nm1784. [DOI] [PMC free article] [PubMed] [Google Scholar]
- 29.Meng L, Person RE, Beaudet AL. Ube3a-ATS is an atypical RNA polymerase II transcript that represses the paternal expression of Ube3a. Hum Mol Genet. 2012;21:3001–12. doi: 10.1093/hmg/dds130. [DOI] [PMC free article] [PubMed] [Google Scholar]
- 30.Shen A, Zhang Y, Yang H, Xu R, Huang G. Overexpression of ZEB1 relates to metastasis and invasion in osteosarcoma. J Surg Oncol. 2012;105:830–834. doi: 10.1002/jso.23012. [DOI] [PubMed] [Google Scholar]
- 31.Li M, Chen H, Zhao Y, Gao S, Cheng C. H19 Functions as a ceRNA in Promoting Metastasis Through Decreasing miR-200s Activity in Osteosarcoma. DNA Cell Biol. 2016;35:235–240. doi: 10.1089/dna.2015.3171. [DOI] [PubMed] [Google Scholar]
- 32.Wang YL, Bai Y, Yao WJ, Guo L, Wang ZM. Expression of long non-coding RNA ZEB1-AS1 in esophageal squamous cell carcinoma and its correlation with tumor progression and patient survival. Int J Clin Exp Pathol. 2015;8:11871–11876. [PMC free article] [PubMed] [Google Scholar]
- 33.Li T, Xie J, Shen C, Cheng D, Shi Y, Wu Z, Deng X, Chen H, Shen B, Peng C, Li H, Zhan Q, Zhu Z. Upregulation of long noncoding RNA ZEB1-AS1 promotes tumor metastasis and predicts poor prognosis in hepatocellular carcinoma. Oncogene. 2016;35:1575–1584. doi: 10.1038/onc.2015.223. [DOI] [PubMed] [Google Scholar]
- 34.Yuan SX, Tao QF, Wang J, Yang F, Liu L, Wang LL, Zhang J, Yang Y, Liu H, Wang F, Sun SH, Zhou WP. Antisense long non-coding RNA PCNA-AS1 promotes tumor growth by regulating proliferating cell nuclear antigen in hepatocellular carcinoma. Cancer Lett. 2014;349:87–94. doi: 10.1016/j.canlet.2014.03.029. [DOI] [PubMed] [Google Scholar]
- 35.Liu X, Wang L, Zhao K, Thompson PR, Hwang Y, Marmorstein R, Cole PA. The structural basis of protein acetylation by the p300/CBP transcriptional coactivator. Nature. 2008;451:846–850. doi: 10.1038/nature06546. [DOI] [PubMed] [Google Scholar]
- 36.Banerjee S, Arif M, Rakshit T, Roy NS, Kundu TK, Roy S, Mukhopadhyay R. Structural features of human histone acetyltransferase p300 and its complex with p53. FEBS Lett. 2012;586:3793–3798. doi: 10.1016/j.febslet.2012.09.012. [DOI] [PubMed] [Google Scholar]
- 37.Wang A, Ikura T, Eto K, Ota MS. Dynamic interaction of p220 (NPAT) and CBP/p300 promotes S-phase entry. Biochem Biophys Res Commun. 2004;325:1509–1516. doi: 10.1016/j.bbrc.2004.10.198. [DOI] [PubMed] [Google Scholar]


