Abstract
β-catenin is a key protein that is encoded by the CTNNB1 gene in the Wnt signaling pathway. This study investigated the associations between β-catenin expression and implications for the efficacy of gemcitabine on pancreatic cancer cells in a three-dimensional (3-D) cancer microenvironment. For low β-catenin expression pancreatic carcinoma cells, the inhibition rates (IRs) for low, middle, and high doses of gemcitabine were 0.615 ± 0.079, 0.691 ± 0.093, and 0.765 ± 0.061, respectively. For the high β-catenin expression pancreatic carcinoma cells, the IRs for the same doses were 0.325 ± 0.072, 0.453 ± 0.075, and 0.537 ± 0.056, respectively. Additionally, the evaluation of β-catenin immunoreactivity in 31 pancreatic cancer patients revealed that the low β-catenin protein expression group had significantly longer overall survival (OS) and disease free survival (DFS) than the high β-catenin protein group (P < 0.05). Overall, β-catenin protein expression levels were significantly correlated to gemcitabine sensitivity in seven pancreatic carcinoma cell lines in the 3-D cancer microenvironment. These data suggest that large-scale clinical studies are warranted to assess the role of the Wnt/β-catenin signaling pathway on β-catenin protein expression and chemosensitivity to gemcitabine in pancreatic cancer.
Keywords: Wnt signaling pathway, chemoresistance, pancreatic carcinoma
Introduction
Pancreatic cancer is characterized by aggressive tumor growth and its prognosis is very poor [1]. Accordingly, to improve the outcomes of treatment for pancreatic cancer, a multimodal approach is essential, and chemotherapy plays an important role in this approach [2]. Although pancreatic cancer cells in the human body grow in a three-dimensional (3-D) environment, in vitro research on pancreatic cancer chemotherapy is traditionally conducted in two dimensional monolayer cell culturemodels.Culturing cells in a single layer does not adequately represent the living tissue conditions and overlooks the differentcharacteristics between a whole tumor and its individual cells, as well as the interaction between the cells and the impact of the microenvironment. For these reasons 3-D culture models were established in recent years to further study the impact of the environment and chemotherapy in vitro [3]. The present study established a 3-D culture with extracellular matrix (ECM) to investigate the effects of chemotherapy on pancreatic cancer cells. Gemcitabine is among the most important chemotherapeutic agent for the treatment of various cancers, but a large proportion of patients do not respond to gemcitabine chemotherapy. This may be due to interindividual differences in tumor behavior, or the occurrence of adverse drug reactions [4]. In any event, predictive markers are needed to identify responsive and nonresponsive patients. A number of reports have suggested the Wnt signaling pathway as an important factor in the outcome of gemcitabine chemotherapy [5]. In recent years, the Wnt signaling pathway has been reported as involved in embryonic development and cancer development [6]. As a key protein, β-catenin is encoded in the Wnt signaling pathway by the CTNNB1 gene [7]. β-catenin is a subunit of the cadherin protein complex and acts as an intracellular signal transducer in the Wnt signaling pathway. Mutations and overexpression of β-catenin are associated with many cancers, including colorectal carcinoma [8]. Since several recent studies have found that β-catenin has been proposed as an important prognostic marker in cancer patients [9,10]. However, pancreatic carcinoma is biologically distinct from some other cancers, including breast cancer, and pancreatic carcinoma cells are insensitive to chemotherapy. In addition, there are few similar studies describing the role of β-catenin expression in the Wnt signaling pathway on the chemosensitivity of pancreatic carcinoma using 3-D cancer microenvironment models. Therefore, the objective of the present study was to evaluate whether β-catenin expression in the Wnt signaling pathway could affect chemosensitivity to gemcitabine in pancreatic cancer cells in a 3-D culture.
Materials and methods
Cell lines
The study used 7 established cell lines derived from human pancreatic cancer (AsPC-1, BxPC-3, Capan-1, PANC-1, COLO357, SU86.86, and T3M4) in the 3-D culture. The AsPC-1, BxPC-3, and SU86.86 cells were incubated in RPMI-1640 culture medium. The Capan-1, PANC-1, COLO357, and T3M4 cells were incubated in DMEM culture medium (Gibco Company; USA) supplemented with 10% fetal bovine serum. Cultured cells were incubated at 37°C in an atmosphere humidified with 5% CO2.
3-D culture of pancreatic carcinoma cells
In 3-D culture systems, ECM collagen is reconstructed to incubate cell lines in vivo. The present study cultivated 7 pancreatic cell lines (AsPC-1, BxPC-3, Capan-1, PANC-1, COLO357, SU86.86, and T3M4) in ECM to form a multicellular spheroids (MCS) model. The 3-D culture system with ECM collagen (Sigma Corporation; USA) was prepared as follows. ECM collagen and a 10x concentration of RPMI-1640 culture media were mixed at a 1:1 ratio to homogeneity in an ice-cold bath. The cell-suspension solution was added to the ECM collagen solution before the gel formed. This collagen mixture was dropped into 96-well multi-plates and cultured at 37°C in 5% CO2. The growth curve of the cell lines were obtained separately and the cell cycle characteristics of the MCS models were studied.
Western blotting of β-catenin protein
Western blotting was performed to determine relative β-catenin protein expression in all 7 cell lines. The cells were treated and washed with ice-cold, phosphate-buffered saline. Total cellular protein was extracted and quantified using Mammalian Protein Extracted Reagent (Pierce; USA) and a BCA Protein Assay Reagent Kit (Pierce; USA). Equal amounts of cell lysates were subjected to sodium dodecyl sulfate-polyacrylamide gel electrophoresis and transferred to polyvinylidene fluoride membranes (Bio Trace PVDF; Pall Corporation; USA). The membranes were blocked for 1 h with 5% nonfat dried milk and then incubated against β-catenin (β-catenin Antibody; Millipore; USA) or an anti-β-actin antibody (Abcam; UK), with the purified polyclonal antibody as a loading control, for 12 h at 4°C. All antibodies were used according to the manufacturers’ instructions. Then, the membranes were incubated with goat anti-mouse IgG secondary antibody (Abcam; UK) for 1 h at room temperature, followed by detection with an enhanced chemiluminescence system (Supersignal West Pico Trial Kit; Pierce).
Chemosensitivity test
To set up the MCS model, a volume of 100 μl (per well) of the ECM collagen mixture was dispensed into 96-well plates. Then pancreatic carcinoma cells, including AsPC-1, BxPC-3, Capan-1, PANC-1, COLO357, SU.86.86 and T3M4, were added into each well before the gel had formed. A volume of 100 μl of the appropriate culture medium, RPMI-1640 or DMEM (supplemented with 10% fetal bovine serum), was added into each well. This ECM collagen mixture was incubated in 5% CO2 at 37°C for 72 h. Then, gemcitabine solution was added to each well at concentrations of 10, 25, or 50 μg/ml. All chemotherapeutic drug solutions were freshly prepared in Hank’s solution and were used within 12 h. After culturing for 24 h at 37°C in 5% CO2, the culture medium containing gemcitabine was removed and replaced with 100 μl of fresh culture medium. After incubation for 2 h, 10 μl of Cell Counting Kit-8 (CCK-8; Dojindo; Japan) was added to each well and incubated for another 2 h. Then, the absorbance of each well was determined with a microplate reader (Dragon Wellscan MK3; Labsystem), and a standard curve was drawn according to the absorbance and cell number. Next, each cell line’s inhibition rate (IR) to gemcitabine was calculated using the following formula:
IR = [1 - (experimental group - blank control)/(control group - blank control)] × 100%
Immunohistochemistry
For β-catenin immunostaining, antigen retrieval was conducted using Vector antigen retrieval fluid (Vector Laboratories; Peterborough, UK) microwaved at full power for 10 min. A number of sections 4-µm thick were cut from the tissue blocks, dewaxed, and rehydrated. Immunohistochemical staining of β-catenin was performed on 4-µm sections obtained from paraffin-embedded normal and tumor tissues using the β-catenin antibody at a 1:100 ratio. Staining was performed using 3.30-diaminobenzide hydrochloride solution (DAB). Sections were pretreated with 3% hydrogen peroxide for 10 min, which was followed, after antigen retrieval, by an avidin-blocking reagent (10% egg white; Sigma; Poole, UK) for 30 min and then the β-catenin antibody to β-catenin (from the PGJ laboratory) at a 1:200 dilution for 60 min. Visualization was achieved by incubating with a 1:200 dilution of goat anti-mouse antibody (Vector Laboratories) for 30 min, followed by a streptavidin-biotin peroxidase complex (Dako; Ely, UK) for 30 min, and then diaminobenzidine (0.5 mg m-1) for 5 min. Finally, negative controls (lacking primary antibodies) were included in each run of immunohistochemistry.
Patients
The study included 31 patients diagnosed with pancreatic adenocarcinoma at the Inner Mongolia Medical University Affiliated Hospital. All 31 were treated with gemcitabine-based chemotherapy. Pancreatic adenocarcinoma specimens of immunohistochemistry were evaluated for the relationship between β-catenin protein expression and the predictive value of the clinical response in pancreatic carcinoma.
Statistical analysis
Data are presented as means ± standard deviation (SD). Statistical significance was determined using one-way analysis of variance (ANOVA) and Student-Newman-Keuls analysis. All statistical tests were two-sided, and differences were considered significant at P < 0.05.
Results
Characteristics of multicellular spheroids (MCS) model
The cellular composition of the 3-D culture was assessed for the indicated number of days. The morphologies of the pancreatic carcinoma cells (AsPC-1, BxPC-3, Capan-1, PANC-1, COLO357, SU86.86, and T3M4) were analyzed, and cells of various lineages were quantified. The MCS model was photographed under a microscope using a professional digital camera (DFC300FX Microsystem; Leica Company; Germany). The overall view of the culture was analyzed using the QWIN version 3.1 image processing software (Leica Company). The first 1-3 days after cell inoculation, the ECM gel grew slowly, but as the number of cells increased, especially after one week, sphere volume increased rapidly. After two weeks, cell growth stabilized. A maximum spheroid diameter of about 800 μm was reached after about 14 days for the PANC-1 spheroids (Figure 1).
Figure 1.
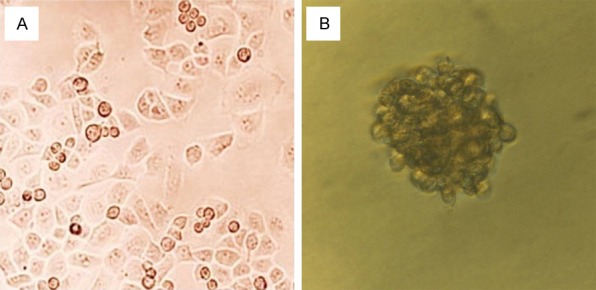
Multicellular spheroids (MCS) model designed to mimic the in-vivo microenvironment. (bars 50 um, original magnification 400 ×). A: Pancreatic cancer cell PANC-1 cultured in traditional 2-D monolayers. B: MCS model of PANC-1 cultured in 3-D culture after 7 days.
Western blotting of β-catenin protein expression
Western blotting was performed to determine relative β-catenin protein expression in all 7 cell lines. As expected, β-catenin and β-actin were detected as single bands at 92 and 42 kDa, respectively. β-catenin protein expression was high in the BxPC-3 and COLO357 cells, but low in the AsPC-1, PANC-1, Capan-1, SU86.86, and T3M4 cells. In addition, immunoblotting distinguished between the High Expression group (BxPC-3 and COLO357) and the Low Expression group (AsPC-1, PANC-1, Capan-1, SU86.86 and T3M4) (Figure 2).
Figure 2.
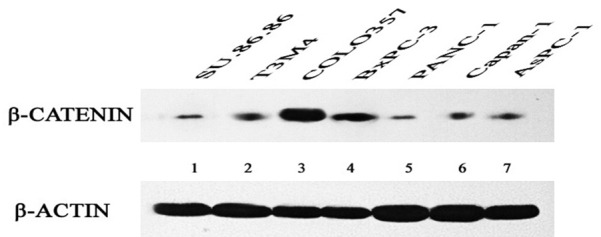
β-catenin protein expression in seven cell lines. β-actin was used as a loading control.
Effect on β-catenin protein expression
Cells in the High Expression group (BxPC-3 and COLO357) expressed significantly higher levels of β-catenin protein than those in the Low Expression group (AsPC-1, PANC-1, Capan-1, SU86.86, and T3M4). As shown in Figure 3, the optical density ratios of the High Expression group and the Low Expression group were 1.724 ± 0.062 and 0.561 ± 0.056, respectively. Optical density ratio analysis showed that β-catenin protein expression was significantly lower in cell lines AsPC-1, PANC-1, Capan-1, SU86.86, and T3M4 than in cell lines BxPC-3 and COLO357. These differences were statistically significant (P < 0.05) (Table 1 and Figure 3).
Figure 3.
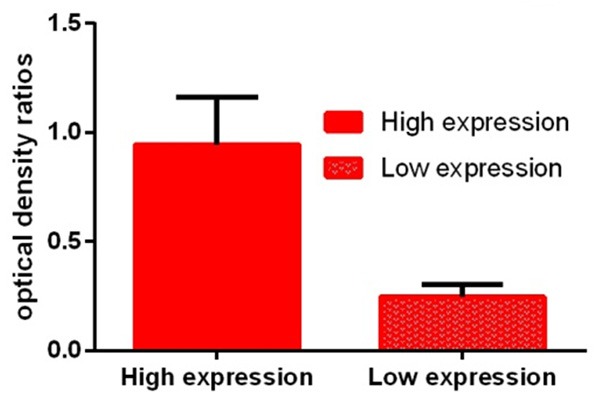
Optical density ratio analysis showed that β-catenin protein expression was significantly lower in cells in the Low Expression group than in cells in the High Expression group.
Table 1.
Optical density ratio determined as the ratio of β-catenin to β-actin (Data are presented as X̅ ± s, n = 6)
| Genotype | High protein expression | Low protein expression | |||||
|---|---|---|---|---|---|---|---|
|
| |||||||
| Cell lines | BxPC-3 | COLO357 | Capan-1 | AsPC-1 | SU.86.86 | T3M4 | PANC-1 |
| OD ratio | 0.878 ± 0.208 | 1.012 ± 0.224 | 0.302 ± 0.071 | 0.225 ± 0.054 | 0.218 ± 0.045 | 0.326 ± 0.062 | 0.172 ± 0.042 |
p value and statistical significance: The two-tailed p value is less than 0.0001. By conventional criteria, this difference is considered extremely statistically significant.
In-vitro chemosensitivity to gemcitabine
The IRs to gemcitabine were determined in all seven pancreatic cancer cell lines using the MCS model. The growth inhibition of the cells was examined after three days of exposure to gemcitabine. This experiment found broad variance in the sensitivity to gemcitabine. Of note, the COLO357 and BxPC-3 cells were resistant to gemcitabine, whereas the AsPC-1, PANC-1, Capan-1, SU86.86, and T3M4 cells were sensitive to gemcitabine at the same concentrations. The IRs to gemcitabine differed significantly among concentrations (P < 0.05). As would be expected, the chemosensitivity of cells increased at increased concentrations of gemcitabine in the 3-D cultures system (Figure 4).
Figure 4.
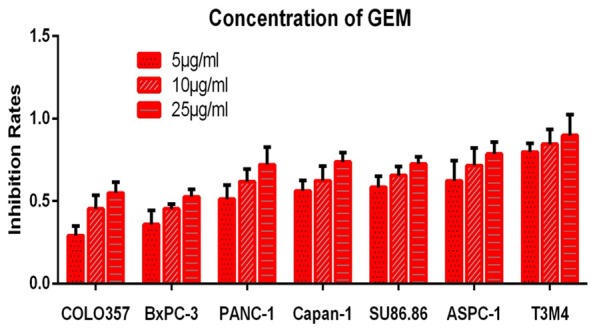
Sensitivity to three concentrations of gemcitabine in seven pancreatic cancer cell lines, showing broad variation in IRs to gemcitabine among the cell lines in the MCS model.
Influence of β-catenin expression on chemosensitivity
For cells in the High Expression group, the IRs to 5, 10, and 25 μg/ml doses of gemcitabine were 0.325 ± 0.072, 0.453 ± 0.075, and 0.537 ± 0.056, respectively. For cells in the Low Expression group, the IRs for the same doses were 0.615 ± 0.079, 0.691 ± 0.093, and 0.765 ± 0.061, respectively. The extent of growth inhibition varied greatly depending on the cell line. However, the IRs to gemcitabine tended to be lower in cells in the High Expression group than in cells in the Low Expression group in the MCS model. In addition, the IRs to gemcitabine differed significantly depending on concentration (P < 0.05) (Figure 5).
Figure 5.
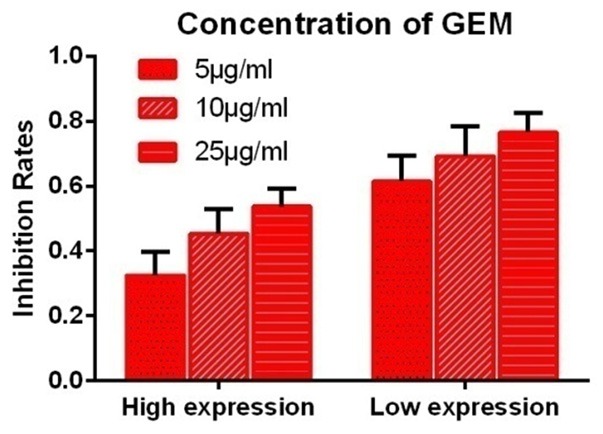
Effect of protein expression on in-vitro sensitivity to gemcitabine. The IRs at each concentration of gemcitabine tested were significantly lower in cells in the High Expression group than in cells in the Low Expression group (P < 0.05).
Patients’ characteristics and treatments
The population of the present study consisted of 31 patients (mean, 62.3 years old; ≥ 60 years old, 20 cases; < 60 years old, 11 cases; 17 men and 14 women). The differentiation degree and invasive depth were determined as follows: well-differentiated and moderately differentiated, 20 cases, 64.5%; poorly differentiated, 11 cases, 35.5%. In addition, 28 cases (90.3%) were metastatic, and lymphatic invasion was seen in 8 cases (25.8%) (Table 2).
Table 2.
Patients’ characteristics and β-catenin expression
| Patients’ characteristics | n | β-catenin protein expression | p value | |
|---|---|---|---|---|
|
| ||||
| Low n (%) | High n (%) | |||
| Gender | ||||
| Male | 17 | 7 (41.2%) | 10 (58.8%) | |
| Female | 14 | 7 (50.0%) | 7 (50.0%) | 0.623 |
| Age | ||||
| ≥ 60 | 20 | 11 (55.0%) | 9 (45.0%) | |
| < 60 | 11 | 3 (27.3%) | 8 (72.7%) | 0.258 |
| Surgical margin | ||||
| Negative | 30 | 14 (46.7%) | 16 (53.3%) | |
| Positive | 1 | 0 (50.0%) | 1 (100.0%) | 1.0000 |
| Tumor grade | ||||
| Poor | 11 | 1 (9.1%) | 10 (90.9%) | |
| Moderate well | 20 | 13 (65.0%) | 7 (35.0%) | 0.007 |
| Histotype | ||||
| Pancreatic ductal adenocarcinoma | 29 | 14 (48.3%) | 15 (51.7%) | |
| Others | 2 | 0 (0.0%) | 2 (100%) | 0.488 |
| TNM stage | ||||
| I and II | 26 | 12 (48.0%) | 13 (52.0%) | |
| III and IV | 6 | 3 (33.3%) | 4 (66.7%) | 0.664 |
| Tumor stage | ||||
| T1-T2 | 8 | 5 (62.5%) | 3 (37.5%) | |
| T3-T4 | 23 | 9 (39.1%) | 14 (60.9%) | 0.412 |
| Nodal stage | ||||
| N0 | 23 | 11 (47.8%) | 12 (52.2%) | |
| N1 | 8 | 3 (37.5%) | 5 (62.5%) | 0.698 |
| Metastasis | ||||
| M0 | 28 | 12 (42.9%) | 16 (57.1%) | |
| M1 | 3 | 2 (66.7%) | 1 (33.3%) | 0.576 |
Immunohistochemistry and the predictive value of clinical survival
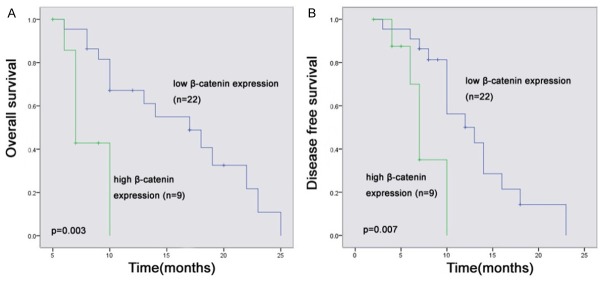
β-catenin immunoreactivity was localized in the cytoplasm of the tumor cells and appeared in the form of a granular staining pattern. The 31 patients’ tumors had large variations in their levels of expression of β-catenin (Figure 6). Thus, low β-catenin immunoreactivity was present in 22 (71%) of the cancers and high β-catenin immunoreactivity in 9 (29%). No statistically significant differences were found for age, sex, differentiation degree, invasive depth, vascular invasion, or lymphatic invasion. But in the cases with β-catenin, the proportion of cases with poorly differentiated tumor grade had relatively higher β-catenin protein expression than those cases with well and moderately differentiated tumors. These differences were statistically significant (P = 0.007). β-catenin protein expression was evaluated by immunostaining in two set of patients: 9 patients in the High Expression group and 22 patients in the Low Expression group. No correlation was observed with clinicopathologic variables. However, associations with overall survival (OS) and disease-free survival (DFS) were observed when immunostaining intensity or percentage of positive cells was considered. Our study of patients with pancreatic cancer also indicated that those patients with β-catenin immunoreactivity in the low β-catenin protein expression group had significantly (P < 0.05) longer OS and DFS compared with patients in the high β-catenin protein group (Figure 7).
Figure 6.
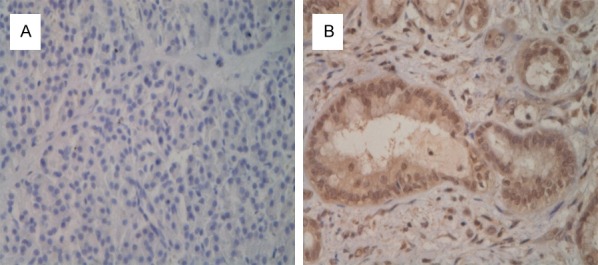
β-catenin protein immunostaining of formalin-fixed, paraffin-embedded human pancreatic cancer. Illustrative cases are shown: A: Low β-catenin Expression; B: High β-catenin Expression.
Figure 7.
Kaplan-Meier analysis of OS and DFS found that the Low Expression group had longer OS and DFS than the High Expression group.
Discussion
The present study investigated the association between levels of β-catenin protein expression and chemosensitivity to gemcitabine in a 3-D cancer microenvironment. In recent years, research data have shown that monolayer culture models, while well-established and easy to use, do not reflect the characteristics of cancer cells in the human body, which survive in a 3-D environment [11]. However, carcinoma cells in-vivo do not exist on their own. Evidence increasingly indicates that the interactions between tumor cells and their microenvironments are the basis for tumor growth and survival [12]. 3-D culture systems, including MCS models, may more accurately reflect the biological behaviors of cells in tumor tissues in vivo and are increasingly being recognized as valuable tools to evaluate the efficacy of therapeutic interventions [13]. MCS models are able to reflect the cellular tumor environment with increasing accuracy [14]. The MCS model was first described in the 1970s by Sutherland [15] as a way to mimic the heterogeneity present in solid tumors and account for the effect of the tumor microenvironment on drug transport and efficacy. The results of anticancer drug sensitivity tests based on 3-D culture models differ from those obtained with 2-D, monolayer-cell culture models [16]. The present study established a spheroid-based, 3-D culture model in pancreatic carcinoma cells and investigated the model’s potential as a spheroid-based drug assay for pancreatic cancer in 3-D cultures. With diameters of 200-500 µm, MCS represent a more complex 3-D model to reproduce histomorphological and functional in vivo features of tumors. Numerous studies have shown that MCS models approximate many characteristics of the intervascular regions of solid tumors or micrometastases with regard to growth kinetics and pathophysiological micromilieus [17]. MCS models also exhibit a proliferation gradient, with G0-phase cells in their inner regions. Proliferating cells are primarily located at the spheroid periphery and are comparable to tumor cells in close proximity to tumor microvessels in vivo. In contrast, as the spheroid enlarges beyond the critical size of 400-600 µm, the innermost cells stop cycling, may differentiate, and eventually die by necrosis and/or apoptosis. 3-D culture models are increasingly accepted by researchers as more accurate for cancer research [18].
The present study selected gemcitabine to investigate the chemosensitivity characteristics of pancreatic carcinoma cells because of its relative efficiency. Gemcitabine is the standard therapy for advanced pancreatic cancer. To compare the chemosensitivities among various spheroids, 3-D models were established with 7 pancreatic cancer cells lines (AsPC-1, BxPC-3, Capan-1, PANC-1, COLO357, SU86.86, and T3M4). CCK-8 was selected for the present chemosensitivity test. The growth inhibition induced by gemcitabine was examined in all cell lines. This analysis revealed a large variability in sensitivity to the tested gemcitabine concentrations in MCS. COLO357 and BxPC-3 cells were resistant to gemcitabine, whereas chemotherapy sensitivity was detected in AsPC-1, PANC-1, Capan-1, SU86.86 and T3M4 with the same concentration of MCS. Chemosensitivity of these cells toward gemcitabine increased along with its concentration in the MCS models. Cellular resistance to gemcitabine can be intrinsic or acquired during gemcitabine treatment, which is the most likely explanation for its failure in chemotherapy. Gemcitabine has a complex metabolism pathway, and many mechanisms can contribute to gemcitabine cytotoxicity and chemoresistance [19]. The Wnt signaling pathway has been reported as involved in cancer development and chemoresistance. The present study investigated the relationship between the Wnt signaling pathway and gemcitabine resistance. As the key regulator of the Wnt signaling pathway, β-catenin plays an important role in signal transduction [20]. In the absence of Wnt signaling, free β-catenin molecules remain at low levels due to their degradation by the ubiquitin-proteasome pathway. In the presence of Wnt signaling, the APC destruction complex is inactivated and consequently, cytoplasmic accumulation of β-catenin translocates to the nucleus, where it interacts with TCF/LEF factors and activates target gene transcription [21]. Results of the present study showed that levels of β-catenin protein expression differed among the seven pancreatic cancer cells lines in a 3-D culture system. β-catenin protein expression was high in the BxPC-3 and COLO357 cell lines, but low in the AsPC-1, PANC-1, Capan-1, SU86.86, and T3M4 cells lines in the MCS model. In addition, immunoblotting distinguished between the High Expression group (BxPC-3 and COLO357) and the Low Expression group (AsPC-1, PANC-1, Capan-1, SU86.86, and T3M4). In all seven pancreatic carcinoma cell lines, chemosensitivity was correlated with the level of expression of β-catenin protein. The IRs to gemcitabine tended to be lower in the cells with High Expression than in the cells with Low Expression. Similarly, β-catenin immunoreactivity was more significantly associated with longer overall survival (OS) and disease-free survival (DFS) in the Low Expression group than in the High Expression group. In addition, among patients who had received gemcitabine therapy, DFS was longer in the Low Expression group than in the High Expression group. A number of clinical studies have indicated that the expression of β-catenin protein in cancer cells is associated with gemcitabine chemosensitivity [22]. Several clinical studies of ovarian cancer have shown that high β-catenin protein expression in ovarian cancer cells is associated with worse outcomes in chemotherapy compared with low β-catenin protein expression in cancer cells [23]. Similarly, Chikazawa, et al. [24] reported that high β-catenin protein expression is a risk factor for chemotherapy in colon cancer. However, conflicting results have been reported in terms of the clinical outcomes of chemotherapy. For example, several studies have found no significant difference in outcome in patients based on β-catenin expression [25]. Possible explanations for these divergent findings may include differences in cancer types or stages [26]. Therefore, quantifying β-catenin protein expression and assessing the Wnt signaling pathway might result in a more accurate prediction of tumor response to gemcitabine-based chemotherapy in MCS models by providing information about the target amount. For this reason, β-catenin and other pharmacogenomic factors should be investigated further in the context of gemcitabine-based chemotherapy in MCS models.
Conclusions
The present study investigated the effect of Wnt/β-catenin on β-catenin expression in seven pancreatic cancer cell lines and the effect of expression on the efficacy of gemcitabine chemotherapy, finding an association between β-catenin expression and in-vitro sensitivity to gemcitabine in a 3-D cancer microenvironment. In the MCS model, cells with high β-catenin protein expression showed lower gemcitabine sensitivity than cells with low β-catenin protein expression. These findings suggest that level of expression of β-catenin protein is a genetic marker that can be used to predict the chemosensitivity of pancreatic cancer to gemcitabine. These results need to be confirmed in large-scale clinical studies to clarify the effects of β-catenin expression on individualized pancreatic cancer chemotherapy.
Acknowledgements
This study was supported by the Chinese National Natural Sciences Foundation (No. 81368339) and the Inner Mongolia Youth Science and Technology Talent Support Program (Type B: NJYT-15-B19).
Disclosure of conflict of interest
None.
References
- 1.Dimou F, Sineshaw H, Parmar AD, Tamirisa NP, Jemal A, Riall TS. Trends in Receipt and Timing of Multimodality Therapy in Early-Stage Pancreatic Cancer. J Gastrointest Surg. 2016;20:93–103. doi: 10.1007/s11605-015-2952-7. [DOI] [PMC free article] [PubMed] [Google Scholar]
- 2.Gong J, Tuli R, Shinde A, Hendifar AE. Meta-analyses of treatment standards for pancreatic cancer. Mol Clin Oncol. 2016;4:315–325. doi: 10.3892/mco.2015.716. [DOI] [PMC free article] [PubMed] [Google Scholar]
- 3.Che ZM, Jung TH, Choi JH, Yoon DJ, Jeong HJ, Lee EJ, Kim J. Collagen-based co-culture for invasive study on cancer cells-fibroblasts interaction. Biochem Biophys Res Commun. 2006;346:268–275. doi: 10.1016/j.bbrc.2006.05.111. [DOI] [PubMed] [Google Scholar]
- 4.Valle JW, Wasan H, Lopes A, Backen AC, Palmer DH, Morris K, Duggan M, Cunningham D, Anthoney DA, Corrie P, Madhusudan S, Maraveyas A, Ross PJ, Waters JS, Steward WP, Rees C, Beare S, Dive C, Bridgewater JA. Cediranib or placebo in combination with cisplatin and gemcitabine chemotherapy for patients with advanced biliary tract cancer (ABC-03): a randomised phase 2 trial. Lancet Oncol. 2015;16:967–978. doi: 10.1016/S1470-2045(15)00139-4. [DOI] [PMC free article] [PubMed] [Google Scholar]
- 5.Jung DB, Yun M, Kim EO, Kim J, Kim B, Jung JH, Wang E, Mukhopadhyay D, Hammond E, Dredge K, Shridhar V, Kim SH. The heparan sulfate mimetic PG545 interferes with Wnt/β-catenin signaling and significantly suppresses pancreatic tumorigenesis alone and in combination with gemcitabine. Oncotarget. 2015;6:4992–5004. doi: 10.18632/oncotarget.3214. [DOI] [PMC free article] [PubMed] [Google Scholar]
- 6.Monin MB, Krause P, Stelling R, Bocuk D, Niebert S, Klemm F, Pukrop T, Koenig S. The anthelmintic niclosamide inhibits colorectal cancer cell lines via modulation of the canonical and noncanonical Wnt signaling pathway. J Surg Res. 2016;203:193–205. doi: 10.1016/j.jss.2016.03.051. [DOI] [PubMed] [Google Scholar]
- 7.Amado NG, Predes D, Fonseca BF, Cerqueira DM, Reis AH, Dudenhoeffer AC, Borges HL, Mendes FA, Abreu JG. Isoquercitrin suppresses colon cancer cell growth in vitro by targeting the Wnt/β-catenin signaling pathway. J Biol Chem. 2014;289:35456–35467. doi: 10.1074/jbc.M114.621599. [DOI] [PMC free article] [PubMed] [Google Scholar]
- 8.Hildebrandt MA, Reyes ME, Lin M, He Y, Nguyen SV, Hawk ET, Wu X. Germline Genetic Variants in the Wnt/β-Catenin Pathway as Predictors of Colorectal Cancer Risk. Cancer Epidemiol Biomarkers Prev. 2016;25:540–546. doi: 10.1158/1055-9965.EPI-15-0834. [DOI] [PMC free article] [PubMed] [Google Scholar]
- 9.Wang Z, Zhang H, Hou J, Niu J, Ma Z, Zhao H, Liu C. Clinical implications of β-catenin protein expression in breast cancer. Int J Clin Exp Pathol. 2015;8:14989–14994. [PMC free article] [PubMed] [Google Scholar]
- 10.You J, Yang H, Lai Y, Simon L, Au J, Burkart AL. ARID2, p110α, p53, and β-catenin protein expression in hepatocellular carcinoma and clinicopathologic implications. Hum Pathol. 2015;46:1068–1077. doi: 10.1016/j.humpath.2015.05.005. [DOI] [PubMed] [Google Scholar]
- 11.Nelson CM, Bissell MJ. Modeling dynamic reciprocity: Engineering three-dimensional culture models of breast architecture, function, and neoplastic transformation. Semin Cancer Biol. 2005;15:342–352. doi: 10.1016/j.semcancer.2005.05.001. [DOI] [PMC free article] [PubMed] [Google Scholar]
- 12.Pampaloni F, Reynaud EG, Stelzer EH. The third dimension bridges the gap between cell culture and live tissue. Nat Rev Mol Cell Biol. 2007;8:839–945. doi: 10.1038/nrm2236. [DOI] [PubMed] [Google Scholar]
- 13.Friedrich J, Ebner R, Kunz-Schughart LA. Experimental anti-tumor therapy in 3-D: spheroids--old hat or new challenge? Int J Radiat Biol. 2007;83:849–871. doi: 10.1080/09553000701727531. [DOI] [PubMed] [Google Scholar]
- 14.Matsubara S, Ozawa M. Expression of α-catenin in α -catenin-deficient cells results in a reduced proliferation in the three-dimensional multicellular spheroids but not in two-dimensional monolayer cultures. Oncogene. 2004;23:2694–2702. doi: 10.1038/sj.onc.1207423. [DOI] [PubMed] [Google Scholar]
- 15.Sutherland RM, McCredie JA, Inch WR. Growth of multicell spheroids in tissue culture as a model of nodular carcinomas. J Natl Cancer Inst. 1971;46:113–120. [PubMed] [Google Scholar]
- 16.Horning JL, Sahoo SK, Vijayara ghavalu S, Dimitrijevic S, Vasir JK, Jain TK, Panda AK, Labhasetwar V. 3-D tumor model for in vitro evaluation of anticancer drugs. Mol Pharm. 2008;5:849–862. doi: 10.1021/mp800047v. [DOI] [PubMed] [Google Scholar]
- 17.Gottfried E, Kunz-Schughart LA, Andreesen R, Kreutz M. Brave little world: spheroids as an in vitro model to study tumor-immune-cell interactions. Cell Cycle. 2006;5:691–695. doi: 10.4161/cc.5.7.2624. [DOI] [PubMed] [Google Scholar]
- 18.Frederiksen LJ, Siemens DR, Heaton JP, Maxwell LR, Adams MA, Graham CH. Hypoxia induced resistance to doxorubicin in prostate cancer cells is inhibited by low concentrations of glyceryl trinitrate. J Urol. 2003;170:1003–1007. doi: 10.1097/01.ju.0000081126.71235.e0. [DOI] [PubMed] [Google Scholar]
- 19.De Sousa Cavalcante L, Monteiro G. Gemcitabine: metabolism and molecular mechanisms of action, sensitivity and chemoresistance in pancreatic cancer. Eur J Pharmacol. 2014;741:8–16. doi: 10.1016/j.ejphar.2014.07.041. [DOI] [PubMed] [Google Scholar]
- 20.Guo H, Xing Y, Liu Y, Luo Y, Deng F, Yang T, Yang K, Li Y. Wnt/β-catenin signaling pathway activates melanocyte stem cells in vitro and in vivo. J Dermatol Sci. 2016;83:45–51. doi: 10.1016/j.jdermsci.2016.04.005. [DOI] [PubMed] [Google Scholar]
- 21.Tang W, Dodge M, Gundapaneni D, Michnoff C, Roth M, Lum L. A genome-wide RNAi screen for Wnt/beta-catenin pathway components identifies unexpected roles for TCF transcription factors in cancer. Proc Natl Acad Sci U S A. 2008;105:9697–9702. doi: 10.1073/pnas.0804709105. [DOI] [PMC free article] [PubMed] [Google Scholar]
- 22.Kobayashi T, Shimura T, Yajima T, Kubo N, Araki K, Tsutsumi S, Suzuki H, Kuwano H, Raz A. Transient gene silencing of galectin-3 suppresses pancreatic cancer cell migration and invasion through degradation of β-catenin. Int J Cancer. 2011;129:2775–2786. doi: 10.1002/ijc.25946. [DOI] [PMC free article] [PubMed] [Google Scholar]
- 23.Wang J, Zhou D, He X, Wang Y, Hu W, Jiang L, Dou J. Effect of downregulated β-catenin on cell proliferative activity, the sensitivity to chemotherapy drug and tumorigenicity of ovarian cancer cells. Cell Mol Biol. 2011;57:1606–1613. [PubMed] [Google Scholar]
- 24.Chikazawa N, Tanaka H, Tasaka T, Nakamura M, Tanaka M, Onishi H, Katano M. Inhibition of Wnt signaling pathway decreases chemotherapy-resistant side-population colon cancer cells. Anticancer Res. 2010;30:2041–2048. [PubMed] [Google Scholar]
- 25.Rosa M, Han HS, Ismail-Khan R, Allam-Nandyala P, Bui MM. Beta-catenin expression patterns in matched pre- and post-neoadjuvant chemotherapy-resistant breast cancer. Ann Clin Lab Sci. 2015;45:10–16. [PubMed] [Google Scholar]
- 26.Ashdown ML, Robinson AP, Yatomi-Clarke SL, Ashdown ML, Allison A, Abbott D, Markovic SN, Coventry BJ. Chemotherapy for Late-Stage Cancer Patients: Meta-Analysis of Complete Response Rates. F1000Res. 2015;13:232. doi: 10.12688/f1000research.6760.1. [DOI] [PMC free article] [PubMed] [Google Scholar]


