Abstract
Riboflavin is a common cofactor, and its biosynthetic pathway is well characterized. However, its catabolic pathway, despite intriguing hints in a few distinct organisms, has never been established. This article describes the isolation of a Microbacterium maritypicum riboflavin catabolic strain, and the cloning of the riboflavin catabolic genes. RcaA, RcaB, RcaD, and RcaE were overexpressed and biochemically characterized as riboflavin kinase, riboflavin reductase, ribokinase, and riboflavin hydrolase, respectively. Based on these activities, a pathway for riboflavin catabolism is proposed.
Keywords: cloning, enzyme mechanism, flavoprotein, quorum sensing, riboflavin, Vitamin B2, catabolism, lyase, reconstitution
Introduction
Cofactors play key roles in augmenting the limited functionality available on proteins for catalysis. As with all other metabolites, cofactors do not accumulate in the environment. This is due in part to efficient salvage of these biosynthetically expensive metabolites and in part to cofactor catabolism. However, in contrast to the large literature on cofactor biosynthesis, relatively little is known about cofactor breakdown (1). Detailed enzymology has only been carried out on heme (2), pyridoxal (3), and NAD (4, 5) catabolism. Thiamin, folate, riboflavin, and biotin degrading bacteria were once isolated but have now been lost (6–11). Analysis of culture metabolites from the reported riboflavin catabolic strain demonstrated that this strain was capable of fully degrading the isoalloxazine ring of riboflavin (12). None of the genes were identified and lumichrome was not an intermediate. Riboflavin hydrolase, the only previously characterized riboflavin catabolic enzyme, catalyzes the conversion of riboflavin to lumichrome and ribose and has previously been identified as a potential catabolic enzyme in a second pathway (13–15). However, despite significant effort, the gene encoding this enzyme was never identified and the enzyme itself proved to be biochemically intractable (16). Here we report the isolation of a riboflavin-catabolizing Microbacterium maritypicum strain from dust samples obtained at the DSM riboflavin production plant in Germany. The catabolic operon was isolated from a cosmid library, sequenced, and annotated. Preliminary characterization of the enzymes involved suggested a riboflavin catabolic pathway.
Results
Strain M. maritypicum G10 Catabolizes Riboflavin
Dust samples, collected at the DSM riboflavin production plant in Germany, were screened by culturing in a defined minimal medium containing M9 salts with riboflavin as the primary carbon source. Bleaching of the riboflavin color was observed in some of the samples. The cells from these hits were grown on NB plates and single colonies were selected. Individual strains were retested in M9 medium with riboflavin as the sole carbon source. The best of these strains (strain G10) completely bleached the yellow color of riboflavin after 12 h of growth and was selected for further study. The sequence of the gene encoding 16S rRNA identified this strain as M. maritypicum.
To identify the products generated from consumption of riboflavin, M. maritypicum G10 was grown in M9 medium supplemented with 0.1% LB and 100 μg/ml (270 μm) of riboflavin. HPLC analysis of the medium showed time-dependent consumption of riboflavin and appearance of a new signal, which comigrated with lumichrome (Fig. 1A). Analysis after 21 h showed complete catabolism of riboflavin, a small peak for lumichrome, and no new signals were observed on the HPLC. We therefore wondered whether lumichrome was precipitating from the growth medium. After 30 h, the total lumichrome concentration, from 270 μm riboflavin, was 260 μm. This corresponds to 96% conversion of riboflavin to lumichrome. When the same culture medium was filtered before basification, the lumichrome concentration was less than 25 μm (Fig. 1B). We therefore conclude that riboflavin catabolism in M. maritypicum G10 involves cleavage of the ribose from the isoalloxazine ring. The ribose is used to sustain cell growth and the lumichrome precipitates from the growth medium.
FIGURE 1.
Analysis of riboflavin catabolism. A, HPLC analysis (at 340 nm) for the time-dependent formation of lumichrome from riboflavin in the culture medium of M. maritypicum G10; B, UV-visible analysis of culture medium treated with 1 n KOH after ∼30 h of growth. Lumichrome precipitates from the culture medium after 11 h.
Identification of the Riboflavin Catabolic Gene Cluster
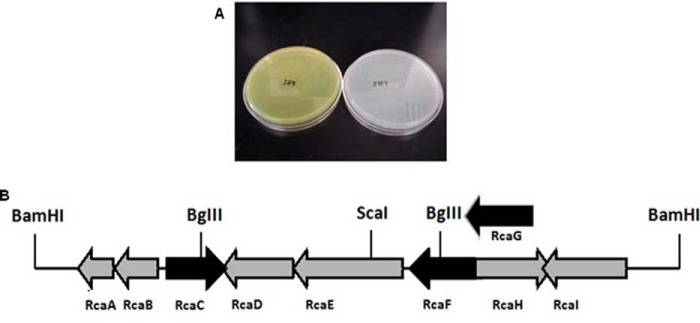
A cosmid library was constructed for the isolation of the riboflavin catabolic gene cluster (17). After failing to identify the gene cluster by screening this library in Escherichia coli, Streptomyces lividans 1326 was chosen as the heterologous host because Microbacterium and Streptomyces both have similar genomic GC content (∼70%). The cosmid library was therefore reconstructed in vector pJTU2463 containing oriT for conjugation and integration into the attP site of S. lividans. Based on an estimated Microbacterium genome size of 4–5 Mbp, we constructed a library of 768 clones (eight 96-well plates) resulting in at least 6-fold coverage of the genome. This library was screened, first in batches of 12 cosmids, then individually, to yield two cosmids encoding the riboflavin catabolic pathway (1A4 and 5H7, Fig. 2A). Sequence alignment of the two cosmids identified a 6.63-kb region in 1A4 showing 86% identity with 5H7 suggesting that the riboflavin catabolic genes were localized in this region. To test this, an 8.7-kb BamHI fragment from 5H7, containing the target 6.63-kb region, was cloned into pJTU2463 and introduced into S. lividans. This strain also consumed riboflavin.
FIGURE 2.
Cloning of the riboflavin catabolic cluster. A, S. lividans carrying cosmid 5H7 bleached the M9 plate with riboflavin (right) compared with the mutant carrying cosmid 5H4 (left); B, genetic organization of the riboflavin catabolic genes in the BamHI fragment from the cosmid 5H7.
Functional Analysis of the Riboflavin Catabolic (Rca) Gene Cluster
The genetic organization of the riboflavin catabolic gene cluster of cosmid 5H7 is shown in Fig. 2B and the gene annotations are shown in Table 1. The riboflavin catabolic gene cluster on cosmid 1A4 was similarly annotated (supplemental Table S2). All of the genes in this cluster have high identity (77∼95%) with those in the 5H7 cluster except for RcaH, which is replaced by a gene of unknown function (RcaJ2) and RcaA, which is absent. Based on the sequence analysis, RcaF and RcaG are likely to be involved in riboflavin transport and RcaC in pathway regulation. These proteins were not further studied. Cosmids 5H7 and 1A4 both contain all of the genes essential for riboflavin catabolism in S. lividans (supplemental Table S2). Because a second riboflavin kinase is available for FMN and FAD biosynthesis in S. lividans, RcaA is not an essential component of the catabolic gene cluster (see below). In addition, because rcaH is missing from cosmid 1A4 and rcaJ2 is missing from cosmid 5H7, we conclude that neither of these genes are involved in riboflavin catabolism.
TABLE 1.
Deduced functions of ORFs in the riboflavin catabolic gene cluster of cosmid 5H7
| Gene | Start | Stop | Amino acid | Protein homolog/Proposed function | Identity |
|---|---|---|---|---|---|
| % | |||||
| RcaA | 1585 | 1193 | 131 | Bifunctional riboflavin kinase Arsenicicoccus bolidensis/Flavokinase | 70/129 |
| 54 | |||||
| RcaB | 2106 | 1585 | 174 | Flavin reductase Marine actinobacterium PHSC20C1/Flavin-reductase | 87/159 |
| 55 | |||||
| RcaC | 2209 | 2811 | 201 | PadR family transcriptional regulator Salinibacterium sp. PAMC21357/Transcriptional regulator | 120/186 |
| 65 | |||||
| RcaD | 3671 | 2820 | 284 | Ribokinase Llyobacter polytropus DSM 2926/Ribokinase | 105/287 |
| 37 | |||||
| RcaE | 5073 | 3697 | 459 | N5,N10-methylene tetrahydromethanopterin reductase Bacillus sp. 10403023/ Riboflavin hydrolase | 139/340 |
| 41 | |||||
| RcaF | 6036 | 5191 | 282 | Transporter Marine actinobacterium PHSC20C1/Transporter | 202/269 |
| 75 | |||||
| RcaG | 6826 | 6032 | 265 | ABC transporter ATP-binding protein Marine actinobacterium PHSC20C1/Transporter | 189/258 |
| 73 | |||||
| RcaH | 5924 | 6859 | 312 | Phenol hydroxylase Natronorubrum tibetense/Unknown | 53/165 |
| 32 | |||||
| RcaI | 7929 | 6829 | 367 | NMT1/THI5 like domain-containing protein Salinibacterium sp. PAMC 21357/Unknown | 185/245 |
| 76 |
RcaA Is a Riboflavin Kinase
RcaA was cloned into the pET28b vector and overexpressed in E. coli BL21(DE3). The overexpressed enzyme was purified on a Ni-NTA2 HisTrap HP column (Fig. 3A). The purified enzyme was incubated with riboflavin and ATP and the product was identified as FMN by HPLC co-elution with the purchased standard, thus confirming RcaA as a riboflavin kinase (Fig. 3B).
FIGURE 3.
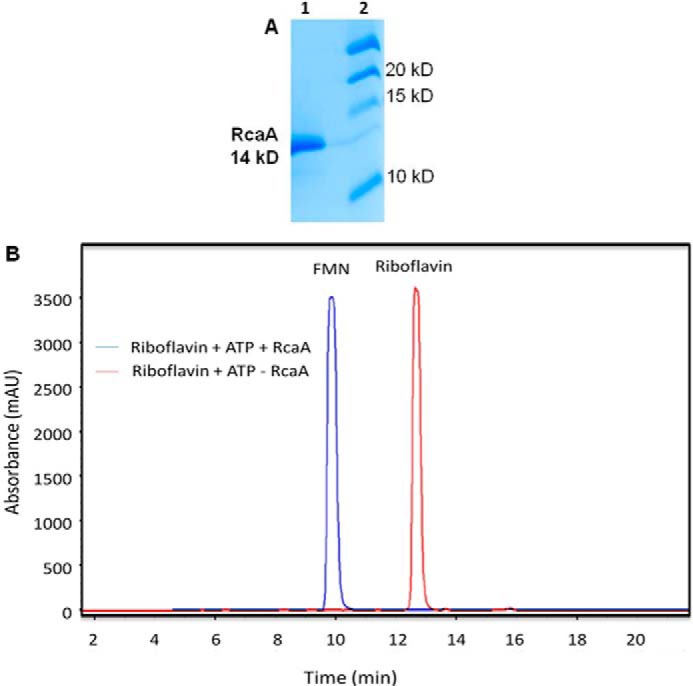
Biochemical characterization of RcaA. A, SDS-PAGE analysis of RcaA purified on a Ni-NTA HisTrap column. Lane 1, purified RcaA; lane 2, molecular mass markers. B, HPLC trace (at 450 nm) of the RcaA catalyzed reaction of riboflavin with ATP and MgCl2.
RcaB Is a Riboflavin/Flavin Mononucleotide (FMN) Reductase
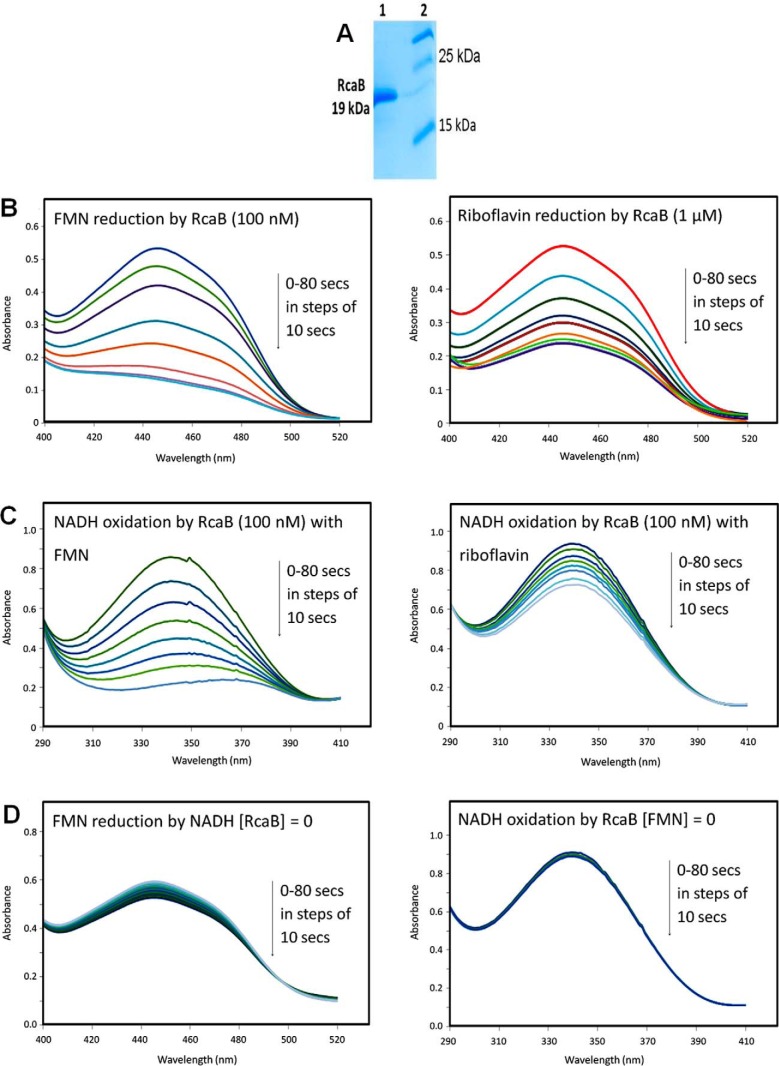
RcaB was cloned into the pMAL vector and overexpressed in E. coli BL21(DE3). The overexpressed enzyme was purified on an amylose resin column followed by maltose tag cleavage (Fig. 4A). The purified enzyme was incubated with NADH and riboflavin (or FMN) and a steady decrease in the absorbance for oxidized flavin at 450 nm was observed by UV-visible spectroscopy (Fig. 4B). As evident from Fig. 4B, a complete reduction of 80 μm FMN was achieved in 80 s with 100 nm RcaB in the presence of excess NADH, whereas similar reduction of riboflavin required 1 μm enzyme. In Fig. 4C NADH consumption was monitored by the decrease in the absorbance at 340 nm. NADH consumption was measured for both FMN (left panel) and riboflavin (right panel) reduction with 100 nm RcaB. A comparison between the two panels (supplemental Fig. S1) clearly indicates that the rate of reduction of FMN by RcaB is faster than that of riboflavin. No such decrease in the absorbance of the oxidized flavin at 450 nm was observed when the flavin was incubated with NADH in the absence of the enzyme (Fig. 4D). Similarly, in the absence of oxidized flavin no decrease in the absorbance for NADH at 340 nm was observed (Fig. 4E). The above results confirmed RcaB as a flavin reductase with a modest substrate preference for FMN.
FIGURE 4.
Biochemical characterization of RcaB. A, SDS-PAGE analysis of RcaB after purification on a maltose-binding column followed by maltose tag cleavage. Lane 1, purified RcaB; lane 2, molecular mass markers; B, left trace, UV-visible spectrum at 450 nm of the reduction of FMN with NADH and 100 nm RcaB; right trace, UV-visible spectrum at 450 nm of the reduction of riboflavin with NADH and 1 μm RcaB C, UV-visible spectrum at 340 nm of the RcaB (100 nm)-catalyzed oxidation of NADH with FMN (left trace) and riboflavin (right trace); D, left trace, UV-visible spectra of the non-enzymatic reduction of FMN with NADH; right trace, UV-visible spectra of the RcaB-catalyzed oxidation of NADH in the absence of flavin.
RcaD Is a Ribokinase
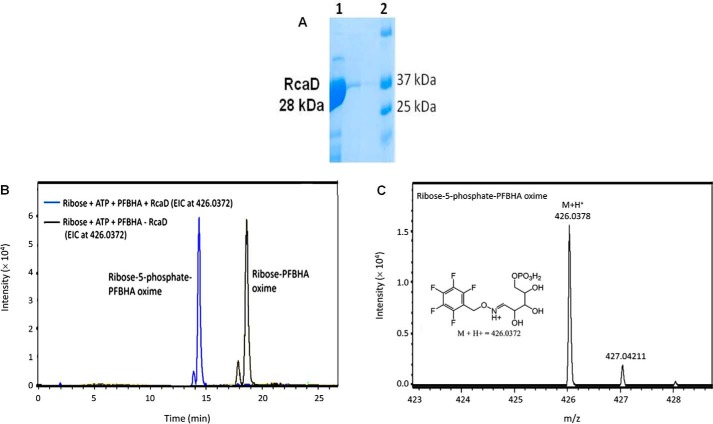
RcaD was cloned into the pMAL vector and overexpressed in E. coli BL21(DE3). The enzyme was purified as described for RcaB above (Fig. 5A). RcaD catalyzed the conversion of ribose to ribose 5-phosphate in the presence of ATP. The product was detected by LC-MS analysis of the reaction mixture after treatment with O-(2,3,4,5,6-pentafluorobenzyl)hydroxylamine (PFBHA) to convert the corresponding aldehyde to an oxime (Fig. 5, B and C) followed by co-elution with the synthesized standard of ribose 5-phosphate-PFBHA oxime (supplemental Fig. S2), thus confirming RcaD as a ribokinase.
FIGURE 5.
Biochemical characterization of RcaD. A, SDS-PAGE analysis of RcaD after purification on a maltose-binding column followed by maltose tag cleavage. Lane 1, purified RcaD; lane 2, molecular markers. B, extracted ion chromatogram (EIC) of the RcaD-catalyzed reaction of ribose with ATP followed by derivatization with PFBHA. The yellow trace shows the E and Z isomers of the substrate oxime (ribose-PFBHA oxime) (M+H+ 346.0708), detected from the EIC analysis at 346.0708 Da. The blue trace is the full reaction where the of E and Z isomers of product oxime (ribose-5-phosphate-PFBHA oxime) (M+H+ 426.0372), are detected from the EIC analysis at 426.0372 Da. No ribose-PFBHA oxime at EIC 346.0708 was detected in the full reaction demonstrating complete conversion of ribose to ribose 5-phosphate by RcaD under the assay conditions. C, ESI-mass spectrum in the positive mode of the reaction product, ribose 5-phosphate-PFBHA oxime. The protonated mass (M+H+) is observed at 426.0378 Da with 1.4 ppm mass error.
RcaE Catalyzes the Formation of Lumichrome and Ribose
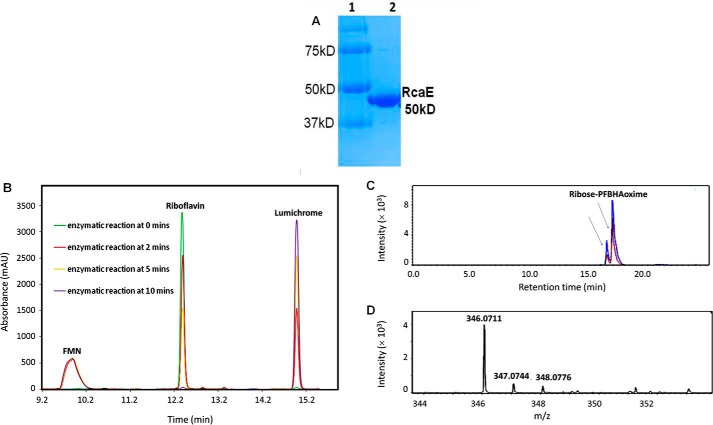
RcaE was cloned into pET28b and overexpressed in E. coli BL21(DE3). The protein was purified on a Ni-NTA HisTrap HP column (Fig. 6A). To test for riboflavin hydrolase activity riboflavin, NADH and ATP were incubated with purified RcaA, RcaB, and RcaE and the reaction mixture was analyzed by HPLC. A time-dependent formation of lumichrome with the enzyme mixture was observed (Fig. 6B). To characterize the sugar product in the enzymatic degradation of riboflavin, the reaction mixture was treated with PFBHA and analyzed by LC-MS. The full reaction revealed the formation of ribose-PFBHA oxime (Fig. 6C). Its identity was confirmed by co-elution with a synthesized standard of ribose-PFBHA oxime followed by ESI-mass spectrometry analysis (Fig. 6D). To further define the riboflavin hydrolase activity, a series of reactions, lacking individual enzymes, were run (Fig. 7). These experiments established the following: RcaA catalyzes the first step in the catabolic pathway because in the absence of RcaA, riboflavin is not consumed and lumichrome is not formed; RcaB catalyzes the second step because in its absence FMN accumulates and greatly reduced quantities of lumichrome are formed due to slow non-enzymatic reduction of FMN by NADH (Fig. 4D). In the absence of RcaE, FMN also accumulates because any reduced flavin will undergo re-oxidation during aerobic work-up. Remarkably, addition of catalytic amounts of FMN removes the RcaA requirement thus enabling reconstitution of the riboflavin hydrolase using only RcaB and RcaE (Fig. 8). The hydrolase reaction is oxygen-dependent (Fig. 9) and the reaction products are lumichrome and ribose.
FIGURE 6.
Biochemical characterization of RcaE. A, SDS-PAGE analysis of RcaE purified on a Ni-NTA HisTrap column. Lane 1, molecular mass markers. Lane 2, purified RcaE. B, HPLC trace of the RcaA, RcaB, RcaE-catalyzed reaction of riboflavin with NADH and ATP showing time-dependent formation of lumichrome. C, extracted ion chromatogram (EIC) of the full reaction, after derivatization with PFBHA, showing EIC at 346.0708 corresponding to the formation of the E and Z isomers (indicated by black arrows) of ribose-PFBHA oxime (M+H+ 346.0708) (red trace). Co-elution of the ribose-PFBHA oxime from the full reaction with synthesized standard of ribose-PFBHA oxime (blue trace). D, ESI-mass spectrum in the positive mode of the reaction product, ribose-PFBHA oxime. The protonated mass (M+H+) is observed at 346.0711 Da with 0.8 ppm mass error.
FIGURE 7.
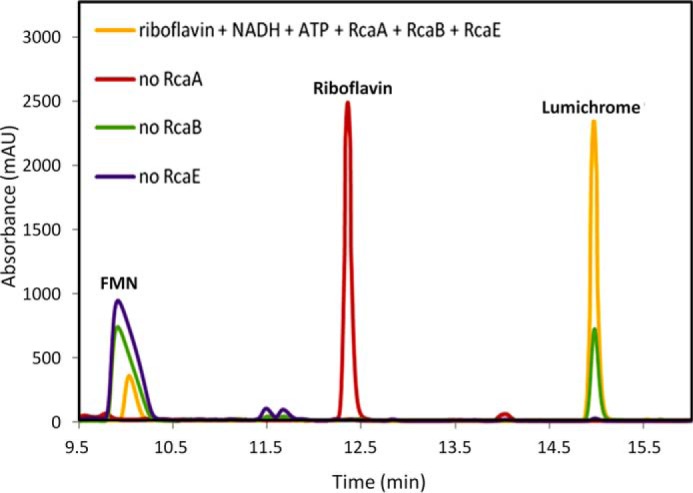
HPLC characterization of the enzymatic formation of lumichrome in the absence of individual participating enzymes. Formation of lumichrome is observed when riboflavin is incubated with RcaA, RcaB, and RcaE (yellow trace). No consumption of riboflavin is observed in the absence of RcaA (red trace). In the absence of RcaB, reduced levels of lumichrome formation are observed and riboflavin is converted to FMN (green trace). The lumichrome formed in this sample is due to the slow non-enzymatic reduction of FMN by NADH. The reaction stops after the formation of FMN from riboflavin in the absence of RcaE (purple trace).
FIGURE 8.
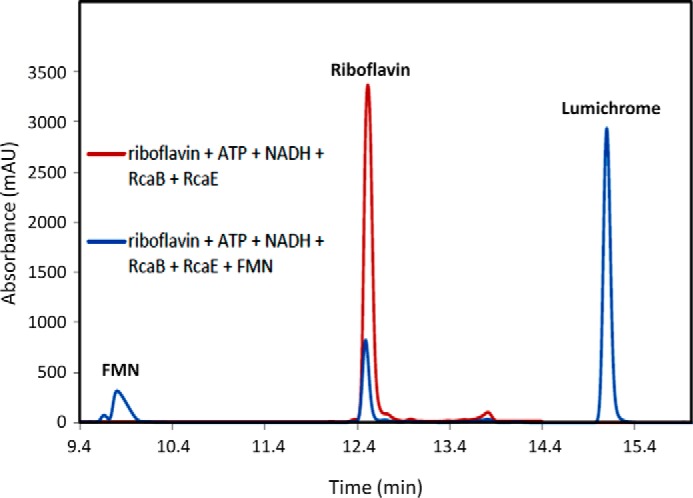
RcaE is an FMN-dependent enzyme. Red trace, HPLC analysis of the RcaE reaction with riboflavin (200 μm), RcaE (4 μm), RcaB (400 nm), and NADH (5 mm) in the absence of RcaA (flavokinase) shows that lumichrome is not formed under these conditions. Blue trace, lumichrome formation is observed when a catalytic amount of FMN (20 μm) is added to the red trace reaction mixture.
FIGURE 9.
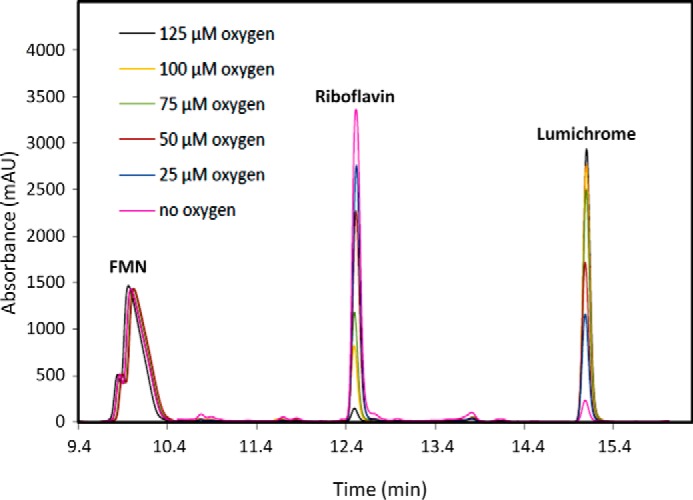
HPLC analysis of the oxygen dependence of the RcaE-catalyzed formation of lumichrome. The RcaE enzymatic reactions were run for 10 min in the presence of riboflavin, FMN, RcaB, NADH, ATP, and oxygen concentrations varying from 25 to 125 μm. No lumichrome formation was observed under anaerobic conditions (pink trace). The trace of lumichrome in this reaction is a contaminant in commercial FMN and riboflavin samples.
Discussion
Initial screening for riboflavin catabolic organisms in soil and sewage samples from Ithaca (New York) and College Station (Texas) was unsuccessful. This suggested that it was necessary to screen from environments richer in riboflavin. With this in mind, riboflavin catabolic microorganisms were readily isolated from dust samples obtained at the DSM riboflavin production plant in Germany. From these M. maritypicum G10, capable of growth on riboflavin as the sole carbon source, was isolated. HPLC analysis of the growth medium from this strain demonstrated the conversion of riboflavin to lumichrome (Fig. 1). Recently another strain of M. maritypicum was isolated from soil samples in Japan and optimized for lumichrome production. The catabolic operon in this strain was not characterized (18).
A cosmid library, prepared from M. maritypicum G10, was screened in S. lividans and two cosmids encoding a riboflavin catabolic cluster were identified. Sequence analysis revealed that the two gene clusters (86% identity, Table 1 and supplemental Table S2) were on different locations in the genome. Based on sequence similarity and in vivo screening of the BamHI fragments of one of the cosmids, the gene cluster was localized to a 6.63-kb DNA fragment. This DNA segment had 8 open reading frames (Fig. 2B and Table 1). Biochemical studies focused on identifying the reactions catalyzed by RcaA, RcaB, RcaD, and RcaE. Based on the sequence analysis, RcaF and RcaG are likely to be involved in riboflavin transport and RcaC in pathway regulation. In addition, RcaH was not studied further because it is not present in the second catabolic cosmid (1A4).
RcaA, RcaB, and RcaD were overexpressed and their predicted activities as riboflavin kinase, riboflavin reductase, and ribokinase, respectively, were confirmed. Sequence analysis of RcaE identified this enzyme as a possible riboflavin-dependent N5,N10-methylene-tetrahydromethanopterin reductase. Being the only remaining unassigned riboflavin-binding protein in the catabolic cluster, it seemed reasonable that RcaE might function as a riboflavin hydrolase. In support of this hypothesis, it was possible to demonstrate that a reaction mixture containing purified RcaA, RcaB, and RcaE catalyzed the conversion of riboflavin to lumichrome and ribose (Fig. 6). Further simplification of the reaction mixture demonstrated that RcaB and RcaE were sufficient to cleave riboflavin to lumichrome and ribose using FMN as the RcaE cofactor (Fig. 8).
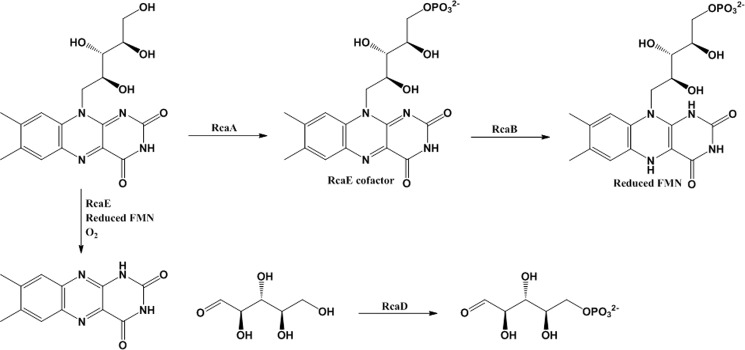
A proposal for riboflavin catabolism in M. maritypicum G10 is shown in Fig. 10. In this proposal, RcaF and RcaG transport riboflavin into the cell (not shown). RcaA phosphorylates riboflavin and RcaB reduces the resulting FMN to generate the active form of the riboflavin hydrolase (RcaE) cofactor. Cleavage of riboflavin to lumichrome and ribose is an oxygen-requiring reaction (Fig. 9). The final step of riboflavin catabolism involves ribose phosphorylation. The mechanism of riboflavin hydrolase does not follow any of the canonical motifs in flavoenzymology and is currently under investigation. One possibility is that reduced FMN generates superoxide, which then triggers the ribose cleavage reaction by hydrogen atom abstraction from C1′ of the riboflavin ribose. The M. maritypicum G10 pathway is considerably simpler than a previously reported pathway in which culture medium metabolites indicated complete isoalloxazine degradation (12). It is likely that cleavage of the ribose from riboflavin terminates riboflavin catabolism because of lumichrome insolubility and that more extensive catabolism requires that the ribose remains bound to the heterocycle throughout the early stages of the isoalloxazine degradation.
FIGURE 10.
Proposed riboflavin catabolic pathway in M. maritypicum G10. In addition to the enzymes shown, sequence analysis suggests that RcaF and RcaG are likely to be involved in riboflavin transport and RcaC in pathway regulation.
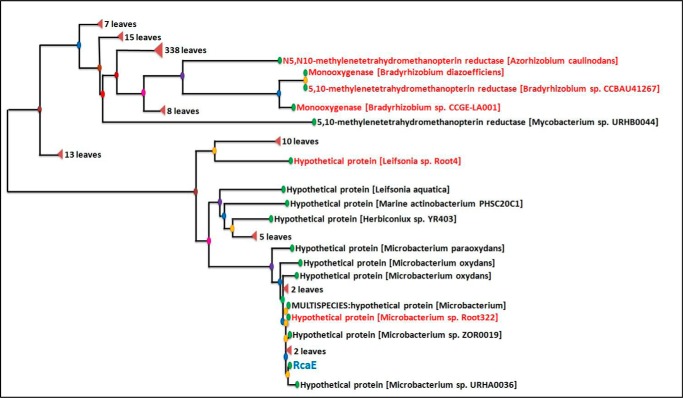
A phylogenetic tree constructed for RcaE using the Fast Minimum Evolution Method is shown in Fig. 11 and suggests that RcaE is narrowly distributed in bacteria. In addition to its intermediacy in riboflavin catabolism, lumichrome has been suggested as a generally important signaling molecule in plant microbe interactions. Lumichrome activates the LasR bacterial quorum sensing receptor (19) and lumichrome produced by Sinorhizobium meliloti is an enhancer of alfalfa root respiration and shoot growth (20). The orthologs marked in red in the phylogenetic tree of RcaE (Fig. 11) show that RcaE is well distributed among rhizosphere bacteria such as Azorhizobium caulinodans, several Bradyrhizobium sp., and root endophytes such as Microbacterium sp. Root322, Leifsonia sp. Root4. Riboflavin catabolism in these species is likely to play an additional signaling role.
FIGURE 11.
Phylogenetic tree for RcaE. All orthologs with >38% sequence identity were included in the phylogenetic tree construction.
Experimental Procedures
Materials
Riboflavin, FMN, NADH, PFBHA, and ribose 5-phosphate were purchased from Sigma. The commercial FMN came with small amounts of riboflavin and lumichrome as impurities. The impurities could not be eliminated after a round of HPLC purification of FMN due to the spontaneous non-enzymatic degradation of FMN. Commercial riboflavin also had trace amounts of lumichrome as an impurity, which showed up as a trace peak on the HPLC only with high concentrations (∼500 μm). The dehydrated form of LB broth and minimal medium salts were purchased from EMD Millipore. Kanamycin, ampicillin, and IPTG were purchased from Lab Scientific Inc. Amicon Ultra centrifugal filter devices (10,000 MWCO) were obtained from Millipore. HisTrap columns were obtained from GE Healthcare. Econo-Pack 10DG desalting columns were purchased from Bio-Rad.
Bacterial Strains and Plasmids, Culture Conditions
S. lividans 1326 was used as the heterologous host for cosmid library screening for the riboflavin catabolic gene cluster. S. lividans 1326 and its derivatives were grown at 30 °C on soy flour-mannitol agar plates for sporulation and conjugation. E. coli DH5α was used for plasmid construction and S17-1 was used for E. coli-Streptomyces conjugation. E. coli BL21(DE3) was used for protein overexpression and E. coli Epi100TM from Epicenter was used for cosmid library construction. The cosmid library was constructed with vector pJTU2463 (21), which is a derivative of pOJ446 with the SCP2 replicon replaced by int and attP from pSET152 (22). Plasmid pXH1 was cloned by inserting an 8.7-kb BamHI fragment from cosmid 5H7 into BamHI/CIP-treated pJTU2463. The strains and plasmids used are shown in supplemental Table S1.
HPLC Parameters
All enzymatic reactions were carried out in potassium phosphate buffer at pH 7.5. For HPLC analysis, an Agilent 1260 HPLC equipped with a quaternary pump, autosampler, column heater, and diode array detector was used. The liquid chromatographic analysis was carried out with a ZORBAX Eclipse XDB-C18 column (15 cm × 4.6 mm, 5 μm particles, Agilent Technologies) with the following combination of solvents: A, water; B, 10 mm ammonium acetate buffer, pH 6.6; C, methanol. The column was pre-equilibrated in 90% A, 10% B, 0% C for 6 min prior to sample injection. This composition was held for 2 min and then changed to 20% A, 10% B, 70% C over 10 min (12 min for RcaA reaction analysis) using a linear gradient. This composition was held for 8 min and then the mixture was returned to 90% A, 10% B, 0% C over an additional 8 min. The flow rate was held constant at 1 ml/min. Data were viewed and processed with ChemStation software DataAnalysis version 4.0 SP 2 (build 274).
LC-MS Parameters
LC-ESI-TOF-MS was performed using an Agilent 1260 HPLC system that was equipped with a binary pump, an autosampler, a column heater, and a 1200 series diode array detector upstream of a MicroToF-Q II mass spectrometer (Bruker Daltonics) using an ESI source in the positive mode. Analysis was performed on an LC-18-T column (15 cm × 3 mm, 3 μm particles, Supelco) with the following combination of solvents at a flow rate of 0.4 ml/min: A, 5 mm ammonium acetate buffer, pH 6.6; B, 75% methanol, 25% water. The column was pre-equilibrated in 100% A prior to sample injection. Upon sample injection the composition was held for 2 min and then changed to 30% A, 70% B over 10 min. This composition was held for 5 min and then the mobile phase was returned to 100% A, 0% B over 1 min. The column was equilibrated for 12 min prior to the injection of the next sample.
Isolation of a Riboflavin Catabolizing Strain
Riboflavin catabolic strains were isolated from the dust at the DSM riboflavin-producing plant (Germany). Bacteria from dust samples were cultured in modified M9 medium (no glucose, 0.1 mm FeCl3, 0.1% LB, 100 μg/ml of riboflavin) for several days. The growing cells were plated on NB plates and single colonies were selected to make a collection. Individual strains were then inoculated into 5 ml of NB and cultured at 30 °C overnight. 1% of each starter culture was inoculated into 50 ml of modified M9 medium. The best strain catabolized riboflavin within 12 h and was selected for further study. The gene encoding 16S rRNA was amplified by PCR (F primer, 5′-CCGAATTCGTCGACAACAGAGTTTGA-3′) and R primer, 5′-CCCGGGATCCAAGCTTACGGCTACCT-3′) (23). The sequence showed that this riboflavin catabolic strain had high homology with M. maritypicum strain DSM12512 and was named M. maritypicum G10.
Identification of the Products of Riboflavin Catabolism
M. maritypicum G10 was inoculated into 5 ml of NB and grown overnight. The starter culture (1%) was inoculated into 50 ml of fresh modified M9 medium with riboflavin as the only carbon source. The cultures were grown in the dark at 30 °C for ∼4 days. For HPLC analysis, 200 μl of culture medium was filtered at various time points using 10-kDa filters and 100 μl was injected onto the HPLC column (Fig. 1A). To determine total lumichrome produced, 500 μl of culture medium was mixed with 500 μl of 1 n KOH and the UV-visible spectrum of the resulting mixture was recorded (Fig. 1B) (24). The lumichrome concentration was determined using a calibration curve constructed using known quantities of lumichrome (2 to 80 μg/ml) dissolved in basic growth medium.
Cosmid Library Screening for the Riboflavin Catabolic Gene Cluster
The cosmid library was constructed in vector pJTU2463 containing oriT for conjugation and integration into the attP site of S. lividans. The genome size of Microbacterium is 4∼5 Mb. and the resulting library consisted of eight 96-well plates. The cosmid mixture from combining each row (12 samples) of the 96-well plates was transformed into E. coli S17-1 and then introduced into S. lividans by conjugation (25) to give the corresponding S. lividans mutant mixture. Sixty-four conjugations were carried out and all the spores of the conjugants from each plate were collected to make one glycerol stock. Each mixture was tested on an M9 riboflavin plate for color bleach. After 7 days at 30 °C, plates with mutants carrying cosmid mixtures from Plate 1, row A (1A), and Plate 5, row H (5H), bleached the riboflavin. Each of the 24 cosmids from rows 1A and 5H was then individually introduced into S. lividans and tested on modified M9 agar plates at 30 °C for 1 week. The bottom layer of the modified plates was M9 medium (no glucose) with 1.6% of agar. The top layer was M9 medium (no glucose), 1.6% agar, 100 μg/ml of riboflavin, and 40 μl of spore stock. Two mutants (1A well 4 and 5H well 7) consumed riboflavin (Fig. 2A).
Sequencing and Annotation of the Riboflavin Catabolic Gene Cluster
Next generation sequencing of cosmids 1A4 and 5H7 was performed by AgriLife Genomics and Bioinformatics Services at Texas A&M University using an Illumina HiSeq 2500 instrument. The raw sequence data were analyzed with FramePlot 4.0 Beta and annotated using the BLAST algorithm and the SEED.
Cloning and Overproduction of His-tagged RcaE and RcaA
The rcaE gene was amplified by PCR using cosmid 5H7 as the template (F primer: 5′-AAAACATATGACCGATCAGAACACCGT-3′, R primer: 5′-AAAAGAATTCAGACACGCGACATCGTC-3′, engineered NdeI and EcoRI sites are underlined). The PCR product was digested with NdeI and EcoRI and ligated into pET28b (digested with NdeI/EcoRI) to generate plasmid pXH-2. This was transformed into E. coli BL21(DE3). The transformants were grown in 3 liters of LB medium with 40 μg/ml of kanamycin at 37 °C to an A600 of 0.5. IPTG was added to an initial concentration of 0.4 mm and incubation was continued at 15 °C for 18 h. The His-tagged RcaE was purified on a Ni-NTA HisTrap HP column (GE Healthcare) and buffer exchanged into 50 mm KH2PO4, 300 mm NaCl, 10% glycerol, pH 7.5, by passing through an Econo-Pac 10DG desalting column (Bio-Rad). The protein was frozen in liquid nitrogen and stored at −80 °C. RcaA was purchased from GenScript and cloned into the pTHT vector. The His-tagged RcaA was overexpressed and purified using the same procedure used for RcaE.
Cloning and Overproduction of RcaB and RcaD
The rcaB gene was amplified by PCR using cosmid 5H7 as the template (F primer: 5′-AAAACATATGACGACTGTCGTGACCGA-3′, R primer: 5′-AAAACTCGAGTTACGCGCTCTCGGGAGC-3′, engineered NdeI and XhoI site are underlined). The PCR product was digested with NdeI and XhoI and ligated into pMAL (NdeI/XhoI) to generate plasmid pXH-3. The plasmid was transformed into BL21(DE3). The transformants were grown in 3 liters of LB medium with 100 μg/ml of ampicillin and 0.5% glucose at 37 °C to an A600 of 0.6. IPTG was added to a final concentration of 0.4 mm and the incubation was continued at 15 °C for 18 h. RcaB was purified on an amylose resin column followed by cleavage of the maltose tag with Factor Xa protease. The solution was then passed through an amylose resin column where the maltose tag was retained in the column and the pure protein was recovered in the flow-through. The purified protein was then exchanged into 50 mm KH2PO4, 300 mm NaCl, 10% glycerol, pH 7.5, by passing through an Econo-Pac 10DG desalting column (Bio-Rad). The protein was frozen in liquid nitrogen and stored at −80 °C. RcaD was similarly overexpressed and purified.
Reconstitution of the RcaA-catalyzed Reaction
A reaction mixture (100 μl) of 20 μm RcaA, 250 μm riboflavin, 5 mm ATP, and 5 mm MgCl2 was incubated at 37 °C for 15 min. Protein was removed by ultrafiltration (10 kDa cut-off filter) and the reaction mixture was analyzed by HPLC (Fig. 3B).
Reconstitution of the RcaB-catalyzed Reaction
A reaction mixture (1 ml) containing 100 nm RcaB, 250 μm NADH, 80 μm FMN (Fig. 4B, left trace) or 1 μm RcaB, 250 μm NADH, 80 μm riboflavin (Fig. 4B, right trace) was placed in a quartz cuvette and the reaction was monitored by following the reduction in the spectrum of oxidized flavin between 400 and 510 nm by UV-visible spectroscopy. Similarly 20 nm RcaB was incubated with 50 μm NADH and 20 μm riboflavin (or FMN) to monitor the relative rates for the oxidation of NADH (Fig. 4C) in the enzymatic reaction between 290 and 410 nm for FMN (left trace) versus riboflavin (right trace). As negative controls, the non-enzymatic reduction of FMN with NADH was monitored between 400 and 510 nm (Fig. 4D). Also the oxidation of NADH by RcaB in the absence of flavins was monitored between 290 and 410 nm (Fig. 4E).
Reconstitution of the RcaD-catalyzed Reaction
A reaction mixture (100 μl) containing 20 μm RcaD, 10 mm ATP, 5 mm MgCl2, 250 μm ribose was incubated at 37 °C for 10 min. Protein was removed by ultrafiltration (10 kDa cut-off) and the product was converted to the corresponding oxime by treatment with 10 mm PFBHA at 65 °C for 1 h and analyzed by LC-MS (Fig. 5B).
Analysis of the Reaction Mixture of RcaE
A reaction mixture (100 μl) containing 10 μm RcaE, 100 nm RcaA, 1 μm RcaB, 500 μm riboflavin, 5 mm NADH, 5 mm MgCl2, and 5 mm ATP was incubated at 37 °C for 0, 1, 2, 5, and 10 min. Protein was removed by ultrafiltration (10 kDa cut-off filter) and the reaction mixture from each time point was analyzed by HPLC (Fig. 6B).
Trapping of the Ribose from Reaction Mixture containing RcaA-E
The reaction mixture after incubation for 10 min with the enzyme mixture was treated with PFBHA at 65 °C for 1 h and the corresponding oxime was analyzed by LC-MS (Fig. 6, C and D).
Requirement for FMN in the RcaE Reaction
A reaction mixture (100 μl) containing 4 μm RcaE, 400 nm RcaB, 200 μm riboflavin, 5 mm NADH, 5 mm MgCl2, and 5 mm ATP in the absence of RcaA was incubated at 37 °C for 10 min. In a second reaction mixture, 20 μm FMN was added to the mixture (100 μl) with 4 μm RcaE, 400 nm RcaB, 200 μm riboflavin, 5 mm NADH, 5 mm MgCl2, and 5 mm ATP and incubated at 37 °C for 10 min. Protein was removed by ultrafiltration (10 kDa cut-off filter) and the two reaction mixtures (with and without catalytic amounts of FMN) were analyzed by HPLC (Fig. 8).
Oxygen Requirement for the RcaE Reaction
In the glove box, a reaction mixture (100 μl) containing 10 μm RcaE, 1 μm RcaB, 500 μm riboflavin, 200 μm FMN, 5 mm NADH was incubated at 37 °C for 10 min with 25, 50, 100, and 125 μm oxygen prepared by appropriately diluting aerobic buffer containing 260 μm oxygen with anaerobic buffer. A reaction with identical conditions was set up in the presence of anaerobic buffer. The reactions were incubated at 37 °C for 10 min. Enzyme was removed by ultrafiltration (10 kDa cut-off filter) and the reaction mixture from each oxygen concentration was analyzed by HPLC (Fig. 9).
Author Contributions
T. P. B. conceived and designed the project. H. X., Y. C., B. P., A. M., and D. B. conducted the experiments and interpreted the results. T. P. B., Y. C., and H. X. wrote the paper. H.-P. H. hosted B. P.'s visit to DSM and provided lab resources for the initial strain screening. All authors reviewed the results and approved the final version of the manuscript.
Supplementary Material
This work was supported by the National Institutes of Health Grant DK44083 and Robert A. Welch Foundation Grant A-0034. The authors declare that they have no conflicts of interest with the contents of this article. The content is solely the responsibility of the authors and does not necessarily represent the official views of the National Institutes of Health.

This article contains supplemental Figs. S1 and S2 and Tables S1 and S2.
- Ni-NTA
- nickel-nitrilotriacetic acid
- PFBHA
- O-(2,3,4,5,6-pentafluorobenzyl)hydroxylamine
- IPTG
- isopropyl 1-thio-β-d-galactopyranoside.
References
- 1. Mukherjee T., McCulloch K. M., Ealick S. E., and Begley T. P. (2010) Cofactor Catabolism, in Comprehensive Natural Products II, Elsevier, Oxford [Google Scholar]
- 2. Unno M., Matsui T., and Ikeda-Saito M. (2007) Structure and catalytic mechanism of heme oxygenase. Nat. Prod. Rep. 24, 553–570 [DOI] [PubMed] [Google Scholar]
- 3. Mukherjee T., Hanes J., Tews I., Ealick S. E., and Begley T. P. (2011) Pyridoxal phosphate: biosynthesis and catabolism. Biochim. Biophys. Acta 1814, 1585–1596 [DOI] [PubMed] [Google Scholar]
- 4. Kincaid V. A., Sullivan E. D., Klein R. D., Noel J. W., Rowlett R. S., and Snider M. J. (2012) Structure and catalytic mechanism of nicotinate (vitamin B3) degradative enzyme maleamate amidohydrolase from Bordetella bronchiseptica RB50. Biochemistry 51, 545–554 [DOI] [PubMed] [Google Scholar]
- 5. Daniel A., and Snider M. (2015) Elucidating the nicotinic acid degradation pathway in Bacillus niacini. FASEB J. 29, 573.19 [Google Scholar]
- 6. Neal R. A. (1968) Bacterial metabolism of thiamine: I. the isolation and characterization of the initial intermediates in the oxidation of thiamine. J. Biol. Chem. 243, 4634–4640 [PubMed] [Google Scholar]
- 7. Neal R. A. (1969) Bacterial metabolism of thiamine: II. the isolation and characterization of 3-(2′-methyl-4′-amino-5′-pyrimidylmethyl)-4-methylthiazole-5-acetic acid (thiamine acetic acid) as an intermediate in the oxidation of thiamine. J. Biol. Chem. 244, 5201–5205 [PubMed] [Google Scholar]
- 8. Neal R. A. (1970) Bacterial metabolism of thiamine: 3. metabolism of thiamine to 3-(2′-methyl-4′-amino-5′-pyrimidylmethyl)-4-methyl-thiazole-5-acetic acid (thiamine acetic acid) by a flavoprotein isolated from a soil microorganism. J. Biol. Chem. 245, 2599–2604 [PubMed] [Google Scholar]
- 9. Bacher A., and Rappold H. (1980) Bacterial degradation of folic acid. Methods Enzymol. 66, 652–656 [DOI] [PubMed] [Google Scholar]
- 10. Smyrniotis P. Z., Miles H. T., and Stadtman E. R. (1958) Isolation and structure proof of 3,4-dimethyl-6-carboxy-α-pyrone as a bacterial degradation product of riboflavin. J. Am. Chem. Soc. 80, 2541–2545 [Google Scholar]
- 11. Im W. B., Roth J. A., McCormick D. B., and Wright L. D. (1970) Bacterial degradation of biotin: V. metabolism of 14C-carbonyl-labeled biotin d-sulfoxide. J. Biol. Chem. 245, 6269–6273 [PubMed] [Google Scholar]
- 12. Harkness D. R., and Stadtman E. R. (1965) Bacterial degradation of riboflavin: VI. enzymatic conversion of riboflavin to 1-ribityl-2,3-diketo-1,2,3,4-tetrahydro-6, 7-dimethylquinoxaline, urea, and carbon dioxide. J. Biol. Chem. 240, 4089–4096 [PubMed] [Google Scholar]
- 13. Foster J. W. (1944) Microbiological aspects of riboflavin: I. introduction. II. bacterial oxidation of riboflavin to lumichrome. J. Bacteriol. 47, 27–41 [DOI] [PMC free article] [PubMed] [Google Scholar]
- 14. Foster J. W. (1944) Microbiological aspects of riboflavin: III. oxidation studies with Pseudomonas riboflavina. J. Bacteriol. 48, 97–111 [DOI] [PMC free article] [PubMed] [Google Scholar]
- 15. Foster J. W., and Yanagita T. (1956) A bacterial riboflavin hydrolase. J. Biol. Chem. 221, 593–607 [PubMed] [Google Scholar]
- 16. Yang C. S., and McCormick D. B. (1971) [164]Riboflavin hydrolase (EC 3.5.99.1) from Pseudomonas riboflavina. Methods Enzymol. 18, 571–573 [Google Scholar]
- 17. Cheng L., Chen W., Zhai L., Xu D., Huang T., Lin S., Zhou X., and Deng Z. (2011) Identification of the gene cluster involved in muraymycin biosynthesis from Streptomyces sp. NRRL 30471. Mol. BioSyst. 7, 920–927 [DOI] [PubMed] [Google Scholar]
- 18. Luzhetskiı̌ A. N., Ostash B. E., and Fedorenko V. A. (2001) Interspecies conjugation of Escherichia coli-Streptomyces globisporus 1912 using integrative plasmid pSET152 and its derivatives. Genetika 37, 1340–1347 [PubMed] [Google Scholar]
- 19. Weisburg W. G., Barns S. M., Pelletier D. A., and Lane D. J. (1991) 16S ribosomal DNA amplification for phylogenetic study. J. Bacteriol. 173, 697–703 [DOI] [PMC free article] [PubMed] [Google Scholar]
- 20. Marchena M., Gil M., Martín C., Organero J. A., Sanchez F., and Douhal A. (2011) Stability and photodynamics of lumichrome structures in water at different pHs and in chemical and biological caging media. J. Phys. Chem. B 115, 2424–2435 [DOI] [PubMed] [Google Scholar]
- 21. Mazodier P., Petter R., and Thompson C. (1989) Intergeneric conjugation between Escherichia coli and Streptomyces species. J. Bacteriol. 171, 3583–3585 [DOI] [PMC free article] [PubMed] [Google Scholar]
- 22. Kieser T., Bibb M. J., Buttner M. J., Chater K. F., and Hopwood D. A. (2000) Practical Streptomyces Genetics, The John Innes Foundation, Norwich, England [Google Scholar]
- 23. Yamamoto K., and Asano Y. (2015) Efficient production of lumichrome by Microbacterium sp. strain TPU 3598. Appl. Environ. Microbiol. 81, 7360–7367 [DOI] [PMC free article] [PubMed] [Google Scholar]
- 24. Rajamani S., Bauer W. D., Robinson J. B., Farrow J. M. 3rd, Pesci E. C., Teplitski M., Gao M., Sayre R. T., and Phillips D. A. (2008) The vitamin riboflavin and its derivative lumichrome activate the LasR bacterial quorum-sensing receptor. Mol. Plant Microbe Interact. 21, 1184–1192 [DOI] [PMC free article] [PubMed] [Google Scholar]
- 25. Phillips D. A., Joseph C. M., Yang G.-P., Martinez-Romero E., Sanborn J. R., and Volpin H. (1999) Identification of lumichrome as a Sinorhizobium enhancer of alfalfa root respiration and shoot growth. Proc. Natl. Acad. Sci. U.S.A. 96, 12275–12280 [DOI] [PMC free article] [PubMed] [Google Scholar]
Associated Data
This section collects any data citations, data availability statements, or supplementary materials included in this article.


