

Summary
Inflammatory conditions and oxidative stress have a crucial role in Down syndrome (DS). Emerging studies have also reported an altered lipid profile in the early stages of DS. Our previous works demonstrate that citrate pathway activation is required for oxygen radical production during inflammation. Here, we find up‐regulation of the citrate pathway and down‐regulation of carnitine/acylcarnitine carrier and carnitine palmitoyl‐transferase 1 genes in cells from children with DS. Interestingly, when the citrate pathway is inhibited, we observe a reduction in oxygen radicals as well as in lipid peroxidation levels. Our preliminary findings provide evidence for a citrate pathway dysregulation, which could be related to some phenotypic traits of people with DS.
Keywords: ATP citrate lyase, citrate pathway, Down syndrome, inflammation, mitochondrial citrate carrier, oxidative stress
Abbreviations
- ACLY
ATP‐citrate lyase
- CAC
carnitine/acylcarnitine carrier
- CIC
citrate carrier
- CPT1
carnitine palmitoyl‐transferase 1
- DS
Down syndrome
- HCA
hydroxycitric acid
- HSA21
human chromosome 21
- NO
nitric oxide
- PBMCs
peripheral blood mononuclear cells
- PPARα
peroxisome‐proliferator‐activated receptor α
- ROS
reactive oxygen species
- SOD1
copper/zinc superoxide dismutase
- TCA
tricarboxylic acid
Introduction
Down syndrome (DS) is a human genetic disorder and the prevailing cause of intellectual disability due to partial or complete chromosome 21 (HSA21) triplication.1, 2 People with DS show an increased risk for various health conditions, such as cardiovascular diseases, gastrointestinal tract abnormalities, obesity, diabetes mellitus and an extremely high and early incidence of Alzheimer disease.1, 2 Early events, such as the over‐expression of APP 3 and S100B 4 – located on HSA21 – and the resultant over‐expression of the pluripotent neuroinflammatory cytokine interleukin‐14 are induced by neuroinflammatory changes in fetuses with DS. These observations highlight the relationships between DS and chronic inflammatory diseases.
A particular finding in DS is the occurrence of permanent oxidative stress.5 One hypothesis is the increased intracellular activity of the cytosolic copper/zinc superoxide dismutase (SOD1), whose gene is located on HSA21. Although SOD1 over‐expression is considered responsible for the persistent oxidative stress, it cannot be excluded that other mechanisms, currently unknown, may contribute to trigger the pro‐oxidant and pro‐inflammatory status in DS. Recently, we identified a new pathway – referred to as ‘the citrate pathway’ – induced in the inflammatory status and involving the citrate, the mitochondrial citrate carrier (CIC) and ATP‐citrate lyase (ACLY).6, 7, 8
The citrate is an important intermediate metabolite and a signal molecule regulating energy metabolism and the functional state of cells.9 After its synthesis in mitochondria from acetyl‐CoA and oxaloacetate, citrate becomes a substrate in the tricarboxylic acid cycle, and its subsequent complete oxidation provides the major source of cellular ATP production. Alternatively, it can be transported outside the mitochondria by the CIC, a member of the mitochondrial carrier family encoded by the SLC25A1 gene. In the cytosol, citrate is cleaved by ACLY to acetyl‐CoA. In turn, acetyl‐CoA is converted to malonyl‐CoA by acetyl‐CoA carboxylase enzyme and channelled into lipogenesis.10 Cytosolic malonyl‐CoA inhibits fatty acid oxidation by allosteric inhibition of carnitine palmitoyl‐transferase 1 (CPT1), hence controlling cellular fatty acid metabolism. In addition, acetyl‐CoA could be used for the cholesterol and isoprenoid synthesis and nuclear histone acetylation in mammalian cells. The second metabolic product, oxaloacetate, generated from the cleavage of citrate, is reduced to malate by cytosolic malate dehydrogenase and converted to pyruvate by malic enzyme in a reaction that generates cytosolic NADPH plus H+ (necessary for fatty acid and sterol synthesis).9 The citrate level inside the cells exerts crucial functions as a key regulator of energy metabolism by inducing (i.e. lipogenesis, fructose‐1,6‐biphosphatase) or inhibiting (i.e. glycolysis, pyruvate kinase) metabolic pathways.9
Considering that (i) citrate is a lipogenic substrate, (ii) dyslipidaemia is an important feature in DS that often leads to overweight and obesity,11 (iii) people with DS show increased oxidative stress and a chronic inflammatory condition, and (iv) obesity itself is an inflammatory condition, we asked whether and to what extent the citrate pathway may be involved in the oxidative stress in DS. Hence, the main aim of this work is to evaluate the contribution of the citrate pathway to oxidative stress by determining the level of the citrate and the expression of SLC25A1 and ACLY genes in individuals with and without DS and by quantifying the amount of pro‐inflammatory molecules in the presence or absence of a citrate pathway inhibitor. Moreover, the expression pattern of lipid catabolism proteins – CPT1, carnitine/acylcarnitine carrier (CAC) and peroxisome‐proliferator‐activated receptor α (PPARα) – is determined and compared with that of anabolic lipid pathway.
Materials and methods
Cell culture and treatment
Samples of heparinized blood from 10 children with DS aged between 3 and 5 years and of 10 age‐matched control children were supplied by the Department of Translational Medical Sciences, Federico II University of Naples. The parents of all children gave written informed consent before participation. Peripheral blood mononuclear cells (PBMCs) were isolated from freshly drawn peripheral venous blood by Ficoll‐Paque (Sigma‐Aldrich, St Louis, MO) density centrifugation at 400 g for 40 min at room temperature (25°).
Epstein–Barr virus‐immortalized lymphoblastoid cells of six children ranging from 3 to 5 years old with DS and of six age‐matched controls were provided by the Department of Translational Medical Sciences, Federico II University of Naples after informed consent was granted by their attending parent or guardian.
Lymphoblastoid cells were grown in RPMI‐1640 medium with 20% fetal bovine serum supplemented with 2 mm l‐glutamine, 100 U penicillin, 160 mg/l gentamicin sulphate and 100 μg/ml streptomycin at 37° in 5% CO2. Where indicated, lymphoblastoid cells were treated for 24 hr with 500 μm hydroxycitric acid (HCA, Sigma‐Aldrich), 50 nm PMA (Sigma‐Aldrich), zymosan (Sigma‐Aldrich), 1 mm NADPH (Sigma‐Aldrich), 5 mm sodium malate (Sigma‐Aldrich) or 5 μm SB‐204990 [(+)‐(3R*,5S*)‐3‐carboxy‐11‐(2,4‐dichlorophenyl)‐3,5‐dihydroxyundecanoic acid, a gift from GlaxoSmithKline, Brentford, UK]. Opsonized zymosan was prepared as reported previously.12
Cytosolic extracts
Cell lysis was carried out in hypotonic buffer (20 mm Tris–HCl, pH 7·4, 10 mm NaCl, 0·5% Nonidet P40, 3 mm MgCl2). Then, cytoplasmic fractions were isolated from each sample by centrifugation at 4° for 10 min at 600 g. Cytosolic extracts were deproteinized using perchloric acid 6 M, then potassium hydroxide 6 M was added to neutralize the solution. Deproteinized extracts were analysed for citrate levels.
Quantification of cytosolic citrate in PBMCs
One hundred microlitres of each sample was mixed with 630 μl of D2O and 70 μl of 4·8 mm 4,4‐dimethyl‐4‐silapentane‐1‐sulphonic acid and placed in a 5 mm nuclear magnetic resonance (NMR) tube. 4,4‐Dimethyl‐4‐silapentane‐1‐sulphonic acid was used as both chemical shift reference and internal standard for quantitative analysis. All samples were at pH 7·4. The NMR spectra were acquired on a Varian Unity Inova 500 MHz spectrometer. The spectrometer was equipped with a 5‐mm triple resonance pulsed field z‐axis gradient probe, operating at 499·96 MHz for 1H.
The temperature during all experiments was kept at 25°. No sample rotation was applied. The 1D 1H NMR spectra were acquired using the water suppression sequence. Two hundred and fifty‐six scans were acquired with a spectral width of 5995 Hz and an acquisition time of 4 seconds. A recycle delay of 1 second was selected. vnmrj (Agilent Technologies, Santa Clara, CA, USA) 2.1B software was used to acquire all the spectra. Spectra were processed using NMR suite 8·0 (Chenomx Inc., Edmonton, Alberta, Canada). 1D spectra were Fourier transformed with FT size of 132 k and a 1 Hz line‐broadening, phased and a polynomial baseline correction was applied over the whole spectral range. The profiler module was used to identify metabolites by fitting the compound signatures from the spectral Chenomx NMR Suite library. Metabolite concentrations were calculated by determining the heights of the signatures best fitting the experimental signals.
Real‐time PCR, SDS–PAGE and Western blotting
Total RNA was extracted and reverse transcribed as reported.13 Real‐time PCR was performed as previously described14 by using ACLY (Hs00982738_m1), CIC (Hs00761590), SREBP1 (Hs01088691), CAC (Hs00386383), CPT1A (Hs00912671), PPARα (Hs00231882) and β‐actin (4326315E) taqMan human assays (Life Technologies, Paisley, UK). For immunoblotting analysis, PBMCs and lymphoblastoid cells were rinsed with ice‐cold PBS and lysed using RIPA buffer. Thirty micrograms of total proteins were heated at 100° for 5 min, separated on 10–12% SDS–polyacrylamide gels and transferred to nitrocellulose membranes. The membranes were then blocked for 1 hr in a PBS solution containing 2% bovine serum albumin and 0·1% Tween‐20, and then treated at room temperature with anti‐ACLY (Aviva Systems Biology, San Diego, CA), anti‐CIC,15 anti‐CAC,16 anti‐CPT1A (Aviva Systems Biology) anti‐PPARα (Santa Cruz Biotechnology, Santa Cruz, CA), anti‐SREBP1 (Santa Cruz Biotechnology), or anti‐β‐actin (Santa Cruz Biotechnology) antibodies. The immunoreaction was detected as described previously.17
Quantification of cytosolic citrate in lymphoblastoid cells
Cytosolic citrate levels were determined with the citrate assay kit (Biovision, Mountain View, CA) as per manufacturer's protocol. Briefly, triplicate samples of lymphoblastoid cells from children with DS or age‐matched controls were collected by centrifugation at 4° and washed twice in chilled water.
Reactive oxygen species, nitric oxide and lipid peroxidation detection
For reactive oxygen species (ROS) analysis, lymphoblastoid cells were incubated with 10 μm 6‐carboxy‐2′,7′‐dichlorodihydrofluorescein diacetate (Life Technologies) for 30 min. The fluorescence was revealed by a GloMax plate reader (Promega, Madison, WI, USA). Where indicated, superoxide anion production was measured using N,N′‐dimethyl‐9,9′‐biacridinium dinitrate (Lucigenin; Abcam, Cambridge, UK) as described by Banskota et al.18 The chemiluminescent signal was also detected by GloMax plate reader (Promega). Nitric oxide was measured using 4‐amino‐5‐methylamino‐2′,7′‐difluorofluorescein diacetate (Life Technologies). Lipid peroxidation was detected by the Lipid Peroxidation Fluorometric Assay Kit (Biovision) as per manufacturer's protocol. Briefly, 1 × 10⁶ cells were homogenized on ice in 300 μl of the malondialdehyde lysis buffer and then centrifuged (13 000 g, 10 min) to remove insoluble material. The supernatant from each homogenized sample was used to fluorometrically quantify malondialdehyde (Ex/Em = 532/553 nm) on a GloMax plate reader.
Statistical analysis
Statistical significance of difference was determined using one‐way analysis of variance. Results are presented as means ± SD of, at least, four independent experiments. Differences were considered as significant (P < 0·05), very significant (P < 0·01) and highly significant (P < 0·001).
Results
Citrate levels, ACLY and SLC25A1 gene expression in PBMCs from children with DS
Previous studies reported that a persistent oxidant insult such as an inflammatory condition are present early in DS.5, 19 However, not all mechanisms are clearly known. Recently, we identified ‘the citrate pathway’ – a new metabolic pathway involving the citrate metabolite, CIC and ACLY enzymes – triggered during inflammation.6, 7, 8 Based on these findings we investigated whether the citrate pathway can contribute to the altered oxidative status observed in individuals with DS. First, we monitored the cytosolic levels of citrate in PBMCs from DS and control participants. The Chenomx Profiler was used to identify the citrate metabolite. To determine the amount of the identified metabolite, we carried out a relative quantification based on fitting the height of the citrate signature that best matched the peak heights in the spectra. Figure 1(a) shows that the citrate levels in PBMCs from children with DS were more than twice as high as the control values.
Figure 1.
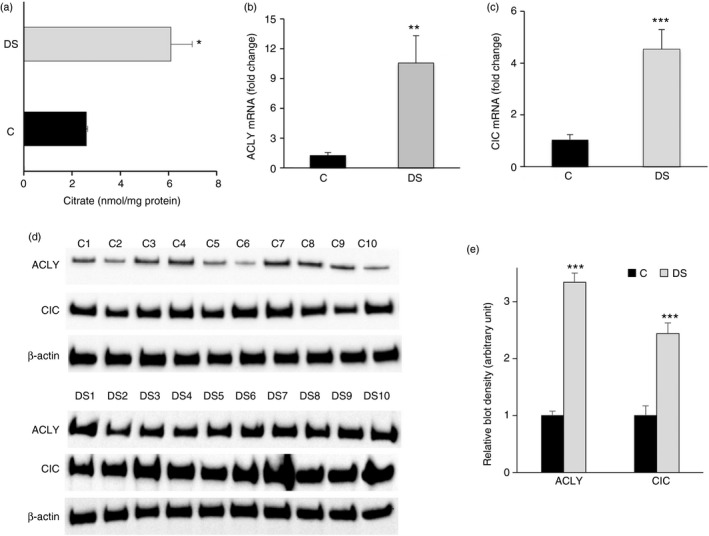
Citrate pathway in peripheral blood mononuclear cells (PBMCs) from children with Down syndrome (DS). (a) Cytosolic citrate levels from PBMCs of three age‐matched control children (black bars) and three (3–5 years old) children with DS (grey bars) were assessed. The amount of citrate was normalized to total proteins in each sample. (b) and (c) Total RNA extracted from PBMCs of three age‐matched controls (black bars) and three (3–5 years old) children with DS (grey bars) was used to quantify ATP‐citrate lyase (ACLY) and citrate carrier (CIC) and mRNAs, respectively. (d) ACLY, CIC and β‐actin proteins from PBMCs of 10 age‐matched controls (C1–C10) and 10 (3–5 years old) children with DS (DS1–DS10) were detected by specific antibodies. Western blotting data are representative of four independent experiments. (e) The intensity of immunolabelled protein bands depicted in (d) was quantified by densitometric scanning. Quantification represents the average of fold change for ACLY and CIC proteins in DS relative to control PBMCs. In (a), (b), (c) and (e), means ± SD of four replicate independent experiments are shown; where indicated differences between samples and relative controls (*P < 0·05, ***P < 0·001) were significant.
Next we evaluated whether higher levels of citrate are related to the expression of two main proteins involved in the citrate pathway, ACLY, which cleaves the citrate into acetyl‐CoA and oxaloacetate, and CIC, which transports citrate outside mitochondria. The expression profile of these genes revealed a 10‐fold and a fourfold increase of ACLY and CIC mRNAs (Fig. 1b,c), respectively, and a significant rise of both ACLY and CIC protein levels in DS when compared with PBMC of age‐matched controls (Fig. 1d,e). Uncropped blot images are shown in the Supplementary material (Fig. S1). This result clearly indicates that the up‐regulation of ACLY and SLC25A1 genes is strictly consistent with high citrate levels of children with DS.
Expression pattern of the citrate pathway in DS cells
To shed more light on the relationship between the citrate pathway and DS, we carried out further experiments in immortalized lymphoblastoid cells from children with DS and age‐matched controls. First, we measured the amount of the cytosolic citrate and found a great increase of this metabolite in lymphoblasts from children with DS than in lymphoblasts from healthy donors (Fig. 2).
Figure 2.
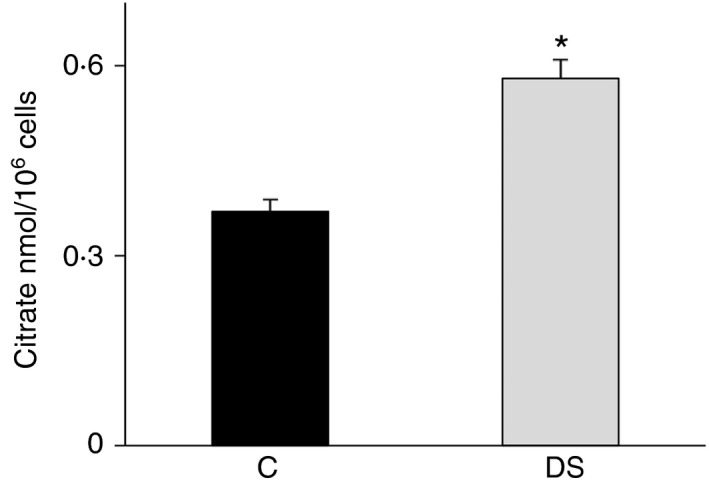
Citrate levels in lymphoblasts from children with Down syndrome (DS). Cytosolic citrate levels of lymphoblastoid cells from six age‐matched controls (black bars) and six children with DS (grey bars) were assessed. The amount of citrate in each sample was normalized to cell number. Means ± SD of four replicate independent experiments are shown; differences between samples and relative controls (*P < 0·05) were significant.
By real‐time PCR and Western blotting, we also analysed the expression pattern of SLC25A1 and ACLY genes. We observed a strong increase in ACLY mRNA and protein levels (Fig. 3a,b). CIC mRNA levels increased by about 100% (Fig. 3a) and a parallel rise in CIC protein was found in DS compared with normal lymphoblasts (Fig. 3b,c). It is noteworthy that the up‐regulation of these genes is consistent with the lipogenic dysregulation found in DS from the earliest stages of life.11 To better highlight the metabolic dysregulation, the expression of the lipogenic sterol regulatory element binding protein 1 (SREBP1) – the major player in lipogenesis gene regulation – was quantified.20 As expected, SREBP1 displayed an up‐regulation in DS compared with control lymphoblastoid cells (Fig. 3a,b). Uncropped blots of a replicate experiment are depicted in the Supplementary material (Fig. S2). Altogether, these data indicate an activation of the citrate pathway in immortalized lymphoblastoid cells from children with DS.
Figure 3.
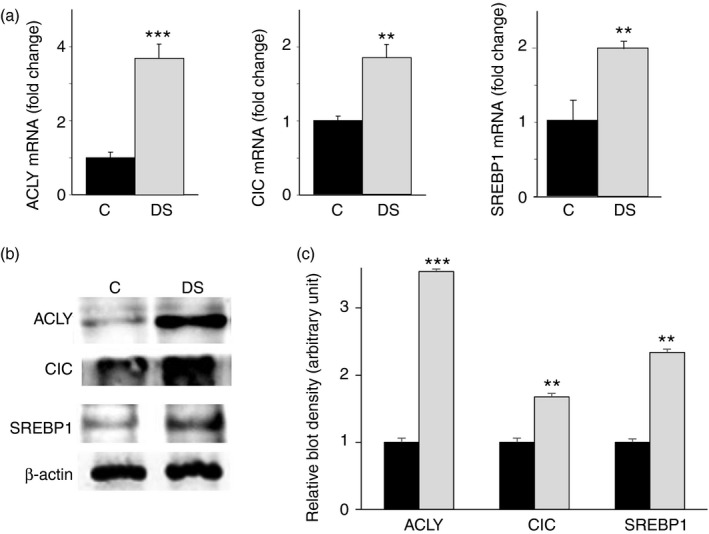
Gene expression of sterol regulatory element binding protein 1 (SREBP1) and citrate pathway proteins in lymphoblasts from children with Down syndrome (DS). (a) Total RNA extracted from lymphoblastoid cells from six age‐matched control children (black bars) and six children with DS (grey bars), was used to quantify ATP‐citrate lyase (ACLY), citrate carrier (CIC) and SREBP1 mRNAs. (b) ACLY, CIC, SREBP1 and β‐actin from lymphoblastoid cells of six age‐matched controls (C) and six children with DS (DS) were detected by specific antibodies. Western blotting data are representative of four independent experiments. (c) The intensity of immunolabelled protein bands depicted in (b) was quantified by densitometric scanning. Quantification represents the average of fold change for ACLY, CIC and SREBP1 proteins in DS relative to control lympoblastoid cells. In (a) and (c), means ± SD of four replicate independent experiments are shown; where indicated differences between samples and relative controls (**P < 0·01, ***P < 0·001) were significant.
Expression of CPTI, CAC and PPARα in DS lymphoblastoid cells
To better understand the metabolic condition of our cellular model, we evaluated the expression of three genes involved in lipid catabolism: the carnitine‐palmitoyltransferase 1 (CPT1), a component of the carnitine shuttle, that controls the fatty acid catabolism,21 the SLC25A20 encoding for the carnitine/acylcarnitine carrier (CAC), another component of the carnitine shuttle, which catalyses the import of acyl‐units – as acyl‐carnitine – into the mitochondria where they are subjected to β‐oxidation21, 22 and PPARα, a well‐known transcriptional factor that binds to the promoter of many genes involved in lipid catabolic pathways.23 As displayed in Fig. 4(a), CAC, CPT1 and PPARα mRNAs exhibited significant down‐regulation of about 70%, 50% and 60%, respectively, in DS compared with control cells. Consistently, a CAC, CPT1 and PPARα protein reduction was also observed (Fig. 4b).
Figure 4.
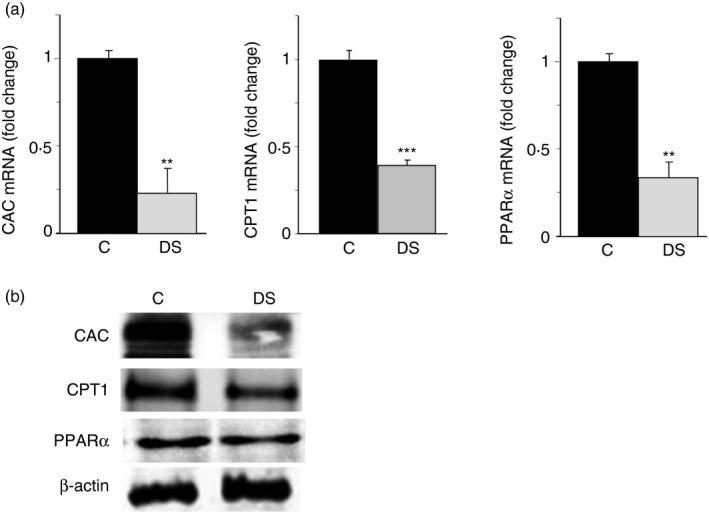
Gene expression of the lipid catabolism proteins in lymphoblasts from children with Down syndrome (DS). (a) Total RNA extracted from lymphoblastoid cells of six age‐matched controls (black bars) and six children with DS (grey bars), was used to quantify carnitine/acylcarnitine carrier (CAC), carnitine palmitoyl‐transferase 1 (CPT1) and peroxisome‐proliferator‐activated receptor α (PPAR α) mRNAs. (b) CAC, CPT1, PPAR α and β‐actin from lympoblastoid cells of six age‐matched control children (C) and six children with DS (DS) were detected by specific antibodies. Western blotting data are representative of four independent experiments. In (a), means ± SD of four replicate independent experiments are shown; where indicated differences between samples and relative controls (**P < 0·01, ***P < 0·001) were significant.
Our findings reveal a dysregulation of lipid catabolism in line with citrate pathway activation in DS lymphoblastoid cells.
Pro‐oxidant and pro‐inflammatory species derived from the citrate pathway activity in DS cells
In keeping with the high activation of the citrate pathway (Figs 2, 3, 4) – strongly induced during inflammation24, 25, 26 – in the next set of experiments we evaluated the production of pro‐oxidant and pro‐inflammatory species contributing to occurrence of oxidative stress in children with DS. As we have previously reported that the citrate pathway activity is tightly related to oxygen radical production in immune cells,9 we assessed ROS and NO production. Consistent with high citrate levels, an 80% and 20% increase in intracellular ROS and NO, respectively, was found in DS cells when compared with control lymphoblasts (Fig. 5a,b).
Figure 5.
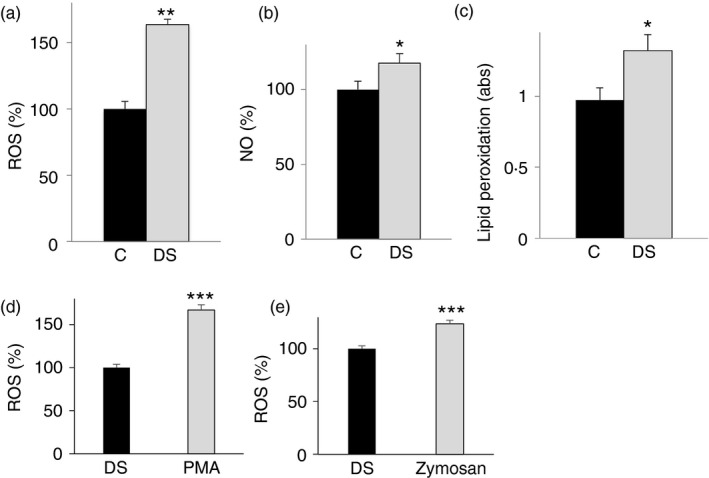
Analysis of oxidative stress in lymphoblasts from children with Down syndrome (DS). Lymphoblastoid cells from six age‐matched control children (black bars) and six children with DS (grey bars) were assayed for reactive oxygen species (ROS) (a), nitric oxide (NO) (b) and lipid peroxidation (c) levels. (d), (e) Lymphoblastoid cells from six children with DS untreated (black bars) or treated (grey bars) with PMA or opsonized zymosan were assayed for superoxide anion radicals by lucigenin assay. In (a), (b), (c), (d) and (e), means ± SD of four replicate independent experiments are shown; where indicated differences between samples and relative controls (*P < 0·05, **P < 0·01) were significant.
The generation of ROS and an altered redox status are common biochemical aspects in many pathological conditions. High oxygen radical levels can react with the polyunsaturated fatty acids of lipid membranes and induce lipid peroxidation. Therefore, we also focused on lipid damage in DS cells. A significant increase of about 40% in lipid peroxidation was observed in DS compared with control lymphoblasts (Fig. 5c), suggesting a similar trend between citrate pathway activity and cellular oxidative status. As we found an increase of ROS in DS cells, in another set of experiments we measured the ability of NADP‐oxidase to produce superoxide anion radicals. To this end, DS cells were stimulated with PMA or opsonized zymosan and then superoxide anion radicals were measured by lucigenin assay. Figure 5(d,e) displays a significant increase in superoxide anions upon both treatments.
To check whether ROS and NO in DS cells were related to citrate pathway activation, we tested the effect of the citrate pathway inhibition on redox status of cells. We treated DS cells with 500 μm HCA, a natural and potent ACLY inhibitor,27 and 5 μm SB‐204990, a specific and more efficiently transported across cell membrane ACLY inhibitor.28, 29 Twenty‐four hours after HCA administration or SB‐204990, a significant reduction in ROS and NO levels compared with control cells was observed (Fig. 6a,b), although both ACLY inhibitors did not completely abolish ROS increase (Fig. 6a). To shed more light on the citrate pathway contribution to the redox status in DS, we treated DS cells with HCA together with NADPH or malate. NADPH is produced by malic enzyme from cytosolic oxaloacetate‐derived malate. Both NADPH and malate are downstream metabolites of the citrate pathway and necessary to produce ROS and NO by NADPH oxidase and induced NO synthase, respectively. As shown in (Fig. 6c,d), when the citrate pathway was inhibited, the addition of NADPH or malate was sufficient to increase ROS as well as NO levels of DS cells. Interestingly, lipid peroxidation was also lower in HCA‐ or SB‐204990‐treated cells than in untreated DS cells (Fig. 6e). These data show that the citrate pathway up‐regulation could be responsible, at least in part, for the oxidative stress in children with DS.
Figure 6.
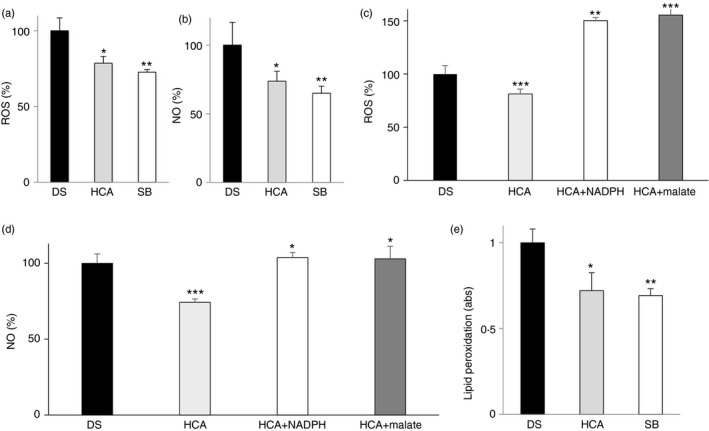
Effect of ATP‐citrate lyase (ACLY) inhibition in lymphoblasts from children with Down syndrome (DS). (a) Reactive oxygen species (ROS), (b) nitric oxide (NO) and (e) lipid peroxidation levels from lympoblastoid cells taken from six children with DS and either untreated (black bars) or treated with 500 μm hydroxycitric acid (HCA) (grey bars) or 5 μm SB‐204990 (white bars) were measured. (c) ROS and NO (d) levels from lympoblastoid cells taken from six children with DS and untreated (black bars) or treated with 500 μm HCA alone (grey bars) or in the presence of NADPH (white bars) or malate (dark grey bars) were measured. In (a), (b), (c), (d) and (e), means ± SD of four replicate independent experiments are shown; where indicated differences between samples and relative controls (*P < 0·05, **P < 0·01) were significant.
Discussion
The pro‐oxidant status is a well‐known hallmark of people with DS. Although an important role is played by the imbalance in the SOD1/catalase activity,30, 31 other mechanisms could be involved. In the current study we demonstrate for the first time that a new player, the citrate pathway, is linked to the persistent oxidative insult detected in DS. In DS cells we observe an increase of the cytosolic citrate levels compared with age‐matched controls. Citrate, beyond the metabolic role of supplying acetyl‐units needed for lipid biosynthesis, can be channelled in the inflammatory pathway in DS. NADPH produced by oxaloacetate – derived from the citrate cleavage – is used for ROS and NO synthesis by NADPH‐oxidase and induced NO synthase, respectively.10 Hence, our data show that a certain amount of cellular ROS and NO increase derives from high levels of cytosolic citrate transported outside mitochondria by the CIC and cleaved by ACLY enzyme. The mechanism by which the citrate levels are higher in individuals with DS than in age‐matched controls is not known. It could be hypothesized that the generation of oxidative stress in DS is a complex process induced not only by the over‐expression of some genes located on HSA21 and imbalance of SOD1/catalase activity, but also by molecular signals, such as citrate – a key metabolic regulator – produced by impairment of metabolic pathways.9, 32
The citrate pathway involvement in DS is demonstrated by hydroxycitrate inhibitor, a natural molecule, or SB‐204990, which partially reduced oxidative stress in DS cells (Fig. 7). Addition of metabolites downstream of the citrate pathway – such as malate or NADPH – abolishes the antioxidant effect of HCA. Hence, in addition to the well‐known nutrients (α‐tocopherol, α‐lipoic acid and ascorbic acid), used to scavenge oxygen‐derived free radicals and modulate some of the DS complications,33 and epigallocatechin‐3‐gallate, found to protect DS cells by improving mitochondrial function,34 hydroxycitrate could be proposed to reduce oxidative stress in individuals with DS. Furthermore, elevated ROS and NO levels are also accompanied by a lipid peroxidation increase. Observed lipid peroxidation rise may be a consequence of both dyslipidaemia and oxidative stress leading to production of lipid peroxyl and lipid alkoxyl radicals. These increased toxic species can induce deleterious signalling cascades, promoting impairment of enzymatic activities.
Figure 7.
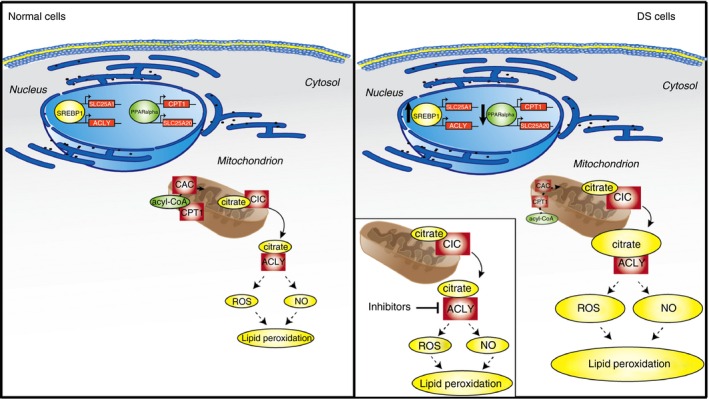
Role of the citrate pathway in Down syndrome (DS). In the nuclei, peroxisome‐proliferator‐activated receptor α (PPAR α) down‐regulates SLC25A20 and carnitine palmitoyl‐transferase 1 (CPT1) genes blocking mitochondrial β‐oxidation. At the same time, sterol regulatory element binding protein 1 (SREBP1) binds to SRE‐responsive elements and activates SLC25A1 and ATP‐citrate lyase (ACLY citrate pathway genes. As a consequence, cytosolic citrate increases, leading to an increase of ROS, NO and lipid peroxidation levels. When ACLY is inhibited by hydroxycitric acid (HCA) or SB‐204990, a partial reduction of the oxidative stress is observed.
Another outcome of our experiments concerns the deregulation of some lipid metabolism genes. Beyond the SLC25A1, ACLY and SREBP1 up‐regulation, we also found that three genes involved in lipid catabolism – CPT1, SLC25A20 and PPARa – are significantly down‐regulated in DS cells. These findings are in line with the reported dysfunction of mitochondrial energy production in DS, due to impairment of complex I, ATP synthase, ATP/ADP carrier and adenylate kinase.35 To explain these results, it could be hypothesized that SREBP1 activation in fetuses36 up‐regulates the citrate pathway by binding to ACLY and SCL25A1 promoter responsive elements.20, 37 As a consequence of CIC and ACLY activity, increased cytosolic citrate levels can contribute to the ROS and NO overproduction found in DS. At the same time, cytosolic citrate is channelled into the lipogenic pathway and leads to high levels of malonyl‐CoA, which inhibits the lipid catabolism.
Although the main goal of this work concerns the relationship between citrate pathway activation and some features of DS, the expression pattern of six genes involved in the lipid metabolism (three catabolic genes: CPT1, SLC25A20 and PPARa; and three anabolic genes: SLC25A1, ACLY and SREBP1) highlights that a lipid dysregulation occurs and is already present in very young children (3–5 years old) with DS long before adulthood.
In conclusion, our preliminary data clearly demonstrate a link between citrate pathway activation and oxidative stress in DS. These results could be a starting point to study cellular mechanisms underlying multiplex features very common in individuals with DS and not yet explained, such as the relationship among oxidative stress, dyslipidaemia and obesity. Identification of a new metabolic pathway related to the cell dysfunctions found in DS may help to find therapeutic strategies to manage some aspects of the DS phenotype. However, further deeper investigations extended to a higher number of participants are needed to better understand the role of the citrate pathway in DS.
Author Contributions
Paolo Convertini conceived and designed the experiments. Paolo Convertini, Alessio Menga, Anna Santarsiero, Iris Scala, Generoso Andria and Maria Antonietta Castiglione Morelli performed the experiments. Vittoria Infantino and Paolo Convertini analysed the data. Vittoria Infantino and Vito Iacobazzi contributed reagents, materials and analysis tools. Vittoria Infantino, Paolo Convertini and Vito Iacobazzi wrote the paper.
Disclosures
The authors declare no conflict of interests.
Supporting information
Figure S1. Uncropped blots of Fig. 1(d) are depicted. ATP‐citrate lyase (ACLY), citrate carrier (CIC) and β‐actin proteins from the peripheral blood mononuclear cells of 10 age‐matched control children (C1–C10) and 10 (3‐ to 5‐year‐old) children with Down Syndrome (DS1–DS10) were detected by specific antibodies.
Figure S2. Uncropped replicates of Fig. 3(b) are shown. ATP‐citrate lyase (ACLY), citrate carrier (CIC), SREBP1 and β‐actin from the lympoblastoid cells of six age‐matched control children (C) and six children with Down syndrome (DS) were detected by specific antibodies.
Acknowledgements
This work was supported by grants from the Area Science Park [grant number J41H09000010007] to V. Infantino, the Ministero dell'Università e della Ricerca (MIUR) and the Universities of Basilicata and Bari ‘Aldo Moro’.
Contributor Information
Vito Iacobazzi, Email: vito.iacobazzi@uniba.it.
Vittoria Infantino, Email: vittoria.infantino@unibas.it.
References
- 1. Roizen NJ, Patterson D. Down's syndrome. Lancet 2003; 361:1281–9. [DOI] [PubMed] [Google Scholar]
- 2. Fujiura GT, Fitzsimons N, Marks B, Chicoine B. Predictors of BMI among adults with Down syndrome: the social context of health promotion. Res Dev Disabil 1997; 18:261–74. [DOI] [PubMed] [Google Scholar]
- 3. Tanzi RE, McClatchey AI, Lamperti ED, Villa‐Komaroff L, Gusella JF, Neve RL. Protease inhibitor domain encoded by an amyloid protein precursor mRNA associated with Alzheimer's disease. Nature 1988; 331:528–30. [DOI] [PubMed] [Google Scholar]
- 4. Griffin WS, Stanley LC, Ling C, White L, MacLeod V, Perrot LJ et al Brain interleukin 1 and S‐100 immunoreactivity are elevated in Down syndrome and Alzheimer disease. Proc Natl Acad Sci USA 1989; 86:7611–5. [DOI] [PMC free article] [PubMed] [Google Scholar]
- 5. Brooksbank BW, Balazs R. Superoxide dismutase, glutathione peroxidase and lipoperoxidation in Down's syndrome fetal brain. Brain Res 1984; 318:37–44. [DOI] [PubMed] [Google Scholar]
- 6. Infantino V, Convertini P, Cucci L, Panaro MA, Di Noia MA, Calvello R et al The mitochondrial citrate carrier: a new player in inflammation. Biochem J 2011; 438:433–6. [DOI] [PubMed] [Google Scholar]
- 7. Infantino V, Iacobazzi V, Menga A, Avantaggiati ML, Palmieri F. A key role of the mitochondrial citrate carrier (SLC25A1) in TNFα‐ and IFNγ‐triggered inflammation. Biochim Biophys Acta 2014; 1839:1217–25. [DOI] [PMC free article] [PubMed] [Google Scholar]
- 8. Infantino V, Iacobazzi V, Palmieri F, Menga A. ATP‐citrate lyase is essential for macrophage inflammatory response. Biochem Biophys Res Commun 2013; 440:105–11. [DOI] [PubMed] [Google Scholar]
- 9. Iacobazzi V, Infantino V. Citrate – new functions for an old metabolite. Biol Chem 2014; 395:387–99. [DOI] [PubMed] [Google Scholar]
- 10. O'Neill LA, Hardie DG. Metabolism of inflammation limited by AMPK and pseudo‐starvation. Nature 2013; 493:346–55. [DOI] [PubMed] [Google Scholar]
- 11. Adelekan T, Magge S, Shults J, Stallings V, Stettler N. Lipid profiles of children with Down syndrome compared with their siblings. Pediatrics 2012; 129:e1382–7. [DOI] [PMC free article] [PubMed] [Google Scholar]
- 12. Bruynzeel PL, Kok PT, Hamelink ML, Kijne AM, Verhagen J. Exclusive leukotriene C4 synthesis by purified human eosinophils induced by opsonized zymosan. FEBS Lett 1985; 189:350–4. [DOI] [PubMed] [Google Scholar]
- 13. Infantino V, Convertini P, Menga A, Iacobazzi V. MEF2C exon α: role in gene activation and differentiation. Gene 2013; 531:355–62. [DOI] [PubMed] [Google Scholar]
- 14. Infantino V, Convertini P, Iacobazzi F, Pisano I, Scarcia P, Iacobazzi V. Identification of a novel Sp1 splice variant as a strong transcriptional activator. Biochem Biophys Res Commun 2011; 412:86–91. [DOI] [PubMed] [Google Scholar]
- 15. Iacobazzi V, Infantino V, Palmieri F. Epigenetic mechanisms and Sp1 regulate mitochondrial citrate carrier gene expression. Biochem Biophys Res Commun 2008; 376:15–20. [DOI] [PubMed] [Google Scholar]
- 16. Convertini P, Infantino V, Bisaccia F, Palmieri F, Iacobazzi V. Role of FOXA and Sp1 in mitochondrial acylcarnitine carrier gene expression in different cell lines. Biochem Biophys Res Commun 2011; 404:376–81. [DOI] [PubMed] [Google Scholar]
- 17. Convertini P, Tramutola F, Iacobazzi V, Lupattelli P, Chiummiento L, Infantino V. Permethylated Anigopreissin A inhibits human hepatoma cell proliferation by mitochondria‐induced apoptosis. Chem Biol Interact 2015; 237:1–8. [DOI] [PubMed] [Google Scholar]
- 18. Banskota S, Regmi SC, Kim JA. NOX1 to NOX2 switch deactivates AMPK and induces invasive phenotype in colon cancer cells through overexpression of MMP‐7. Mol Cancer 2015; 14:123. [DOI] [PMC free article] [PubMed] [Google Scholar]
- 19. Wilcock DM, Griffin WS. Down's syndrome, neuroinflammation, and Alzheimer neuropathogenesis. J Neuroinflammation 2013; 10:84. [DOI] [PMC free article] [PubMed] [Google Scholar]
- 20. Infantino V, Iacobazzi V, De Santis F, Mastrapasqua M, Palmieri F. Transcription of the mitochondrial citrate carrier gene: role of SREBP‐1, upregulation by insulin and downregulation by PUFA. Biochem Biophys Res Commun 2007; 356:249–54. [DOI] [PubMed] [Google Scholar]
- 21. Laghezza A, Pochetti G, Lavecchia A, Fracchiolla G, Faliti S, Piemontese L et al New 2‐(aryloxy)‐3‐phenylpropanoic acids as peroxisome proliferator‐activated receptor α/γ dual agonists able to upregulate mitochondrial carnitine shuttle system gene expression. J Med Chem 2013; 56:60–72. [DOI] [PubMed] [Google Scholar]
- 22. Indiveri C, Iacobazzi V, Tonazzi A, Giangregorio N, Infantino V, Convertini P et al The mitochondrial carnitine/acylcarnitine carrier: function, structure and physiopathology. Mol Aspects Med 2011; 32:223–33. [DOI] [PubMed] [Google Scholar]
- 23. Iacobazzi V, Convertini P, Infantino V, Scarcia P, Todisco S, Palmieri F. Statins, fibrates and retinoic acid upregulate mitochondrial acylcarnitine carrier gene expression. Biochem Biophys Res Commun 2009; 388:643–7. [DOI] [PubMed] [Google Scholar]
- 24. O'Neill LA. Glycolytic reprogramming by TLRs in dendritic cells. Nat Immunol 2014; 15:314–5. [DOI] [PubMed] [Google Scholar]
- 25. O'Neill LA. A critical role for citrate metabolism in LPS signalling. Biochem J 2011; 438:e5–6. [DOI] [PubMed] [Google Scholar]
- 26. Kelly B, O'Neill LA. Metabolic reprogramming in macrophages and dendritic cells in innate immunity. Cell Res 2015; 25:771–84. [DOI] [PMC free article] [PubMed] [Google Scholar]
- 27. Abramson HN. The lipogenesis pathway as a cancer target. J Med Chem 2011; 54:5615–38. [DOI] [PubMed] [Google Scholar]
- 28. Hatzivassiliou G, Zhao F, Bauer DE, Andreadis C, Shaw AN, Dhanak D et al ATP citrate lyase inhibition can suppress tumor cell growth. Cancer Cell 2005; 8:311–21. [DOI] [PubMed] [Google Scholar]
- 29. Pearce NJ, Yates JW, Berkhout TA, Jackson B, Tew D, Boyd H et al The role of ATP citrate‐lyase in the metabolic regulation of plasma lipids. Hypolipidaemic effects of SB‐204990, a lactone prodrug of the potent ATP citrate‐lyase inhibitor SB‐201076. Biochem J 1998; 334(Pt 1):113–9. [DOI] [PMC free article] [PubMed] [Google Scholar]
- 30. Feaster WW, Kwok LW, Epstein CJ. Dosage effects for superoxide dismutase‐1 in nucleated cells aneuploid for chromosome 21. Am J Hum Genet 1977; 29:563–70. [PMC free article] [PubMed] [Google Scholar]
- 31. de Haan JB, Cristiano F, Iannello R, Bladier C, Kelner MJ, Kola I. Elevation in the ratio of Cu/Zn‐superoxide dismutase to glutathione peroxidase activity induces features of cellular senescence and this effect is mediated by hydrogen peroxide. Hum Mol Genet 1996; 5:283–92. [DOI] [PubMed] [Google Scholar]
- 32. O'Neill LA. A broken Krebs cycle in macrophages. Immunity 2015; 42:393–4. [DOI] [PubMed] [Google Scholar]
- 33. Lott IT, Doran E, Nguyen VQ, Tournay A, Head E, Gillen DL. Down syndrome and dementia: a randomized, controlled trial of antioxidant supplementation. Am J Med Genet A 2011; 155A:1939–48. [DOI] [PMC free article] [PubMed] [Google Scholar]
- 34. Valenti D, De Rasmo D, Signorile A, Rossi L, de Bari L, Scala I et al Epigallocatechin‐3‐gallate prevents oxidative phosphorylation deficit and promotes mitochondrial biogenesis in human cells from subjects with Down's syndrome. Biochim Biophys Acta 2013; 1832:542–52. [DOI] [PubMed] [Google Scholar]
- 35. Valenti D, Manente GA, Moro L, Marra E, Vacca RA. Deficit of complex I activity in human skin fibroblasts with chromosome 21 trisomy and overproduction of reactive oxygen species by mitochondria: involvement of the cAMP/PKA signalling pathway. Biochem J 2011; 435:679–88. [DOI] [PubMed] [Google Scholar]
- 36. Diomede L, Salmona M, Albani D, Bianchi M, Bruno A, Salmona S et al Alteration of SREBP activation in liver of trisomy 21 fetuses. Biochem Biophys Res Commun 1999; 260:499–503. [DOI] [PubMed] [Google Scholar]
- 37. Amemiya‐Kudo M, Shimano H, Hasty AH, Yahagi N, Yoshikawa T, Matsuzaka T et al Transcriptional activities of nuclear SREBP‐1a, ‐1c, and ‐2 to different target promoters of lipogenic and cholesterogenic genes. J Lipid Res 2002; 43:1220–35. [PubMed] [Google Scholar]
Associated Data
This section collects any data citations, data availability statements, or supplementary materials included in this article.
Supplementary Materials
Figure S1. Uncropped blots of Fig. 1(d) are depicted. ATP‐citrate lyase (ACLY), citrate carrier (CIC) and β‐actin proteins from the peripheral blood mononuclear cells of 10 age‐matched control children (C1–C10) and 10 (3‐ to 5‐year‐old) children with Down Syndrome (DS1–DS10) were detected by specific antibodies.
Figure S2. Uncropped replicates of Fig. 3(b) are shown. ATP‐citrate lyase (ACLY), citrate carrier (CIC), SREBP1 and β‐actin from the lympoblastoid cells of six age‐matched control children (C) and six children with Down syndrome (DS) were detected by specific antibodies.