Abstract
We present a method for estimating the thickness of thin turbid layers using defocusing micro-spatially offset Raman spectroscopy (micro-SORS). The approach, applicable to highly turbid systems, enables one to predict depths in excess of those accessible with conventional Raman microscopy. The technique can be used, for example, to establish the paint layer thickness on cultural heritage objects, such as panel canvases, mural paintings, painted statues and decorated objects. Other applications include analysis in polymer, biological and biomedical disciplines, catalytic and forensics sciences where highly turbid overlayers are often present and where invasive probing may not be possible or is undesirable. The method comprises two stages: (i) a calibration step for training the method on a well characterized sample set with a known thickness, and (ii) a prediction step where the prediction of layer thickness is carried out non-invasively on samples of unknown thickness of the same chemical and physical make up as the calibration set. An illustrative example of a practical deployment of this method is the analysis of larger areas of paintings. In this case, first, a calibration would be performed on a fragment of painting of a known thickness (e.g. derived from cross-sectional analysis) and subsequently the analysis of thickness across larger areas of painting could then be carried out non-invasively. The performance of the method is compared with that of the more established optical coherence tomography (OCT) technique on identical sample set.
This article is part of the themed issue ‘Raman spectroscopy in art and archaeology’.
Keywords: spatially offset Raman spectroscopy, optical coherence tomography, non-invasive, thickness, cultural heritage
1. Introduction
Non-invasive analysis of thin stratified turbid (diffusely scattering) layers is an analytical goal pertinent to a wide range of disciplines. For instance, many analytical problems in art require non-invasive probing of thin stratified layers of paint. The sublayer information such as chemical make-up and the thickness is important, for example, in art to develop a deeper understanding of the artist's technique, artwork history and to supply background information for suitable conservation procedures. Although this can be ascertained by invasive cross-sectional analysis, in many such applications invasive sampling needs to be strictly minimized and in some cases avoided completely due to the uniqueness and high cultural value of the objects often analysed. Painted layers of panels, canvases, mural paintings and painted statues are by their nature highly turbid and typically only a few tens of micrometres thick, often spread in multiple stratigraphy. Owing to these properties the sublayers are frequently inaccessible by conventional Raman microscopy [1,2]. This is just one area illustrating the analytical need but there are many others, across multiple disciplines, where such capability would be beneficial. These include polymer, catalytic, biological and biomedical applications and forensics sciences where highly turbid stratified layers are present.
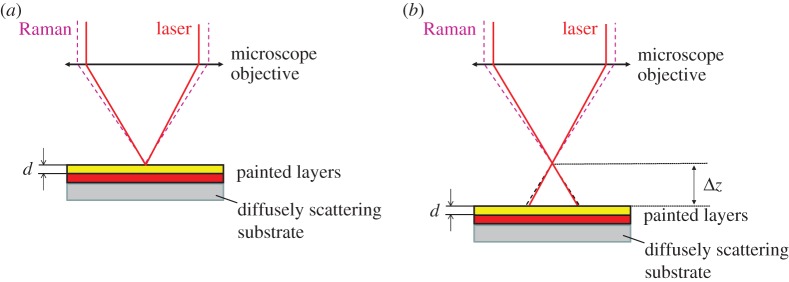
Recently, a new concept in Raman microscopy providing substantially higher penetration depths than conventional Raman microscopy has emerged—micro-SORS [1,2], building on earlier advances of its parent technique, spatially offset Raman spectroscopy (SORS) [3]. The most basic variant of micro-SORS is defocusing micro-SORS [1] (figure 1). This approach is not the most effective in existence because it does not involve fully separated laser illumination and Raman collection zones as in classical SORS. On the other hand, it may be the most practical as the existing Raman microscopes without any modifications may be used for this purpose. A basic defocusing micro-SORS measurement on a two layer turbid system consists of collecting at least two Raman spectra at different distances of microscope objective from sample. From this measurement the Raman spectra of individual layers can be obtained.
Figure 1.
Schematic of defocusing micro-SORS used to determining the thickness of overlayer, d, within a diffusely scattering (turbid) sample. (a) Imaged and (b) defocused. (Online version in colour.)
In this study, we demonstrate, for the first time, an ability to retrieve not only the chemical make-up of individual layers but also the thickness of the top layer from a set of micro-SORS measurements. The concept builds on parallel advances of its macroscale variant, SORS, where similar capability was demonstrated with, for example, biological tissues on the macroscale [4]. The output of micro-SORS is compared with the results of the optical coherence tomography (OCT) technique that has emerged in substitution of invasive methods capable of recovering the cross-sectional structural information. OCT is a well established optical interferometric technique, particularly suited for probing semi-transparent materials in the medical field, mainly in ophthalmology, and recently also in cultural heritage to study stratified systems of paintings [5–9].
2. Experimental procedure
(a). Samples and cross-sectional analysis to determining their actual thickness
The specimens consisted of painted layers simulating a real artistic stratigraphy. Two common pigments were used, red ochre (haematite—Fe2O3) and phthalocyanine blue (C32H16N8Cu), both mixed in acrylic media, here referred to as ‘R’ (red) and ‘B’ (blue). Red ochre was spread on top of the phthalocyanine blue layer, which itself was deposited on a paper sheet as substrate (500 µm thick). The specimens were prepared at varying thickness of the top layer, in a range approximately from 20 to 120 µm, in an attempt to obtain semi-homogeneous layers in each case, in terms of both thickness and distribution of the pigment within the layer. Microscopic observations of cross-sections in reflected light using a Leitz Ortholux microscope with Ultropack illuminator allowed verification of the actual thickness of the layers; the results of the measurements are reported in table 1. The thickness of the bottom layer was kept constant (between 40 and 45 µm).
Table 1.
Investigated samples and thickness of the layers.
| layer thickness (µm) |
||
|---|---|---|
| sample | top (red ochre) | bottom (phthalocyanine blue) |
| S1 | 21 | 40–45 |
| S2 | 24 | 40–45 |
| S3 | 27 | 40–45 |
| S4 | 43 | 40–45 |
| S5 | 45 | 40–45 |
| S6 | 56 | 40–45 |
| S7 | 73 | 40–45 |
| S8 | 121 | 40–45 |
(b). Defocusing micro-spatially offset Raman spectroscopy
Defocusing micro-SORS measurements were carried out using a Senterra dispersive micro-Raman spectrometer (Bruker Optik GmbH) that included a standard confocal optical microscope (Olympus BX51). The Raman spectra were acquired using 20× objective (WD 1.3 mm, NA 0.4) and a laser of 785 nm excitation wavelength (nominal power 100 mW), a Peltier cooled CCD detector (1024 × 256 pixels), 1200 grooves mm−1 grating and the largest available confocal slit (50 × 1000 µm). The spectra were acquired with acquisition time of 10 s and 20 accumulations (i.e. the total acquisition time per sample position was 200 s). Combined sample illumination and collection area at the ‘imaged’ position (Δz = 0) with the 20× objective was estimated to be approximately 4 µm in diameter.
A sequence of nine measurements at defocusing distances, Δz = 0, 20, 50, 70, 100, 200, 500, 800, 1000 µm was acquired for each (S1–8) sample in five different locations.
(c). Micro-spatially offset Raman spectroscopy data analysis
The standard multivariate method (PLS) partial least-squares was used to provide thickness prediction capability. The analysis was performed using software package Eigenvector Solo 8.1.1 (Eigenvector Research Inc., Manson, WA, USA). The method was first trained on a calibration sample set consisting of three sets of independent measurements performed on each sample. Subsequently, the prediction was performed on a set of two different measurements carried out on each sample. All the five sets of SORS measurements were carried out at different sample locations separated by approximately 1 mm from each other. As the sample thickness varied from a location to location by a small amount (approx. ±5 µm and ±10 µm in depth per mm lateral displacement for S1–3 and S4–8, respectively), the data were subject to a small depth error. The nominal thickness to the set was assigned as a result of a measurement at several locations around the probed zone.
The depth predictions have been carried out using two representative Δz shifts, ‘0’ corresponding to conventional Raman microscopy and 500 µm representing micro-SORS measurement. In the PLS analysis the relative intensities of Raman spectra of top and bottom layers are analysed globally across the spectrum (the technique in principle senses the relative intensities between the two layers which encode the depth). It should also be noted that reference spectra are shown in figures only for comparison—these were not used in the analysis.
Pre-processing consisted of taking first derivative to eliminate background followed by normalization to area. The spectral range from 900 to 1700 cm−1 was analysed and three latent variables were used.
(d). Optical coherence tomography
The OCT technique returns stratigraphic sections at high spatial resolution of transparent or diffusely scattering (semi-transparent) objects with no need of sample contact. In the OCT prototype used here for stratigraphic analyses, a time-domain set-up is associated with confocal microscope optics, which allows for a lateral resolution down to 2.5 µm [9–11]. The spectral width (λ = 100 nm) of the light source centred at λ = 1550 nm determines the axial resolution (approx. 10 µm in air). The working distance of the objective from the surface was about 3 mm.
The OCT thickness values are calculated as an average of six estimates extracted from two 15 mm long OCT profiles acquired with 5 µm lateral sampling step for each sample. One estimate is a mean of 100 µm (20 lateral pixels on OCT scan). The OCT results presented are corrected for the refraction index of the top (red) layer at 1550 nm estimated to be n ∼ 2.
3. Results and discussion
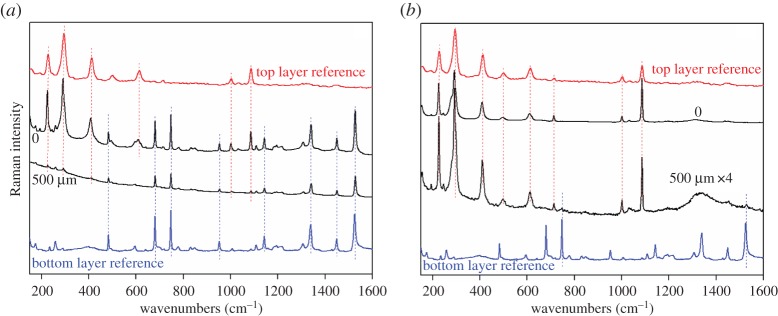
Representative micro-SORS spectra for defocusing distances of 0 (imaged) and 500 µm used in the subsequent PLS analysis are shown in figure 2. The spectral variation of the surface layer and sublayer as a function of top layer thickness is clearly seen from the data on visual inspection.
Figure 2.
Representative micro-SORS spectra for 0 and 500 µm defocusing distances for (a) 20 µm top layer thickness (S1) and (b) 120 µm top layer thickness (S8), where the 500 µm spectrum is enhanced (×) to better visualize the Raman pattern. (Online version in colour.)
As mentioned above, each micro-SORS measurement was repeated five times at different sample locations and these were split into three sets for calibration and two for prediction in the PLS analysis. As the data were stripped of baseline and normalized, the thickness information was retained in the relative change between the Raman spectra of the two layers present. The 0 (imaged) and defocused data at 500 µm were analysed separately by PLS. The former representing conventional Raman microscopy approach and the latter micro-SORS measurement.
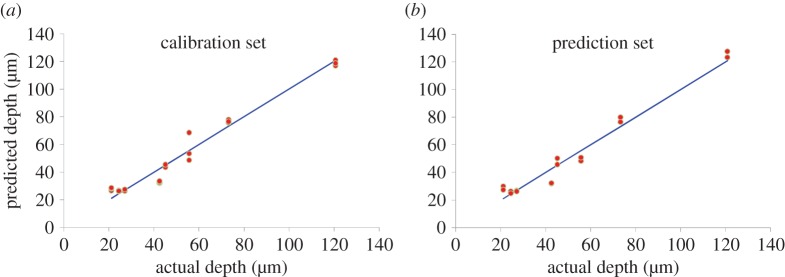
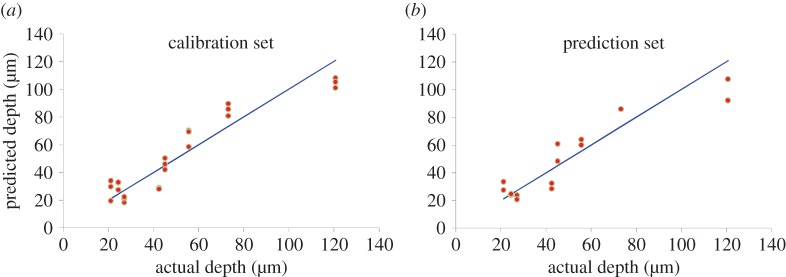
Good thickness predictability was reached with micro-SORS for all available sample depths with the prediction error of approximately ±6 µm (figure 3). Conventional Raman microscopy also enabled the determination of thickness but with twice as large error of prediction (±12 µm; figure 4).
Figure 3.
(a) Calibration (R2 = 0.969, RMSEC—root mean square error of calibration = 5.46 µm) and (b) predicted thickness (R2 = 0.968, RMSEP—root mean square error of prediction = 5.84 µm) derived from non-invasive defocusing micro-SORS data at Δz = 500 µm using PLS analysis plotted as a function of thickness measured using optical microscopy on sample cross-sections. (Online version in colour.)
Figure 4.
Comparative (a) calibration (R2 = 0.876, RMSEC = 10.9 µm) and (b) predicted thickness (R2 = 0.857, RMSEP = 11.7 µm) derived from conventional Raman microscopy (0 µm defocusing) using PLS analysis plotted as a function of thickness measured using optical microscopy on sample cross-sections. (Online version in colour.)
As for micro-SORS, even larger penetration depths can be expected from the deployment of full micro-SORS, a micro-SORS variant consisting of fully separated laser illumination and Raman collection points, which, as demonstrated earlier, can achieve considerably higher penetration depths than defocusing micro-SORS [12,13]. On the other hand, the usable range of depths for full micro-SORS is anticipated to be smaller for a given spatial offset than that for defocusing micro-SORS for a given defocusing distance. This is due to larger selectivity of full micro-SORS to a specific depth. As such, the top layer might become undetectable for larger spatial offsets with full SORS despite satisfactorily rendering the depth of deeper layers as the majority of the signal can originate from the deeper layers and very little from the surface layer yielding its Raman signature potentially undetectable. This effect can, however, be readily mitigated by using different spatial offsets for different ranges of thickness with full micro-SORS, with each offset tailored to a particular thickness range.
An alternative method for the non-invasive thickness estimate of such layers is OCT. We have performed measurements on the same sample set to provide comparative data. An example of an OCT scan acquired on sample S4 is shown figure 5. The results of OCT measurements, corrected for the refractive index, were reported in comparison with those achieved with the defocusing micro-SORS (figure 6). The data provided a high-quality prediction exceeding or comparable with that of micro-SORS. Notably, the OCT reached the limit of detection at 73 µm in the concerned situation due to the high turbidity of the top red layer. We were unable to discern the stratigraphy above this thickness as all the incoming radiation was scattered/absorbed by the top layer. The blue (sublayer) layer is more transparent at the used OCT wavelength and probably thicker samples could be tackled if this one was present as an over layer. By contrast, micro-SORS provided deeper visibility within the red layer—the detection limit has not been reached up to the maximum red layer thickness of 120 µm analysed. It should be noted that micro-SORS requires a priori calibration on a samples set made of the same or similar physical and chemical constituency. On the contrary, OCT may provide the real thickness values, without any calibration sample set, as long as the index of refraction of the layer can be determined.
Figure 5.
Representative OCT scan of sample S4.
Figure 6.
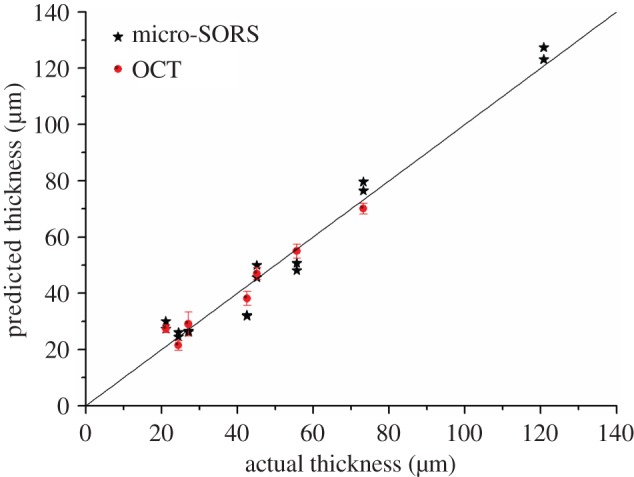
Comparative OCT (R2 = 0.952, RMSEP = 4.30 µm) and defocusing micro-SORS predicted thicknesses plotted as a function of thickness measured using optical microscopy on sample cross-sections. (The straight line represents a 1 : 1 correspondence with optical measured thickness).
The above results point at the beneficial application areas of micro-SORS. Where applicable, OCT provides a faster, simpler non-invasive method. Micro-SORS can, however, become relevant in situations where OCT is not applicable. For example, where real-layer thickness exceeds the maximum accessible depth of OCT. The higher accessible depth of micro-SORS is facilitated by the fact that the method relies on the diffuse component of light and can, in principle, therefore, achieve large penetration depths in turbid samples as demonstrated, for example, in this study. By contrast, OCT by its nature relies on direct imaging within the sample and therefore on transparency, or at least partial transparency, of sample at the probe wavelength. This limits its applicability to depths and materials from which non-scattered component of light can be recovered.
In general, the micro-SORS method has its limitations restricting its applicability in some areas. These include inapplicability to highly absorbing samples with extremely thin (a few micrometres) sublayers relative to the surface layer and compounds with low Raman cross-sections at the subsurface position. In addition, samples possessing very high heterogeneity across their surface or within sublayers may require the adoption of a more complex data acquisition methodology [2]. For further insight into the related concepts and underlying processes the readers are directed to a study of Conti et al. [14] that contrasts differences and commonalities of conventional confocal Raman microscopy with micro-SORS.
4. Conclusion
In this proof-of-concept study, we have demonstrated that micro-SORS is capable of predicting the thickness of thin turbid layers of paints in situations where a calibration sample set can be obtained a priori. Considerably, higher prediction accuracy was achieved using micro-SORS compared with conventional Raman microscopy.
The technique was also compared with OCT. In the studied situation, a higher penetration depth was attained with micro-SORS compared with the OCT approach. However, micro-SORS requires calibration on a dataset of known thickness whereas OCT is a high-resolution imaging method capable of precise description of layer distribution including local inhomogeneities. On the other hand, OCT is limited, to date, to physical or functional characterization while micro-SORS may provide both chemical and thickness information and specificity.
The micro-SORS technique promises further extension of accessible depths using fully separated collection and illumination zones [12]. Given the wide applicability of the technique and the potential for further improvements, the concept of micro-SORS is expected to find a number of practical application niches in a several areas including art, archaeology, forensics, catalytic research, biology and biomedical sciences. It provides a complementary analytical capability to conventional Raman microscopy, in particular, in situations where the accessible depths of conventional Raman microscopy are inadequate.
Authors' contributions
Cl.C. carried out the spectroscopic analyses, participated in the design of the study and drafted the manuscript; M.R. carried out the preparation of specimens, participated in the design of the study; Ch.C. participated in data analysis, A.B. participated in the Raman measurements, Mo.B. carried out the optical microscope observations and acquisition of layer thickness measurements, J.S. and Ma.B. collected and analysed optical coherence tomography measurements and helped draft the manuscript, P.M. coordinated the study, carried out the micro-SORS data analysis and helped draft the manuscript. All authors gave final approval for publication.
Competing interests
The authors declare that they have no competing interests.
Funding
J.S. is supported by IPERION CH project GA 654028, funded by EU community's H2020-research infrastructure programme.
References
- 1.Conti C, Colombo C, Realini M, Zerbi G, Matousek P. 2014. Subsurface Raman analysis of thin painted layers. Appl. Spectrosc. 68, 686–691. ( 10.1366/13-07376) [DOI] [PubMed] [Google Scholar]
- 2.Conti C, Realini M, Colombo C, Matousek P. 2015. Subsurface analysis of painted sculptures and plasters using micrometre-scale spatially offset Raman spectroscopy (micro-SORS). J. Raman Spectrosc. 46, 476–483. ( 10.1002/jrs.4673) [DOI] [Google Scholar]
- 3.Matousek P, Clark IP, Draper ERC, Morris MD, Goodship AE, Everall N, Towrie M, Finney WF, Parker AW. 2005. Subsurface probing in diffusely scattering media using spatially offset Raman spectroscopy. Appl. Spectrosc. 59, 393–400. ( 10.1366/0003702053641450) [DOI] [PubMed] [Google Scholar]
- 4.Macleod NA, Goodship A, Parker AW, Matousek P. 2008. Prediction of sublayer depth in turbid media using spatially offset Raman spectroscopy. Anal. Chem. 80, 8146–8152. ( 10.1021/ac801219a) [DOI] [PubMed] [Google Scholar]
- 5.Wojtkowski M. 2010. High-speed optical coherence tomography: basics and applications. Appl. Opt. 49, D30–D61. ( 10.1364/AO.49.000D30) [DOI] [PubMed] [Google Scholar]
- 6.Targowski P, Ivanicka M. 2012. Optical coherence tomography: its role in the non-invasive structural examination and conservation of cultural heritage objects—a review. Appl. Phys. A 106, 265–277. ( 10.1007/s00339-011-6687-3) [DOI] [Google Scholar]
- 7.Liang H, Lange R, Peric B, Spring M. 2013. Optimum spectral window for imaging of art with optical coherence tomography. Appl. Phys. B 111, 589–602. ( 10.1007/s00340-013-5378-5) [DOI] [Google Scholar]
- 8.Cheung CS, Daniel JMO, Tokurakawa M, Clarkson WA, Liang H. 2014. Optical coherence tomography in the 2-μm wavelength regime for paint and other high opacity materials. Opt. Lett. 39, 6509–6512. ( 10.1364/OL.39.006509) [DOI] [PubMed] [Google Scholar]
- 9.Striova J, Fontana R, Barucci M, Felici A, Marconi E, Pampaloni E, Raffaelli M, Riminesi C. 2016. Optical devices provide unprecedented insights into the laser cleaning of calcium oxalate layers. Microchem. J. 124, 331–337. ( 10.1016/j.microc.2015.09.005) [DOI] [Google Scholar]
- 10.Fontana R, Barucci M, Pampaloni E, Pezzati L, Daffara C. 2013. Proc. of SPIE 8790, Optics for Arts, Architecture, and Archaeology IV (eds L Pezzati, P Targowski), O1-9. Bellingham, WA: SPIE. [DOI] [PubMed]
- 11.Striova J, Salvadori B, Fontana R, Sansonetti A, Barucci M, Pampaloni E, Marconi E, Pezzati L, Colombini MP. 2015. Optical and spectroscopic tools for evaluating Er:YAG laser removal of shellac varnish. Stud. Conserv. 60, S1–S6. ( 10.1179/0039363015Z.000000000213) [DOI] [Google Scholar]
- 12.Conti C, Colombo C, Realini M, Matousek P. 2015. Comparison of key modalities of micro-scale spatially offset Raman spectroscopy. Analyst 140, 8127–8133. ( 10.1039/C5AN01900A) [DOI] [PubMed] [Google Scholar]
- 13.Matousek P, Conti C, Realini M, Colombo C. 2016. Micro-scale spatially offset Raman spectroscopy for non-invasive subsurface analysis of turbid materials. Analyst 141, 731–739. ( 10.1039/C5AN02129D) [DOI] [PubMed] [Google Scholar]
- 14.Conti C, Realini M, Colombo C, Matousek P. 2015. Contrasting confocal with defocusing microscale spatially offset Raman spectroscopy. J. Raman Spectrosc. 47, 565–570. ( 10.1002/jrs.4851) [DOI] [Google Scholar]


