

Abstract
Disease can play an important role in structuring species communities because the effects of disease vary among hosts; some species are driven towards extinction, while others suffer relatively little impact. Why disease impacts vary among host species remains poorly understood for most multi-host pathogens, and factors allowing less-susceptible species to persist could be useful in conserving highly affected species. White-nose syndrome (WNS), an emerging fungal disease of bats, has decimated some species while sympatric and closely related species have experienced little effect. We analysed data on infection prevalence, fungal loads and environmental factors to determine how variation in infection among sympatric host species influenced the severity of WNS population impacts. Intense transmission resulted in almost uniformly high prevalence in all species. By contrast, fungal loads varied over 3 orders of magnitude among species, and explained 98% of the variation among species in disease impacts. Fungal loads increased with hibernating roosting temperatures, with bats roosting at warmer temperatures having higher fungal loads and suffering greater WNS impacts. We also found evidence of a threshold fungal load, above which the probability of mortality may increase sharply, and this threshold was similar for multiple species. This study demonstrates how differences in behavioural traits among species—in this case microclimate preferences—that may have been previously adaptive can be deleterious after the introduction of a new pathogen. Management to reduce pathogen loads rather than exposure may be an effective way of reducing disease impact and preventing species extinctions.
This article is part of the themed issue ‘Tackling emerging fungal threats to animal health, food security and ecosystem resilience’.
Keywords: emerging infectious disease, multi-host pathogen, wildlife disease, Myotis lucifugus, white-nose syndrome, Geomyces destructans
1. Introduction
Emerging infectious diseases are an important threat to wildlife populations [1]. Increases in human trade and travel over the last 50 years have driven increases in emerging pathogens, and the introduction of generalist pathogens threaten both human and wildlife populations [2]. Generalist pathogens are capable of infecting multiple host species, which has led to devastation of communities [3,4], species extinctions [5,6] and cascading effects on ecosystems [7,8]. Changes in communities and ecosystems are influenced by variability in population impacts of multi-host pathogens, and some species may even decline to extinction, whereas others suffer little mortality [4,9–12]. Understanding the mechanisms that drive variation in species impacts can help to reduce mortality, prevent species extinctions and thus minimize ecosystem effects [13,14].
The impact of a disease on a population is the product of the fraction of the population infected multiplied by the fraction of infected individuals that die or fail to reproduce from disease [9,15]. Disease management can target either or both of these components [16]. For humans, public health approaches frequently focus on preventative measures that reduce transmission through behavioural modification or vaccines, whereas medical interventions usually reduce disease severity in infected individuals through drug treatment. Strategies that reduce transmission are preferred if they are more cost-effective than reducing symptoms after exposure. However, in some cases, reducing disease severity by reducing pathogen load can also substantially reduce transmission, particularly for chronic diseases. For example, the discovery that treatment with antiviral drugs greatly reduces infectiousness of HIV patients has revolutionized control of this disease [17].
Long-term control of diseases in wildlife by reducing transmission or disease severity carry additional logistical difficulties in delivering drugs to large enough numbers of free-ranging animals, and challenges in modifying hosts behaviour to reduce transmission. In addition, the relatively short lifespan of many species makes it necessary to have high-frequency repeated interventions that are too costly for all but a few species with a small number of individuals (e.g. vaccination of black-footed ferrets for canine distemper, vaccination of all California condors for West Nile virus [18]). Further, for multi-host pathogens, variation in disease severity is frequently attributed to innate host-specific factors (e.g. immune function), which are not yet easily manipulated for disease management purposes.
However, environmental conditions form the third part of the ‘disease triangle’, and wildlife disease control may be possible through manipulations that target key aspects of host–pathogen interactions. For example, altering environmental conditions can reduce growth and survival of the pathogen outside the host, and may also increase host defenses [19]. However, identifying environmental factors that can be efficiently targeted requires understanding interactions between hosts, the pathogen and the environment [14]. A detailed understanding of environmental influences on disease may open up a suite of management options that do not require the perpetual actions and funding associated with treatments and vaccination.
Several multi-host fungal pathogens are particularly emblematic of the interplay between host, pathogen and the environment [20–22]. Many fungal pathogens survive outside the host for long periods, or they infect hosts with variable body temperatures and are, therefore, strongly affected by environmental conditions [19,20]. For example, for chytridomycosis, a fungal disease of amphibians, the highest mortality occurs in cool, high-elevation areas [23]. While few fungal pathogens threaten endothermic immunocompetent species, ectothermic or heterothermic species (such as hibernating mammals, that substantially change core temperatures with seasons) may be more vulnerable to fungal disease. Management of fungal disease has recently been highlighted as a substantial challenge for human, agricultural and wildlife health [20].
White-nose syndrome (WNS), caused by the fungal pathogen Pseudogymnoascus destructans [24,25], is a recently emerged fungal disease that has caused widespread mortality in many communities of hibernating bats and is predicted to drive several species extinct [12,26]. WNS was first detected in Schoharie County, New York in 2006, and has since spread across eastern North America (figure 1). The first detection of P. destructans in North America occurred in a commercial tourist cave, and may have been facilitated by human movement [27–29]. Pseudogymnoascus destructans is endemic to Eurasia [30–32], where disease severity and population impacts appear to be much lower [33], and several species of Chinese bats have much lower loads than North American species [34]. By the end of the winter of 2015–2016, four bat species distributions within the USA were almost entirely encompassed by the spread of WNS (figure 1). In addition, in March 2016, WNS was detected in Washington state, approximately 1700 km from the nearest known infected site. This spreading event substantially expanded the distribution of the disease (figure 1), and doubled the number of bat species at risk.
Figure 1.

The distribution of white-nose syndrome (hatched) as of March 2016, and distribution maps for six hibernating bat species (colours) in the USA and Canada. Inset: Counts of hibernating bats at sites from 1979 to 2011, with per cent declines in the first year of WNS detection indicated in the upper left of the graph.
Mortality from WNS differs substantially among species, despite them co-occurring at the same sites. Some species declined more than 90% in the first year following WNS detection, whereas population growth rates in other species only decreased 8% [12,35]. Why species suffer such disparate impacts from WNS is a key question that may unlock clues about how to better manage this widespread disease.
Here, we examine how differences in exposure (defined as detection of P. destructans on bat skin), fungal loads (the abundance of P. destructans on bat skin) and environmental factors determine disease impacts in the six species of bats most impacted by WNS. Previous work has shown that in areas where the disease has been present for multiple years, bats first become infected when they return to hibernacula in the autumn, and both transmission and fungal growth on bats occurs primarily during winter once bats lower their body temperature and begin to hibernate [36]. The relatively high infection prevalence (greater than 50%) observed in many populations of all six species [36] suggests that variation among species in mortality after infection may be especially important in determining population impacts. Although the exact mechanism by which infection with P. destructans leads to death is unknown, tissue damage from fungal invasion is thought to set off a cascade of physiological disruptions [37,38], which eventually lead to death approximately 70–120 days after infection [24]. Increases in the extent of tissue invasion with fungal loads are likely to increase pathology and lead to an accelerating probability of death, as has been observed for another fungal pathogen that infects the skin, chytridiomycosis [22]. Pseudogymnoascus destructans growth increases with temperature across the range of hibernation temperatures commonly used by bats (approx. 1–12° C) [39–41]. Thus, we hypothesize that species that roost at warmer temperatures will have higher fungal loads and suffer higher mortality and impact from WNS. To test these predictions and hypotheses, we compared patterns of infection prevalence and intensity with differences in species impacts, and then examined links between microclimate temperatures used by bats and fungal loads. Finally, we examined patterns of changes in fungal loads over time to determine whether bats reach a threshold level of fungal infection above which mortality may increase sharply.
2. Material and methods
(a). Field sampling and analysis
We sampled bats at 21 hibernacula in New York, Vermont, Massachusetts, Virginia and Illinois. For five species, we sampled bats twice per hibernation season (November/December and March/early April) in sites where P. destructans had been detected at least 1 year previously. For Northern long-eared myotis (Myotis septentrionalis), we included late hibernation load data for two sites in the first year of WNS detection because exclusion of the invasion year data would result in small sample sizes for this species due to near extirpation in the first year of WNS. We previously used these infection data to examine seasonal changes in prevalence and fungal loads within species [36] (data available from [42]). Here, we examine links between infection patterns and differences in mortality among species [12]. One to six bat species were present in each hibernaculum, including the little brown myotis (Myotis lucifugus), Northern long-eared myotis, Eastern small-footed myotis (Myotis leibii), Indiana myotis (Myotis sodalis), tri-colored bat (Perimyotis subflavus) and the big brown bat (Eptesicus fuscus) (electronic supplementary material, table S1). At 67% of sites, three of six species co-occurred together, and individuals of different species frequently roosted within 1 m of each other.
We used epidermal swab sampling to determine prevalence and fungal loads of P. destructans [36]. Swabs were stored in RNAlater® for preservation until extraction. We tested samples for P. destructans DNA using real-time polymerase chain reaction (PCR) [43] and quantified fungal loads based on the cycle threshold (Ct) value to estimate a fungal load on each bat, with a cut-off of 40 cycles. Quantification of serial dilutions of the DNA from 10 ng to 1000 fg resulted in Ct scores ranging from 17.33 to 30.74 and a quantification relationship of Ct = −3.348 × log10 (P. destructans (ng)) + 22.049, r2 = 0.986. We use the term ‘infection’ to refer to the presence and quantity of P. destructans DNA on bat skin, detected using quantitative PCR on epidermal swab samples [20–22,44]. Previous work suggests there is a strong correlation between the abundance of P. destructans on bat skin from a swab and tissue invasion as detected by histology [45].
We recorded roost temperature of approximately half of sampled bats (812) using an infrared laser thermometer (Fluke 62 MAX + infrared thermometer) at time of sampling. Measurements were taken of the rock surface directly adjacent to the roosting bat, while standing within 2 m of the surface. We calibrated on-site roost temperatures with approximately 100 measurements from individual Onset HOBO loggers (model: u23-001; up to 4 per site, twice per year) that recorded a temperature measurement from a single location. Temperature measurements using the infrared laser thermometer were unbiased across a range of temperatures from 1°C to 15°C and within 0.75°C of the HOBO logger temperature.
(b). Statistical analyses
To estimate prevalence and fungal loads for each species, we used generalized linear mixed models (glmm) with site as a random effect and species interacting with date of sampling as fixed effects (function glmer in package lme4 [46] in R v. 3.02 [47]). We calculated a predicted prevalence and log10 load for each species on 1 December and 1 March from the glmm model described above to standardize early and late hibernation time points because prevalence and loads increase over winter and bats were sampled at different times [36].
We quantified WNS impact using the change in median population growth rate, Δλ, pre-WNS and after the first year of WNS detection, based on previous analyses of 121 colonies of six species of hibernating bats common in the northeastern USA collected over a 30-year period [12]. This dataset provides a large set of sites where count data have been rigorously collected pre- and post-WNS arrival for all six species, enabling us to estimate the change in population growth rate due to disease. These declines are consistent with estimates from other datasets [26,48] including estimates of declines based on summer activity [49,50]. To make comparisons among datasets, we estimated species prevalence and loads, and accounted for site differences by including site as a random effect. We examined the effect of P. destructans prevalence and loads on WNS impacts using phylogenetic regression [51] in MATLAB (v. R2013). Species that are closely related often suffer very dissimilar impacts (i.e. little brown and Eastern small-footed bats) [26]. Nonetheless, we accounted for phylogeny in our analyses because the absence of a phylogenetic signal for trees with less than 20 species can be difficult to assess [51]. The approach performs generalized least-squares regression using a variance–covariance matrix expected under an Ornstein–Uhlenbeck model of evolution based on the phylogenetic relationships among species [51]. We used a pruned phylogenetic tree of the six species based on the cytochome b mitochondrial gene [26] (electronic supplementary material, table S2).
We estimated the average roosting temperature for each of the six species using a model of site as a random effect interacting with species (the best fitting model), and averaging the mean predicted temperatures from the regression across all sites. To examine correlations between fungal loads and roosting temperature, we calculated average loads for each species using only data for the individuals for which roosting temperature data were also collected. We then used phylogenetic regression as described above to examine the effect of species roosting temperature on predicted log10 transformed P. destructans loads.
It is worth noting that in both analyses—correlations of WNS impacts and infection prevalence and fungal loads, and roosting temperature and fungal loads—measurement error due to instruments or techniques and the variation among individuals in estimating species' means decreases the power to detect significant relationships, but generally does not lead to an increased probability of a type I statistical error (failing to reject the null hypothesis). As a result, the relationships described below are likely to be even stronger than those reported here. In addition, we performed additional statistical analyses to address this variation, included weighted regression (using the inverse of the standard error of the estimates) and major axis regression to account for the uncertainty in the estimates of the predictor variables.
Finally, we examined how increases in loads differed among sites and species over winter to determine if fungal loads might reach an asymptote. We estimated the increase in load over winter in individual colonies of each species by fitting a linear model of site interacting with species to the change in P. destructans loads. We then compared the change in loads over time for each colony with the early winter loads for that colony. We also examined changes in skewness of load distributions between early and late winter loads for each species.
3. Results
We sampled 1314 bats of six species in 21 hibernation sites across New York, Virginia, Massachusetts, Vermont and Illinois (electronic supplementary material, table S1). In early winter, infection prevalence varied from 20% to 90% among species and this was significantly correlated with impacts, measured as the difference in population growth rate before and in the first year after detection of WNS (figure 2a) [12]. Fungal loads on bats at the beginning of hibernation varied by almost 2 orders of magnitude among species and were even more strongly correlated with impacts (figure 2b). By late hibernation, however, prevalence of P. destructans had increased to more than 80% for five of six species and was no longer significantly correlated with WNS impacts (figure 2c). By contrast, late hibernation loads of P. destructans now varied over 3 orders of magnitude among species and were very strongly correlated with WNS impacts (figure 2d), and neither early nor late prevalence were significant in a model with late hibernation fungal loads (both p > 0.45).
Figure 2.

Impact of white-nose syndrome, measured as the change in population growth rates (λ) following the detection of WNS (based on data and analyses in [12]) and infection prevalence (a,c) and intensity (b,d) of P. destructans for six bat species. Error bars show ±s.e. of the predicted mean. Lines show significant relationships, and the dashed line in (a) indicates that this relationship was significant only in a univariate regression, but not significant in a model with early or late fungal loads. Equations in the figure report results from phylogenetic regression in the format slope ± s.e. of the slope plus the intercept. Late hibernation prevalence was not a significant predictor of WNS impacts (intercept: −0.22, slope: 0.92 ± 0.5, p = 0.14, R2 = 0.45).
Species' fungal loads at the end of hibernation increased significantly with average roosting temperatures (figure 3) and early hibernation prevalence, and there was a marginally significant relationship between hibernation roosting temperature and species impacts (0.07 ± 0.04x + 0.24, p = 0.051). Models incorporating both early hibernation prevalence and temperature had slightly higher support than models with either predictor alone (ΔAICC = 0.41). The species with the highest fungal loads, the Northern long-eared bat, roosted at temperatures on average, 6°C warmer than the Eastern small-footed bat (M. leibii), which had loads that were 100-fold lower (figure 3). The relationship between roosting temperature and fungal load was even stronger using weighted regression using the inverse of roosting temperature standard error estimates as weights (0.26±0.09x − 4.14, p = 0.02), and the results were essentially identical using major axis regression (0.26±0.1x − 4.22; p = 0.045).
Figure 3.

Estimated P. destructans loads in late hibernation and hibernation roosting temperature for six bat species. Species' average load and roosting temperature were restricted to individual bats in which both roost temperatures and load were collected (n = 419). Statistics in the figure report results from phylogenetic regression in the format slope ± s.e. of the slope plus the intercept.
Average fungal loads within colonies of bats increased during winter, but two lines of evidence suggest that loads on individual bats asymptote, or bats die as they approached loads of approximately 10–1 ng. First, the distributions of logged loads shifted from being mostly unskewed (skewness closer to 0) or positive for most species in early hibernation to being more negatively skewed during late hibernation, especially for the three highly impacted species (figure 4; see electronic supplementary material for simulations of how differences in fungal growth on individuals influence fungal load skewness). Loads on Northern long-eared bats at the beginning of winter were already high (approaching the highest recorded fungal loads), and were almost significantly negatively skewed (bootstrapped confidence intervals, p = 0.11). Late winter loads on this species were even more negatively skewed, and few individuals had loads below 10−4 ng. Second, the increase in fungal loads for 19 colonies of five species was negatively correlated with mean fungal loads in early hibernation (figure 5). Average loads in colonies that were already high in early hibernation showed little increase over winter, whereas colonies with low average loads increased 1 log or 10-fold each month during hibernation. The best fitting model suggested that the saturation in fungal growth with increasing early hibernation loads was essentially identical for little brown and tri-colored bats (electronic supplementary material, table S3), but increases in fungal loads were lower for Indiana bats.
Figure 4.
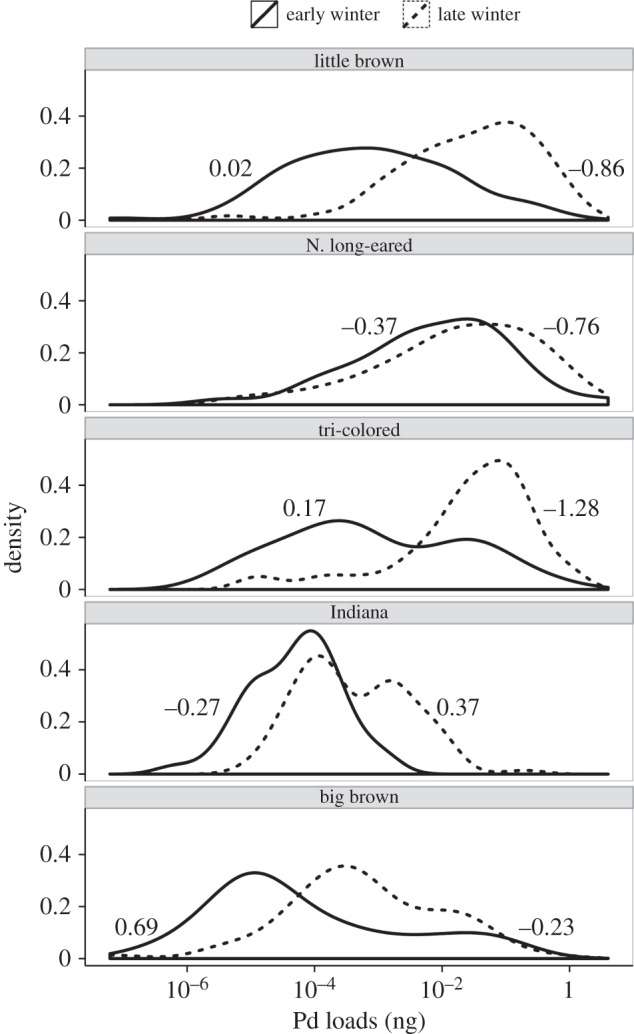
Distributions and skewness of fungal loads on bats in early (solid line) and late hibernation (dashed line). Early and late hibernation skewness differed significantly for little browns (p = 0.03), tri-colored (p < 0.0001) and big brown bats (p = 0.004). Skewness differences were compared by calculating skewness of simulated load distributions from 9999 draws from the grouped winter load data by species, and then comparing the bootstrapped skew differences with our observed skew differences to assess significance.
Figure 5.

Change in P. destructans fungal loads over time plotted against fungal loads at the beginning of hibernation for five species of bats in 19 colonies (where early hibernation prevalence was greater than 50%). Statistical results are shown in electronic supplementary material, table S3.
4. Discussion
The emergence of WNS in North America has altered bat communities on a continental scale, by decimating some species while others have been far less affected [12,26]. Our results suggest that differences in impacts reflect variation in fungal growth resulting in differential pathogen load among species. Differences in timing of infection may initially result in significant differences in exposure and, therefore, infection prevalence at the beginning of hibernation. However, infection prevalence eventually saturates near 100% in most species, which eliminates variation in transmission as a driver of differential population impacts. Instead, different hibernation microclimate preferences among species appear to result in differential fungal growth on bats over the winter, resulting in wide variation in fungal loads that was tightly correlated with differential population impacts of WNS among bat species.
The relationships between WNS impacts, fungal loads and roosting temperatures offer some insight into the potential mechanisms linking environmental variation and disease impacts. Warmer roosting temperatures, up to 13°C, increase fungal growth rates, with a 2°C–7°C increase in temperature increasing fungal colony size almost fivefold [39]. This provides a potential explanation for the higher fungal loads on bat species roosting at warmer temperatures and, in turn, the higher WNS impacts on these species. Although we cannot infer causation from these relationships, the data are inconsistent with temperature-dependent variation in immune function, which would be predicted to increase with temperature [19]. This would lead to lower fungal loads and impacts at warmer temperatures [52–54]. The causal effect of temperature in increasing WNS impacts among species is also supported by experimental infections of a single species, M. lucifugus, at two different temperatures [55]. Furthermore, the wide variation in species impacts within the same genera lends further support that behavioural traits (such as roosting temperature) that exhibit greater individual plasticity [51] may be more important than non-labile traits that are likely to be shared between closely related species. Finally, the energetic expenditure of bats is thought to play an integral role in WNS mortality, because bats suffering from WNS arouse far more frequently than uninfected bats [24,56]. This behaviour can prematurely deplete stored fat, and bats dying of WNS are frequently emaciated [25]. However, energetic models indicate that bats roosting at warmer temperatures (across the range of hibernation temperatures) probably expend less energy during winter because most of the energy expenditure used by bats during hibernation is used during euthermic arousals (70–90%), and thermoregulation during these arousal periods is less energetically costly at warmer temperatures than at colder temperatures [57]. Nonetheless, relationships between body temperature and torpor patterns are complex and further research is needed to address how changes in roost temperature affect torpor patterns of WNS-affected bats [56].
The increase in WNS impact with roosting temperature suggests that although preferences for higher roosting temperatures may have been beneficial for some species prior to the arrival of WNS, this became maladaptive after P. destructans was introduced. It is worth noting that there was considerable variation in roosting temperature within each species (figure 3) and intense mortality from WNS may be selecting for individuals that roost in cooler locations. If preference for roosting temperature is a heritable trait, WNS mortality could drive the evolution of a change in behaviour, as well as select for genes associated with surviving colder winter roosting temperatures. This is one possible explanation for the stabilization of little brown bat populations at some sites in the northeastern United States [12]. Future studies are needed to examine whether temperature and absolute humidity preferences of roosting bats decrease as WNS mortality occurs.
Our results suggest that there is a maximum fungal load above which loads do not increase further, and this maximum value is similar for the two species (little brown and tri-colored bats) that we had sufficient data to compare. One explanation for this pattern is that as loads on individual bats increase, disease-associated pathology and mortality increase sharply as loads approach 10−1 ng. A similar phenomenon has been suggested for Batrachochytrium dendrobatidis, a fungal pathogen of amphibians [22]. However, it is also possible that the smaller increase in fungal loads in colonies of bats that begin winter at higher loads is simply due to density-dependent fungal growth on the surface of bats' skin. Quantifying fungal loads over time in an experimental infection study or on marked bats in the field could determine which mechanism is resulting in the threshold we observed in fungal loads.
Understanding the drivers of variation in WNS impacts could be used to more effectively guide management interventions. Our results suggest that a reduction in pathogen loads could reduce disease impacts. Previous work has shown that cooler and drier [12] hibernacula appear to serve as refugia from disease impacts for some populations within two species, possibly because they promote lower fungal loads and thereby increase chances of survival. Although we focused on temperature here, humidity may also contribute to differences in declines among species. If so, manipulating hibernacula entrances to create cooler and drier sites or restricting access to reduce bats' use of the warmer and wetter portions of hibernacula has potential as a single-intervention, long-term solution for management of WNS. By contrast, chemical or biological treatments that reduce loads could be effective in the short term, but if not self-perpetuating, would require continual reapplication making long-term management on a broad-scale challenging [18]. In the past, state managers in New York, Pennsylvania and Wisconsin have manipulated mine entrances to stabilize and alter temperatures (G. Turner 2016, unpublished data; A. Hicks 2007, unpublished data; J. Redell 2015, unpublished data). While there are risks associated with these interventions (i.e. temperatures must be within the physiological limits of bats and unsuitable habit could deter bats), data suggest that a very high percentage of bats roosting at sites with warmer temperatures will perish from WNS [12,26,35,48] and small-scale manipulations could be attempted to test for larger scale feasibility of this as a management tool. While environmental manipulation may not be feasible for all sites it may prove useful for a subset of key sites. Some hibernacula contain large populations (tens of thousands of bats) of multiple species, such that making just a few sites cooler and drier could save diverse populations and help maintain genetic diversity. While WNS has extirpated multiple species from many sites, it has yet to drive any species completely to extinction, and thus management actions could still conserve the multiple species threatened by WNS.
Differences in disease impacts among species are often assumed to result from inherent differences in disease susceptibility (e.g. cellular pathways or receptors for pathogen binding and replication) [58,59], inherent differences in severity given infection [60–62] or pathogen exposure [12,63–65]. As a result, reductions in transmission often form the basis for the management of wildlife disease [16,18]. Our finding that species impacts were strongly correlated with environmentally driven variation in pathogen growth suggests that efforts to reduce disease impacts by altering environmental factors deserve additional consideration. Disease management via reduction of pathogen loads is a cornerstone of human medical treatments [66], and could be more widely used to manage wildlife diseases like WNS. Our results suggest that environmental manipulation to reduce pathogen growth is an underappreciated tool that could help to prevent disease-caused extinctions in wildlife.
Supplementary Material
Acknowledgements
We thank R. Reynolds, W. Orndorf, K. Powers (VA), S. Darling (VT), C. Herzog, R. von Linden, K. O'Conner (NY), D. Kirk, J. Kath (IL) and T. Cheng for assistance in data collection.
Ethics
We followed field hygiene protocols in accordance with United States Fish and Wildlife Service WNS Decontamination Guidelines, and individual state recommendations. All research was conducted under protocol #11-022 approved by the IACUC of Boston University and protocol #Frickw1106 approved by the IACUC of the University of California, Santa Cruz.
Data accessibility
Data are available from [42]. For additional data requests contact K. Langwig.
Authors' contributions
K.E.L., T.H.K., W.F.F., J.T.F., A.M.K.: conceived and designed the study; K.E.L., J.R.H., A.M.K.: performed the study; K.E.L., J.R.H., K.L.P., K.P.D., A.M.K.: analysed the data; T.H.K., J.T.F.: contributed reagents/materials/analysis tools and K.E.L., A.M.K.: wrote the paper.
Competing interests
We declare we have no competing interests.
Funding
This work was supported by the National Science Foundation (DEB-1336290, DEB-1115895 and DGE-0741448), Bat Conservation International, the US Fish and Wildlife Service and the National Geographic Society. The funders had no role in study design, data collection and analysis, decision to publish or preparation of the manuscript.
References
- 1.Daszak P, Cunningham AA, Hyatt AD. 2000. Emerging infectious diseases of wildlife—threats to biodiversity and human health. Science 287, 443–449. ( 10.1126/science.287.5452.443) [DOI] [PubMed] [Google Scholar]
- 2.Woolhouse MEJ, Gowtage-Sequeria S. 2005. Host range and emerging and reemerging pathogens. Emerg. Infect. Dis. 11, 1842–1847. ( 10.3201/eid1112.050997) [DOI] [PMC free article] [PubMed] [Google Scholar]
- 3.Frick WF, Pollock JF, Hicks AC, Langwig KE, Reynolds DS, Turner GG, Butchkoski CM, Kunz TH. 2010. An emerging disease causes regional population collapse of a common North American bat species. Science 329, 679–682. ( 10.1126/science.1188594) [DOI] [PubMed] [Google Scholar]
- 4.Lips KR et al. . 2006. Emerging infectious disease and the loss of biodiversity in a Neotropical amphibian community. Proc. Natl Acad. Sci. USA 103, 3165–3170. ( 10.1073/pnas.0506889103) [DOI] [PMC free article] [PubMed] [Google Scholar]
- 5.Skerratt LF, Berger L, Speare R, Cashins S, McDonald KR, Phillott AD, Hines HB, Kenyon N. 2007. Spread of chytridiomycosis has caused the rapid global decline and extinction of frogs. EcoHealth 4, 125–134. ( 10.1007/s10393-007-0093-5) [DOI] [Google Scholar]
- 6.Smith KF, Sax DF, Lafferty KD. 2006. Evidence for the role of infectious disease in species extinction and endangerment. Conserv. Biol. 20, 1349–1357. ( 10.1111/j.1523-1739.2006.00524.x) [DOI] [PubMed] [Google Scholar]
- 7.Holdo RM, Sinclair ARE, Dobson AP, Metzger KL, Bolker BM, Ritchie ME, Holt RD. 2009. A disease-mediated trophic cascade in the serengeti and its implications for ecosystem C. PLoS Biol. 7, e1000210 ( 10.1371/journal.pbio.1000210) [DOI] [PMC free article] [PubMed] [Google Scholar]
- 8.Whitlaw HA, Lankester MW. 1994. A retrospective evaluation of the effects of parelaphostrongylosis on moose populations. Can. J. Zool. 72, 1–7. ( 10.1139/z94-001) [DOI] [Google Scholar]
- 9.LaDeau SL, Kilpatrick AM, Marra PP. 2007. West Nile virus emergence and large-scale declines of North American bird populations. Nature 447, 710–713. ( 10.1038/nature05829) [DOI] [PubMed] [Google Scholar]
- 10.van Riper C, van Riper SG, Goff ML, Laird M. 1986. The epizootiology and ecological significance of malaria in Hawaiian land birds. Ecol. Monogr. 56, 327–344. ( 10.2307/1942550) [DOI] [Google Scholar]
- 11.Harvell CD, et al. 1999. Emerging marine diseases—climate links and anthropogenic factors. Science 285, 1505–1510. ( 10.1126/science.285.5433.1505) [DOI] [PubMed] [Google Scholar]
- 12.Langwig KE, Frick WF, Bried JT, Hicks AC, Kunz TH, Marm Kilpatrick A. 2012. Sociality, density-dependence and microclimates determine the persistence of populations suffering from a novel fungal disease, white-nose syndrome. Ecol. Lett. 15, 1050–1057. ( 10.1111/j.1461-0248.2012.01829.x) [DOI] [PubMed] [Google Scholar]
- 13.McCallum H. 2012. Disease and the dynamics of extinction. Phil. Trans. R. Soc. B 367, 2828–2839. ( 10.1098/rstb.2012.0224) [DOI] [PMC free article] [PubMed] [Google Scholar]
- 14.Paull SH, Song S, McClure KM, Sackett LC, Kilpatrick AM, Johnson PTJ. 2012. From superspreaders to disease hotspots: linking transmission across hosts and space. Front. Ecol. Environ. 10, 75–82. ( 10.1890/110111) [DOI] [PMC free article] [PubMed] [Google Scholar]
- 15.Kilpatrick AM, Peters RJ, Dupuis Ii AP, Jones MJ, Daszak P, Marra PP, Kramer LD. 2013. Predicted and observed mortality from vector-borne disease in wildlife: West Nile virus and small songbirds. Biol. Conserv. 165, 79–85. ( 10.1016/j.biocon.2013.05.015) [DOI] [PMC free article] [PubMed] [Google Scholar]
- 16.Wobeser G. 2002. Disease management strategies for wildlife. Rev. Sci. Tech. Off. Int. Epizoot. 21, 159–178. ( 10.20506/rst.21.1.1326) [DOI] [PubMed] [Google Scholar]
- 17.Cohen MS, et al. 2011. Prevention of HIV-1 infection with early antiretroviral therapy. N. Engl. J. Med. 365, 493–505. ( 10.1056/NEJMoa1105243) [DOI] [PMC free article] [PubMed] [Google Scholar]
- 18.Langwig KE, et al. 2015. Context dependent conservation responses to wildlife disease. Front. Ecol. Environ. 13, 195–202. ( 10.1890/140241) [DOI] [Google Scholar]
- 19.Raffel TR, Romansic JM, Halstead NT, McMahon TA, Venesky MD, Rohr JR. 2012. Disease and thermal acclimation in a more variable and unpredictable climate. Nat. Clim. Change 3, 146–151. ( 10.1038/nclimate1659) [DOI] [Google Scholar]
- 20.Fisher MC, Henk DA, Briggs CJ, Brownstein JS, Madoff LC, McCraw SL, Gurr SJ. 2012. Emerging fungal threats to animal, plant and ecosystem health. Nature 484, 186–194. ( 10.1038/nature10947) [DOI] [PMC free article] [PubMed] [Google Scholar]
- 21.Briggs CJ, Knapp RA, Vredenburg VT. 2010. Enzootic and epizootic dynamics of the chytrid fungal pathogen of amphibians. Proc. Natl Acad. Sci. USA 107, 9695–9700. ( 10.1073/pnas.0912886107) [DOI] [PMC free article] [PubMed] [Google Scholar]
- 22.Vredenburg VT, Knapp RA, Tunstall TS, Briggs CJ. 2010. Dynamics of an emerging disease drive large-scale amphibian population extinctions. Proc. Natl Acad. Sci. USA 107, 9689–9694. ( 10.1073/pnas.0914111107) [DOI] [PMC free article] [PubMed] [Google Scholar]
- 23.Kilpatrick AM, Briggs CJ, Daszak P. 2010. The ecology and impact of chytridiomycosis: an emerging disease of amphibians. Trends Ecol. Evol. 25, 109–118. ( 10.1016/j.tree.2009.07.011) [DOI] [PubMed] [Google Scholar]
- 24.Warnecke L, Turner JM, Bollinger TK, Lorch JM, Misra V, Cryan PM, Wibbelt G, Blehert DS, Willis CKR. 2012. Inoculation of bats with European Geomyces destructans supports the novel pathogen hypothesis for the origin of white-nose syndrome. Proc. Natl Acad. Sci. USA 109, 6999–7003. ( 10.1073/pnas.1200374109) [DOI] [PMC free article] [PubMed] [Google Scholar]
- 25.Lorch JM, et al. 2011. Experimental infection of bats with Geomyces destructans causes white-nose syndrome. Nature 480, 376–378. ( 10.1038/nature10590) [DOI] [PubMed] [Google Scholar]
- 26.Frick WF, et al. 2015. Disease alters macroecological patterns of North American bats. Glob. Ecol.Biogeogr. 24, 741–749. ( 10.1111/geb.12290) [DOI] [Google Scholar]
- 27.Blehert DS, et al. 2009. Bat white-nose syndrome: an emerging fungal pathogen? Science 323, 227–227. ( 10.1126/science.1163874) [DOI] [PubMed] [Google Scholar]
- 28.Leopardi S, Blake D, Puechmaille SJ. 2015. White-nose syndrome fungus introduced from Europe to North America. Curr. Biol. 25, R217–R219. ( 10.1016/j.cub.2015.01.047) [DOI] [PubMed] [Google Scholar]
- 29.Puechmaille SJ, Frick WF, Kunz TH, Racey PA, Voigt CC, Wibbelt G, Teeling EC. 2011. White-nose syndrome: is this emerging disease a threat to European bats? Trends Ecol. Evol. 26, 570–576. ( 10.1016/j.tree.2011.06.013) [DOI] [PubMed] [Google Scholar]
- 30.Hoyt JR, et al. 2015. Widespread bat white-nose syndrome fungus, northeastern China. Emerg. Infect. Dis. 22, 140–142. ( 10.3201/eid2201.151314) [DOI] [PMC free article] [PubMed] [Google Scholar]
- 31.Puechmaille SJ, Verdeyroux P, Fuller H, Gouilh MA, Bekaert M, Teeling EC. 2010. White-nose syndrome fungus (Geomyces destructans) in bat, France. Emerg. Infect. Dis. 16, 290–293. ( 10.3201/eid1602.091391) [DOI] [PMC free article] [PubMed] [Google Scholar]
- 32.Zukal J, et al. 2014. White-nose syndrome fungus: a generalist pathogen of hibernating bats. PLoS ONE 9, e97224 ( 10.1371/journal.pone.0097224) [DOI] [PMC free article] [PubMed] [Google Scholar]
- 33.Puechmaille SJ, et al. 2011. Pan-European distribution of white-nose syndrome fungus (Geomyces destructans) not associated with mass mortality. PLoS ONE 6, e19167 ( 10.1371/journal.pone.0019167) [DOI] [PMC free article] [PubMed] [Google Scholar]
- 34.Hoyt JR, et al. 2016. Host persistence or extinction from emerging infectious disease: insights from white-nose syndrome in endemic and invading regions. Proc. R. Soc. B 283, 20152861 ( 10.1098/rspb.2015.2861) [DOI] [PMC free article] [PubMed] [Google Scholar]
- 35.Langwig KE, Hoyt JR, Parise KL, Kath J, Kirk D, Frick WF, Foster JT, Kilpatrick AM. 2015. Invasion dynamics of white-nose syndrome white-nose syndrome fungus, midwestern United States, 2012–2014. Emerg. Infect. Dis.. 21, 1023–1026. ( 10.3201/eid2106.150123) [DOI] [PMC free article] [PubMed] [Google Scholar]
- 36.Langwig KE, et al. 2015. Host and pathogen ecology drive the seasonal dynamics of a fungal disease, white-nose syndrome. Proc. R. Soc. B 282, 20142335 ( 10.1098/rspb.2014.2335) [DOI] [PMC free article] [PubMed] [Google Scholar]
- 37.Warnecke L, Turner JM, Bollinger TK, Misra V, Cryan PM, Blehert DS, Wibbelt G, Willis CKR. 2013. Pathophysiology of white-nose syndrome in bats: a mechanistic model linking wing damage to mortality. Biol. Lett. 9, 20130177 ( 10.1098/rsbl.2013.0177) [DOI] [PMC free article] [PubMed] [Google Scholar]
- 38.Verant ML, Carol MU, Speakman JR, Cryan PM, Lorch JM, Blehert DS. 2014. White-nose syndrome initiates a cascade of physiologic disturbances in the hibernating bat host. BMC Physiol. 14, 227 ( 10.1186/s12899-014-0010-4) [DOI] [PMC free article] [PubMed] [Google Scholar]
- 39.Verant ML, Boyles JG, Waldrep W, Wibbelt G, Blehert DS. 2012. Temperature-dependent growth of Geomyces destructans, the fungus that causes bat white-nose syndrome. PLoS ONE 7, e46280 ( 10.1371/journal.pone.0046280) [DOI] [PMC free article] [PubMed] [Google Scholar]
- 40.Brack V. 2007. Temperatures and locations used by hibernating bats, including Myotis sodalis (Indiana bat), in a limestone mine: implications for conservation and management. Environ. Manage. 40, 739–746. ( 10.1007/s00267-006-0274-y) [DOI] [PubMed] [Google Scholar]
- 41.Webb PI, Speakman JR, Racey PA. 1996. How hot is a hibernaculum? A review of the temperatures at which bats hibernate. Can. J. Zool. Rev. Can. Zool. 74, 761–765. ( 10.1139/z96-087) [DOI] [Google Scholar]
- 42.Langwig KE, Frick WF, Hoyt JR, Parise KL, Drees KP, Kunz TH, Foster JT, Kilpatrick AM. 2016. Drivers of variation in species impacts for a multi-host fungal disease of bats. Dryad Digital Repository ( 10.1098/rstb.2015.0456) [DOI] [PMC free article] [PubMed] [Google Scholar]
- 43.Muller LK, Lorch JM, Lindner DL, O'Connor M, Gargas A, Blehert DS. 2013. Bat white-nose syndrome: a real-time TaqMan polymerase chain reaction test targeting the intergenic spacer region of Geomyces destructans. Mycologia 105, 253–259. ( 10.3852/12-242) [DOI] [PubMed] [Google Scholar]
- 44.Haas CN, Rose JB, Gerba CP. 1999. Quantitative microbial risk assessment, p. 449, 1st edn New York, NY: John Wiley & Sons, Inc. [Google Scholar]
- 45.McGuire LP, et al. 2016. White-nose syndrome disease severity and a comparison of diagnostic methods. EcoHealth 13, 60–71. ( 10.1007/s10393-016-1107-y) [DOI] [PubMed] [Google Scholar]
- 46.Bates D, Maechler M, Bolker B. 2011. lme4: Linear mixed-effects models using S4 classes. R package version 0.999375-42. See http://CRAN.R-project.org/package=lme4 . [Google Scholar]
- 47.R Development Core Team. 2012. R: a language and environment for statistical computing. Vienna, Austria: R Foundation for Statistical Computing. [Google Scholar]
- 48.Turner GG, Reeder DM, Coleman JTH. 2011. A five-year assessment of mortality and geographic spread of white-nose syndrome in North American bats and look to the future. Bat Res. News 52, 13–27. [Google Scholar]
- 49.Dzal Y, McGuire LP, Veselka N, Fenton MB. 2011. Going, going, gone: the impact of white-nose syndrome on the summer activity of the little brown bat (Myotis lucifugus). Biol. Lett. 7, 392–394. ( 10.1098/rsbl.2010.0859) [DOI] [PMC free article] [PubMed] [Google Scholar]
- 50.Brooks RT. 2011. Declines in summer bat activity in central New England 4 years following the initial detection of white-nose syndrome. Biodivers. Conserv. 20, 2537–2541. ( 10.1007/s10531-011-9996-0) [DOI] [Google Scholar]
- 51.Blomberg SP, Garland T, Ives AR. 2003. Testing for phylogenetic signal in comparative data: behavioral traits are more labile. Evolution 57, 717–745. ( 10.1111/j.0014-3820.2003.tb00285.x) [DOI] [PubMed] [Google Scholar]
- 52.Moore MS, Reichard JD, Murtha TD, Nabhan ML, Pian RE, Ferreira JS, Kunz TH. 2013. Hibernating little brown myotis (Myotis lucifugus) show variable immunological responses to white-nose syndrome. PLoS ONE 8, e58976 ( 10.1371/journal.pone.0058976) [DOI] [PMC free article] [PubMed] [Google Scholar]
- 53.Bouma HR, Carey HV, Kroese GM. 2010. Hibernation: the immune system at rest? J. Leukoc. Biol. 88, 619–624. ( 10.1189/jlb.0310174) [DOI] [PubMed] [Google Scholar]
- 54.Bouma HR, et al. 2011. Low body temperature governs the decline of circulating lymphocytes during hibernation through sphingosine-1-phosphate. Proc. Natl Acad. Sci. USA 108, 2052–2057. ( 10.1073/pnas.1008823108) [DOI] [PMC free article] [PubMed] [Google Scholar]
- 55.Johnson SA, Brack V, Rolley RE. 1998. Overwinter weight loss of Indiana bats (Myotis sodalis) from hibernacula subject to human visitation. Am. Midland Nat. 139, 255–261. ( 10.1674/0003-0031(1998)139%5B0255:owloib%5D2.0.co;2) [DOI] [Google Scholar]
- 56.Reeder DM, et al. 2012. Frequent arousal from hibernation linked to severity of infection and mortality in bats with white-nose syndrome. PLoS ONE 7, e38920 ( 10.1371/journal.pone.0038920) [DOI] [PMC free article] [PubMed] [Google Scholar]
- 57.Jonasson KA, Willis CKR. 2012. Hibernation energetics of free-ranging little brown bats. J. Exp. Biol. 215, 2141–2149. ( 10.1242/jeb.066514) [DOI] [PubMed] [Google Scholar]
- 58.Pepin KM, Lass S, Pulliam JR, Read AF, Lloyd-Smith JO. 2010. Identifying genetic markers of adaptation for surveillance of viral host jumps. Nat. Rev. Microbiol. 8, 802–813. ( 10.1038/nrmicro2440) [DOI] [PMC free article] [PubMed] [Google Scholar]
- 59.Pulliam JR, Dushoff J. 2009. Ability to replicate in the cytoplasm predicts zoonotic transmission of livestock viruses. J. Infect. Dis. 199, 565–568. ( 10.1086/596510) [DOI] [PMC free article] [PubMed] [Google Scholar]
- 60.Fraser C, Hollingsworth TD, Chapman R, de Wolf F, Hanage WP. 2007. Variation in HIV-1 set-point viral load: epidemiological analysis and an evolutionary hypothesis. Proc. Natl Acad. Sci. USA 104, 17 441–17 446. ( 10.1073/pnas.0708559104) [DOI] [PMC free article] [PubMed] [Google Scholar]
- 61.Komar N, Langevin S, Hinten S, Nemeth NM, Edwards E, Hettler DL, Davis BS, Bowen RA, Bunning ML. 2003. Experimental infection of North American birds with the New York 1999 strain of West Nile virus. Emerg. Infect. Dis. 9, 311–322. ( 10.3201/eid0903.020628) [DOI] [PMC free article] [PubMed] [Google Scholar]
- 62.Yorinks N, Atkinson CT. 2000. Effects of malaria on activity budgets of experimentally infected juvenile Apapane (Himatione sanguinea). Auk 117, 731–738. ( 10.1642/0004-8038(2000)117%5B0731:EOMOAB%5D2.0.CO;2) [DOI] [Google Scholar]
- 63.Altizer S, Hochachka WM, Dhondt AA. 2004. Seasonal dynamics of mycoplasmal conjunctivitis in eastern North American house finches. J. Anim. Ecol. 73, 309–322. ( 10.1111/j.0021-8790.2004.00807.x) [DOI] [Google Scholar]
- 64.Johnson PTJ, Hartson RB, Larson DJ, Sutherland DR. 2008. Diversity and disease: community structure drives parasite transmission and host fitness. Ecol. Lett. 11, 1017–1026. ( 10.1111/j.1461-0248.2008.01212.x) [DOI] [PubMed] [Google Scholar]
- 65.Wendland LD, et al. 2010. Social behavior drives the dynamics of respiratory disease in threatened tortoises. Ecology 91, 1257–1262. ( 10.1890/09-1414.1) [DOI] [PubMed] [Google Scholar]
- 66.Read AF, Day T, Huijben S. 2011. The evolution of drug resistance and the curious orthodoxy of aggressive chemotherapy. Proc. Natl Acad. Sci. USA 108, 10 871–10 877. ( 10.1073/pnas.1100299108) [DOI] [PMC free article] [PubMed] [Google Scholar]
Associated Data
This section collects any data citations, data availability statements, or supplementary materials included in this article.
Supplementary Materials
Data Availability Statement
Data are available from [42]. For additional data requests contact K. Langwig.