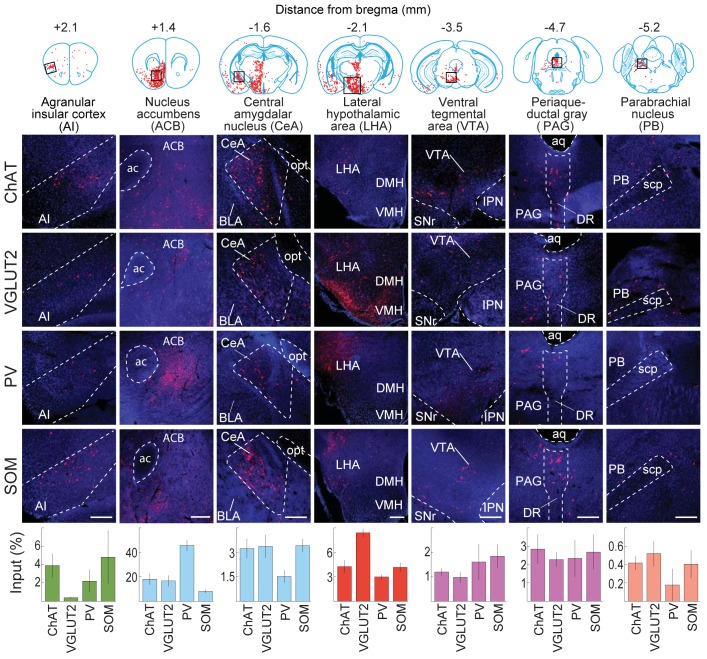
Figure 2. Inputs to each BF cell type from selected brain regions.
Examples of RV-labeled input neurons to each of the four BF cell types in seven selected brain structures (black box in each coronal diagram). Scale bar, 200 µm. In each coronal diagram, RV-labeled neurons detected in all four brain samples are indicated by red dots. Bottom panel, mean percentage of input neurons in each brain structure for the four BF cell types. Error bar, ± s.e.m. Bar color indicates which of the 12 regions the given brain structure belongs to as depicted in Figure 3. ac, anterior commissure; aq, cerebral aqueduct; BLA, basolateral amygdalar nucleus; DMH, dorsomedial nucleus of the hypothalamus; DR, dorsal nucleus raphe; IPN, interpeduncular nucleus; opt, optic tract; scp, superior cerebellar peduncles; SNr, substantia nigra reticularis; VMH, ventromedial hypothalamic nucleus.
DOI: http://dx.doi.org/10.7554/eLife.13214.007
© 2008 Elsevier. All Rights Reserved
Upper panel, brain outlines adapted from Figures 13, 19, 44, 48, 60, 70, 74, from The Mouse Brain in Stereotaxic Coordinates, 3rd edition, Franklin, K.B.J. and Paxinos, G.

