

Abstract
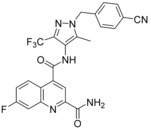
Despite the long‐known fact that the facilitative glucose transporter GLUT1 is one of the key players safeguarding the increase in glucose consumption of many tumor entities even under conditions of normal oxygen supply (known as the Warburg effect), only few endeavors have been undertaken to find a GLUT1‐selective small‐molecule inhibitor. Because other transporters of the GLUT1 family are involved in crucial processes, these transporters should not be addressed by such an inhibitor. A high‐throughput screen against a library of ∼3 million compounds was performed to find a small molecule with this challenging potency and selectivity profile. The N‐(1H‐pyrazol‐4‐yl)quinoline‐4‐carboxamides were identified as an excellent starting point for further compound optimization. After extensive structure–activity relationship explorations, single‐digit nanomolar inhibitors with a selectivity factor of >100 against GLUT2, GLUT3, and GLUT4 were obtained. The most promising compound, BAY‐876 [N 4‐[1‐(4‐cyanobenzyl)‐5‐methyl‐3‐(trifluoromethyl)‐1H‐pyrazol‐4‐yl]‐7‐fluoroquinoline‐2,4‐dicarboxamide], showed good metabolic stability in vitro and high oral bioavailability in vivo.
Keywords: medicinal chemistry, quinoline carboxamides, GLUT1 inhibitors, structure–activity relationships, Warburg effect
Introduction
In 1930 Otto Warburg observed a phenomenon in which cancer cells often metabolically switch from oxidative phosphorylation to glycolysis, even under normal oxygen supply.1 At first sight, the contradictory behavior of cancer cells with regard to their increased demand on energy supply is of crucial importance to feed the essential biochemical anabolic pathways with higher amounts of central intermediates.1f To fulfill the increased demand on these central intermediates, the glycolytic rate is often up‐regulated in tumor entities.2 As the cellular uptake of glucose is the first rate‐limiting step in the glycolytic process it is not surprising that the transporters responsible for this uptake were found to be up‐regulated in both solid and hematological malignancies.3
Of the two different classes of hexose transporters (SGLT: sodium‐dependent glucose transporter, GLUT: facilitative glucose transporter4) the GLUTs were found to be overexpressed in many tumors.5 In particular, GLUT1 overexpression has been reported in many types of human cancers, including those of brain,6 breast,7 colon,8 kidney,9 lung,10 ovary,11 and prostate,12 and is correlated with advanced cancer stages and poor clinical outcomes. It was demonstrated that the activation of certain oncogenes like c‐myc,13 KRAS,10 BRAF,14 and p53,15 and transcription factors like hypoxia inducible factor‐1a,16 can induce the GLUT1 overexpression.17 Additionally, there is a widely clinically applied diagnostic modality PET imaging, which makes use of increased glucose uptake in some types of cancer with [18F]fluoro‐2‐deoxyglucose (FDG).18 All these factors demonstrate the importance of GLUT1 function for cancer cell viability suggesting that an inhibition of this transporter might be therapeutically beneficial in the treatment of tumors with high glucose turnover.
Whereas GLUT1 is nearly ubiquitously expressed in all normal tissues to maintain the basal glucose supply19 the expression of some members of the GLUT family is more specific. Those GLUTs can be involved in central processes like insulin secretion in pancreas (GLUT2),20 neuronal glucose uptake (GLUT3),21 and insulin‐regulated transport of glucose in muscle and fat cells (GLUT4).22 To enable a therapeutic window with a potential GLUT1 inhibitor selectivity within the GLUT family is decisive for any possible cancer treatment with this approach.
Several small‐molecule GLUT1 inhibitors have already been described in literature including resveratrol,23 naringenin,24 phloretin,25 WZB117,26 salicylketoximes,27 thiazolidinedione,28 STF‐31,29 pyrazolopyrimidines,30 and phenylalanine amides.31 With their thiazolidinediones Wang et al. demonstrated the inhibition of [3H]‐2‐deoxy‐d‐glucose uptake in LNCaP cells and the suppressive effects on the viability of LNCaP cells in MTT assays.28 Chan et al. used the principle of chemical synthetic lethality to demonstrate the sensitivity of VHL deficient renal cancer cells to glucose uptake inhibition by STF‐31.29 The compound WZB117 was able to inhibit the glucose uptake in A549 cancer cells and their cell proliferation in a dose‐dependent manner.26 All these results underline the feasibility of GLUT1 inhibition as cancer treatment.
Results and Discussion
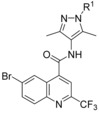
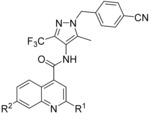
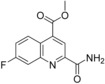
Therefore, an HTS screen was performed using a cell‐based assay with CellTiter‐Glo®32 readout for ATP production. In a pairwise chemical screen, DLD1 (for human GLUT1), DLD1Glut1−/− (Horizon discovery, for human GLUT3), CHO‐hGLUT2 and CHO‐hGLUT4 cell lines were co‐incubated with the potential GLUT1 inhibiting test compounds and with rotenone as inhibitor for the oxidative phosphorylation.33 With the rotenone co‐incubation the cells could only produce ATP via glycolysis and the amount of produced ATP could be linked to the amount of glucose taken up. Subsequent assays regarding cellular uptake and consumption of glucose in the presence of the test compounds confirmed their competitive GLUT1 inhibitory behavior. In total, ∼3 million compounds were tested in this HTS and 285 hits were identified inhibiting the GLUT1 transporter and showing a good selectivity against GLUT2. In addition, from these 285 hits two clusters and one singleton demonstrated very good selectivity against GLUT3. The comparison of the two clusters and the singleton revealed the N‐(1H‐pyrazol‐4‐yl)quinoline‐4‐carboxamide 1 (Figure 1) having most promising primary data. To have a more lead‐like starting point for structure‐activity relationship (SAR) optimization, we first envisioned to decrease lipophilicity and possible metabolic liabilities. Quickly, we found out that the 2‐furanyl moiety was not necessary for good potency and even a small methyl group in position 2 was acceptable (2). Complete omission of the quinoline methyl substituents in 2, however, deteriorated the GLUT1 potency (IC50: 0.96 μm, not shown). First in vitro pharmacokinetics (PK) data of 2 still revealed remaining metabolic liabilities in this compound. Our first interest was then to alter the methyl groups of the quinoline. The CF3 substituent in position 2 and exchanging the 6,8‐dimethyl pattern for a 6‐bromine significantly enhanced GLUT1 potency reaching the single‐digit nanomolar range (3). Furthermore, no detrimental effect regarding selectivity toward GLUT2 and GLUT3 could be observed and a selectivity factor of 35 toward GLUT4 was also a promising starting point to explore the SAR of this compound class in more detail.
Figure 1.
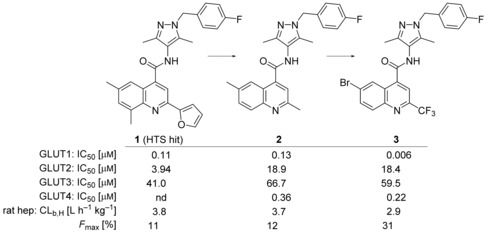
Initial SAR beyond HTS hit 1.
We decided to continue SAR investigation on the benzylic moiety attached to the pyrazole keeping the quinoline fragment constant (Table 1). Directly attaching the para‐fluorophenyl ring to the pyrazole led to a significant GLUT1 potency loss (4). The same was observed with an elongated spacer (6) so that a methylene link between the pyrazole and the para‐fluorophenyl ring was considered optimal. Ramification at the methylene position (5) also decreased the potency. Substitution of the para‐fluoro group at the phenyl was, however, feasible and later on the para‐cyano group revealed the most promising data (7). With this moiety in hand further substitutions were possible while maintaining single‐digit nanomolar potency. For instance, a pyridine nitrogen (8) or a fluorine in ortho (9) or meta position (10) of the cyano function could be introduced. Efforts to exchange the aromatic benzyl head at the pyrazole for fully saturated systems only gave less potent compounds, for example, 11.
Table 1.
SAR investigations of the benzylic moiety at the pyrazole group of compound 3.
| |||||
|---|---|---|---|---|---|
| Compd | R1 | IC50 [μm][a] | |||
| GLUT1[b] | GLUT2[c] | GLUT3[d] | GLUT4[e] | ||
| 4 |

|
0.47 | n.d.[f] | 20.5 | n.d. |
| 3 |

|
0.006 | 18.4 | 59.5 | 0.22 |
| 5 |

|
0.043 | 7.11 | 6.09 | 2.02 |
| 6 |

|
0.087 | 5.63 | 2.39 | 0.34 |
| 7 |

|
0.004 | 12.8 | 10.4 | n.d. |
| 8 |

|
0.002 | 36.1 | 2.74 | 2.02 |
| 9 |

|
0.003 | 26.4 | 1.72 | n.d. |
| 10 |

|
0.008 | n.d. | 2.86 | 0.87 |
| 11 |

|
0.059 | 8.50 | 15.6 | n.d. |
[a] Cell‐based assay with cells constitutively expressing luciferase; 1 μm roteneone and 300 μm glucose were co‐incubated with inhibitor 15 min before CellTiter‐Glo® readout. Results were normalized to the control cytochalasin B (IC50 GLUT1: 0.1 μm, GLUT2: 2.8 μm, GLUT3: 0.12 μm, GLUT4: 0.28 μm); assay variance: 9 %, IC50 calculation R 2>0.9. [b] DLD1 cells. [c] CHO‐hGLUT2 cells. [d] DLD1GLUT1−/− cells from Horizon discovery. [e] CHO‐hGLUT4 cells. [f] n.d.: not determined.
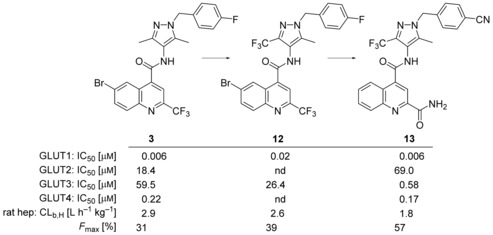
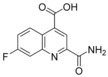
Compound 3 displayed relatively high clearance of about of liver blood flow in rats. Metabolite identification experiments revealed remaining metabolic soft spots at the pyrazole and quinoline parts (see Table 6 below). Therefore, we aimed at modifying at least one of the pyrazole methyl groups and abandoning the 6‐bromine. Replacing a methyl with a CF3 group at pyrazole position 3 led to compound 12 already showing slightly better clearance with 2.6 L h−1 kg−1 in rat hepatocytes (see Figure 2 below). To be able to omit the 6‐bromo substituent completely in the final inhibitor avoiding in vivo debromination or hepatotoxicity, we had to change the substituent in position 2 of the quinoline again, because within the bromine‐free 2‐CF3‐quinoline series we were not able to find single‐digit nanomolar inhibitors of GLUT1. For instance, the debromo compound of 3 had only an IC50 of 0.093 μm in the GLUT1 assay. Exchanging the 2‐CF3 group in 12 for a primary carboxamide already resulted in a single‐digit nanomolar inhibitor with a des‐bromo substance. Upon additional exchange of the para‐fluoro group for a cyano moiety an IC50 of 0.006 μm was attained for 13. In addition, the metabolic stability in rat hepatocytes was also increased by lowering the clearance to 1.81 L h−1 kg−1, however, the excellent selectivity of 12 against GLUT3 significantly dropped for compound 13, making this a parameter that had to be regained in later SAR explorations.
Table 6.
In vitro pharmacokinetics and Caco‐2 permeability data.
| Compd | LM[a] stability CL b,LM [b] [L h−1 kg−1] (F max [%][c]) | Hep[d] stability CL b,Hep [L h−1 kg−1] (F max [%]) | Caco‐2 permeability P app A→B [nm s−1][e] (ER)[f] |
|---|---|---|---|
| 2 | 1.2 (11) (h)[g] 4.0 (25) (m)[h] | 3.7 (12) (r)[i] | 200 (0.84) |
| 3 | 4.5 (16) (m) | 2.9 (31) (r) | 72 (0.35) |
| 7 | 3.4 (38) (m) | n.d.[j] | n.d. |
| 12 | 2.2 (59) (m) | 2.6 (39) (r) | 3.5 (0.73) |
| 13 | 0.21 (84) (h) 0.06 (97) (d)[k] 1.4 (74) (m) | 0.11 (95) (d) 1.8 (57) (r) | 74 (3.7) |
| 17 | 2.3 (57) (m) | 2.0 (53) (r) | n.d. |
| 19 (BAY‐876) | 0.32 (76) (h) 0.76 (70) (mo)[l] stable (100) (d) 1.1 (74) (r) 0.33 (94) (m) | 0.37 (72) (h) 1.4 (46) (mo) 0.20 (90) (d) 0.46 (89) (r) | 78 (2.5) |
| 33 | 2.1 (61) (m) | 1.9 (54) (r) | n.d. |
| 39 | 0.45 (66) (h) 0.67 (88) (m) | 1.0 (75) (r) | n.d. |
| 43 | 0.87 (34) (h) | n.d. | n.d. |
| 52 | 0.99 (25) (h) | 2.9 (31) (r) | n.d. |
| 54 | 0.19 (86) (h) 0.40 (84) (mo) 0.001 (100) (d) 0.37 (91) (r) 0.36 (93) (m) | 0.03 (98) (h) 0.32 (88) (mo) 0.001 (100)(d) 0.04 (99) (r) | 16 (16) |
| 57 | 0.53 (60) (h) | 1.2 (72) (r) | n.d. |
| 58 | 0.22 (83) (h) | 0.89 (79) (r) | n.d. |
[a] Liver microsomes (LM). [b] Blood clearance (CL b): CLb= ; QH: liver blood flow (human: 1.32 L h−1 kg−1, monkey: 2.6 L h−1 kg−1, dog: 2.1 L h−1 kg−1, rat: 4.2 L h−1 kg−1, mouse: 5.4 L h−1 kg−1), CL int: intrinsic clearance, (well‐stirred model of hepatic clearance). [c] Maximal bioavailability after per oral administration (F max): F max= 1− . [d] Hepatocytes (Hep). [e] The apparent permeability (P app) values are derived from the transport of the compounds (2 μm) over a 2 h period from the apical (A) to the basolateral (B) compartment and vice versa. [f] The letters ER refer to the efflux ratios and are calculated by dividing the P app B→A values by the P app A→B values. [g] Human (h). [h] Mouse (m). [i] Rat (r). [j] n.d.: not determined. [k] Dog (d). [l] Monkey (mo).
Figure 2.
Advancing SAR.
Next, the 2‐carboxamide was kept constant and we tested the influence of a second quinoline substituent. At position 5, fluorine (14) is superior to a methyl group (15) with regard to both, potency and selectivity profile. Comparing fluorine (16) and methyl (17) at position 6 revealed an advantage for the methyl compound with regard to the selectivity profile. A methoxy substituent at the same position (18) pushed GLUT1 potency below the nanomolar range, however, at the expense of also hitting the counter‐targets GLUT3 and GLUT4 (Table 2).
Table 2.
SAR explorations at quinolone ring A.
| ||||||
|---|---|---|---|---|---|---|
| Compd | A | R1 | IC50 [μm] | |||
| GLUT1 | GLUT2 | GLUT3 | GLUT4 | |||
| 13 14 15 |

|
−H −F −Me | 0.006 0.003 0.018 | 69.0 n.d. n.d. | 0.58 0.23 0.086 | 0.17 0.094 0.017 |
| 16 17 18 |

|
−F −Me −OMe | 0.005 0.007 0.0003 | n.d. 36.1 n.d. | 0.29 3.82 0.11 | 0.044 0.12 0.013 |
| 19 (BAY‐876) 20 21 |

|
−F −Me −OMe | 0.002 0.008 0.024 | 10.8 n.d. 9.28 | 1.67 1.67 2.48 | 0.29 0.095 1.67 |
| 22 23 |

|
−F −Cl | 0.005 0.003 | 2.15 n.d. | 0.61 0.76 | 0.19 0.029 |
| 24 |

|
– | 0.014 | 51.2 | 1.19 | 0.38 |
| 25 |

|
– | 0.010 | 51.2 | 23.8 | 0.061 |
| 26 |

|
– | 0.045 | 51.2 | 0.30 | 1.00 |
| 27 |

|
– | 0.0005 | 22.2 | 0.47 | 0.016 |
| 28 |

|
– | 0.002 | n.d. | 6.07 | 0.18 |
| 29 |

|
– | 0.035 | n.d. | 49.9 | 0.28 |
| 30 |

|
– | 0.20 | n.d. | 5.65 | 2.48 |
In position 7, a fluorine substituent (19) is clearly better tolerated regarding GLUT3 (selectivity factor 770) and GLUT4 selectivity (selectivity factor 134) than in positions 5 and 6. Introduction of a methyl (20) decreased GLUT4 selectivity and a methoxy group (21) resulted in a less potent compound. A halogen at position 8 (22, 23) was also feasible, but the selectivity profile was not better than in position 5 and 6.
Introduction of an additional ring nitrogen at position 6 (24), 7 (25), or 8 (26) gave double‐digit nanomolar inhibitors with less selectivity toward GLUT4 (selectivity factors: 6–28) as compared to compound 19. Highly potent compounds could be obtained upon double fluorine substitution (27, 28), but again the GLUT4 selectivity of these inhibitors was impaired. An exchange of the phenyl part of the quinoline for a five‐membered heterocycle (29) or complete omission of the phenyl moiety (30) resulted in less potent compounds.
Next to the evaluation of a second substitution at the quinoline ring the position of the carboxamide was also thoroughly explored. On the basis of the original HTS hit 1 different aromatic (hetero)cycles at position 2 were tested (Table 3). An unsubstituted 2‐thiazole (31) could be introduced leading to a 4 nm inhibitor.
Table 3.
SAR explorations of the substituent at position 2 of quinolone.
| ||||||
|---|---|---|---|---|---|---|
| Compd | R1 | R2 | IC50 [μm] | |||
| GLUT1 | GLUT2 | GLUT3 | GLUT4 | |||
| 31 |

|
−H | 0.004 | n.d. | 2.03 | 0.09 |
| 32 |

|
−H | 0.76 | n.d. | 1.55 | 0.91 |
| 33 |

|
−H | 0.007 | 51.2 | 28.4 | 0.54 |
| 34 |

|
−H | 0.074 | n.d. | 1.99 | 2.05 |
| 35 |

|
−H | 0.92 | n.d. | 7.96 | 2.77 |
| 19 (BAY‐876) |

|
−F | 0.002 | 10.8 | 1.67 | 0.29 |
| 36 |

|
−F | 0.082 | 51.2 | 28.4 | 3.12 |
| 37 |

|
−F | 0.34 | n.d. | 10.1 | 1.78 |
| 38 |

|
−F | 0.34 | n.d. | 28.4 | 1.13 |
With the additional bulk of two methyl groups (32) the potency was diminished significantly whereas a 1,2,4‐triazole 33 with only one methyl substituent showed an overall good potency and selectivity profile. Adding pyridyl (34) or substituted phenyl (35) to position 2 only gave less potent compounds. Explorations at the carboxamide nitrogen (36–38) showed that increase of steric demand in that position deteriorated potency significantly so that overall the unsubstituted carboxamide at position 2 turned out to be the best option.
Next, we investigated the substitution pattern at the central pyrazole (Table 4). The corresponding dimethyl analogue 39 of 19 showed an improvement in GLUT1 potency and an excellent GLUT4 selectivity (selectivity factor 721). However, the second pyrazole methyl group exposed an additional metabolic soft spot as depicted in Figure 2. Regarding mono‐methylation, a methyl group at pyrazole position 5 (41) was leading more efficiently to good GLUT3 selectivity than the corresponding regioisomer 40. Leaving the CF3 group as sole substituent at position 3 (42) yielded a double‐digit nanomolar inhibitor, whereas the combination of an isopropyl group at position 3 with a methyl group at position 5 (43) resulted in a very potent inhibitor with an excellent selectivity profile. The drawback of such an excellent selectivity is the well‐known metabolic liability of the isopropyl group.
Table 4.
SAR explorations at pyrazole ring B.
| |||||
|---|---|---|---|---|---|
| Compd | B | IC50 [μm] | |||
| GLUT1 | GLUT2 | GLUT3 | GLUT4 | ||
| 39 |

|
0.0009 | n.d. | 0.55 | 0.68 |
| 40 |

|
0.003 | n.d. | 0.035 | 0.40 |
| 41 |

|
0.007 | n.d. | 0.46 | 0.42 |
| 42 |

|
0.019 | n.d. | 7.96 | 0.41 |
| 19 (BAY‐876) |

|
0.002 | 10.8 | 1.67 | 0.29 |
| 43 |

|
0.007 | 51.2 | 22.2 | 5.05 |
Keeping the CF3 group at position 3 and the methyl group at position 5 of the pyrazole constant, we investigated variations of the benzyl residue in more detail (Table 5). A cyano group in ortho position (44) led to a 3 nm inhibitor with excellent selectivity toward GLUT3 but modest toward GLUT4. With a methyl group (45) a GLUT4 selectivity increase could be observed, whereas with an ortho OCF3 (46) the GLUT1 potency eroded. A functional group in meta position resulted in double digit‐nanomolar inhibitors for the cyano (47) and methyl (48) while meta OCF3 (49) only led to a 540 nm inhibitor.
Table 5.
SAR investigations of the benzylic moiety at the pyrazole of compound 19.
| ||||||
|---|---|---|---|---|---|---|
| Compd | R1 | R2 | IC50 [μm] | |||
| GLUT1 | GLUT2 | GLUT3 | GLUT4 | |||
| 44 45 46 |

|
−CN −Me −OCF3 | 0.003 0.007 0.39 | n.d. n.d. n.d. | 5.95 10.3 4.98 | 0.088 1.14 2.04 |
| 47 48 49 |

|
−CN −Me −OCF3 | 0.025 0.011 0.54 | n.d. n.d. n.d. | 3.15 14.7 35.5 | 0.95 0.61 1.07 |
| 19 (BAY‐876) 50 51 52 53 |

|
−CN −CF3 −OCF3 −Et −tBu | 0.002 0.009 0.005 0.0009 1.18 | 10.8 n.d. n.d. 20.5 >10 | 1.67 6.55 3.27 2.85 5.47 | 0.29 0.91 0.37 0.37 0.50 |
| 54 |

|
– | 0.004 | 20.2 | 2.92 | 0.62 |
| 55 |

|
– | 0.032 | n.d. | 9.89 | 2.24 |
| 56 |

|
– | 0.078 | n.d. | 5.02 | 2.24 |
| 57 |

|
– | 0.005 | n.d. | 1.11 | 0.016 |
| 58 |

|
– | 0.026 | n.d. | 2.89 | 1.33 |
| 59 |

|
– | 0.012 | n.d. | 2.88 | 0.16 |
| 60 |

|
– | 0.067 | n.d. | 4.32 | 0.89 |
| 61 |

|
– | 0.089 | 25.6 | 9.09 | 1.35 |
Compared with ortho and meta substituents the para position turned out to be a bit more flexible regarding steric demand. Not only a cyano (19) and CF3 group (50) were well tolerated but also the OCF3 (51) and ethyl (52) groups resulted in excellent GLUT1 inhibitors with very good selectivity profiles. Only the sterically more demanding tert‐butyl group (53) revealed to be sterically too demanding to give a potent compound.
Keeping the para‐cyano group constant, the additional introduction of a pyridine nitrogen was viable. Here, especially the position ortho to the core connection (54) yielded a very potent and highly selective compound. This substitution pattern revealed to be more attractive than the corresponding regioisomeric pyridine (55), only resulting in a double‐digit nanomolar inhibitor. In the series of aromatic systems with two ring nitrogen atoms the pyrazine pattern (57) gave a more potent derivative than the pyridazine (56) and pyrimidine (58). However, the fee for this increase in potency was a nearly complete deprivation of selectivity of compound 57 toward GLUT4. Also five‐membered ring heteroaromatic systems were investigated at the benzylic position. Keeping the cyano group, thiophene 59, thiazole 60 and isoxazole 61 led to double‐digit nanomolar inhibitors, partially with low selectivity toward GLUT4. As could be expected from bioisosteric approaches employed in literature,34 the thiophene represented the best mimic for the benzene ring regarding GLUT1 potency. Comparing the potency and selectivity profiles of all 61 compounds and taking metabolic stability into account, we identified the compounds 19 (BAY‐876) and 54 as very promising candidates for further characterizations.
The straightforward synthesis of such selective GLUT1 inhibitors is exemplified for BAY‐876 (19) in Scheme 1. Starting from the commercially available 5‐methyl‐4‐nitro‐3‐(trifluoromethyl)‐1H‐pyrazole 62 benzylation with Cs2CO3 35 yielded regioselectively nitropyrazole 64 that was subsequently reduced using zinc under acidic conditions.36 With this aminopyrazole in hand the quinoline part of BAY‐876 (19) was derived from inexpensive 6‐fluoroisatine 66 that was converted into the 7‐fluoroquinoline‐2,4‐dicarboxylic acid 67 with pyruvic acid under basic Pfitzinger conditions.37 After transforming 67 into the diester 68, reaction with ammonia in methanol gave the 2‐quinolinecarboxamide 69 regioselectively.38 A final amide bond formation between 65 and 69 using HATU39 as coupling reagent yielded the desired compound BAY‐876 (19).
Scheme 1.
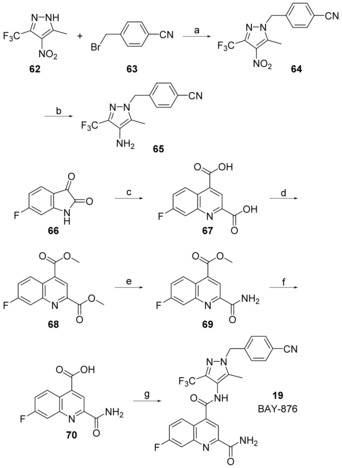
Reagents and conditions: a) Cs2CO3, MeCN, 60 °C, 92 %; b) Zn, HOAc, EtOH, H2O, 60 °C, 92 %; c) 33 % KOH(aq), pyruvic acid, 40 °C, 85 %; d) 1. SOCl2, reflux, 2. MeOH, reflux, 46 %; e) 7 n NH3 in MeOH, 50 °C, 81 %; f) NaOH(aq), MeOH, RT, 84 %; g) 65, HATU, Et2NiPr, DMSO, RT, 46 %.
Regarding further characterization we first examined BAY‐876 (19) and other candidates in metabolic stability assays using liver microsomes and hepatocytes of different species. Furthermore, the most promising compounds were checked in the Caco‐2 permeability assay. Starting from compounds 2, 3, and 12 with moderate to high metabolic clearance in rat hepatocytes (Figures 1 and 2), installation of a 2‐carboxamide at the quinoline and a CF3 at the pyrazole, like in compound 13, already resulted in compounds with low metabolic clearance in human, dog and mouse liver microsomes as well as dog hepatocytes. However, rat hepatocyte clearance was higher giving only average maximal bioavailability according to the well‐stirred model. Comparing the Caco‐2 data of 2, 3, 12, and 13, the permeability from low (3.5 nm s−1) to high (200 nm s−1) (apical to basolateral) showed the high variation possible within the N‐(1H‐pyrazol‐4‐yl)quinoline compound class.
BAY‐876 (19) showed low metabolic in vitro clearance in all tested species except for monkey hepatocytes displaying moderate clearance (Table 6). The Caco‐2 permeability was high and the efflux ratio not considered critical. Compared with the moderate stability of triazole 33 in mouse liver microsomes and in rat hepatocytes, dimethylpyrazole 39 revealed good bioavailability of 88 % in mouse liver microsomes and 75 % in rat hepatocytes. Its stability in human microsomes was slightly lower with 66 %. In comparison with 39 the corresponding isopropylpyrazole 43 showed double the clearance in human microsomes. This metabolic liability was not only observed for 43 but also for other isopropylpyrazole compounds within the project. Due to this finding no isopropylpyrazole was selected for advanced in vivo studies.
Despite the sub‐nanomolar potency of compound 52 its metabolic liability discouraged further in vivo characterization. Cyanopyridine 54 did not only show promising potency and selectivity in the GLUT assays but also very good metabolic stability in liver microsomes and hepatocytes across all tested species. However, the strong efflux ratio in the Caco‐2 assay appeared to be a major drawback of this compound relative to BAY‐876 (19). The pyrazine 57 and the pyrimidine 58 showed a two‐ to threefold higher clearance in rat hepatocytes than BAY‐876 (19).
Taking into account GLUT inhibition, metabolic stability, and Caco‐2 performance we selected BAY‐876 (19) as candidate for in vivo pharmacokinetic studies that were conducted in two different species (Table 7). In good agreement with the in vitro hepatocyte data BAY‐876 displayed low clearance also in vivo in rat and in dog. The volume of distribution in steady state (V ss) was moderate in both species. Terminal half life was intermediate in rat and long in dog due to the very low clearance. As would be expected from the low blood clearance oral bioavailability was high at the given doses and formulations. Overall, the preliminary data of BAY‐876 demonstrate a favorable in vivo PK profile.
Table 7.
In vivo pharmacokinetics data of BAY‐876 (19).
| Parameter | male Wistar rat[a] | female Beagle dog[b] |
|---|---|---|
| Dose i.v. [mg kg−1] | 0.3 | 0.1 |
| CL plasma [L h−1 kg−1] | 0.23 | 0.033 |
| CL blood [L h−1 kg−1] | 0.33 | 0.059 |
| V ss [L kg−1] | 0.79 | 1.0 |
| terminal t 1/2 [h] | 2.5 | 22 |
| Dose p.o. [mg kg−1] | 0.6 | 0.2 |
| C max,norm,p.o. [kg l −1][c] | 0.33 | 0.93 |
| F [%] | 85 | 79 |
[a] Formulation: PEG400/water/EtOH (60/30/10). [b] Formulation: PEG400/water/EtOH (50/40/10). [c] C max,norm,p.o.=C max,p.o. [mg l −1]/dose p.o. [mg kg−1].
Conclusions
Starting from moderately potent and metabolically labile HTS hit 1 carrying a furanyl moiety at position 2 of the quinoline and four methyl groups in total, we quickly improved both, potency and metabolic stability by substituting the furan and taking out the two quinoline methyl groups. Using the quinoline core of compound 3 we found an unsubstituted methylene to be the optimal spacer between the phenyl and pyrazole ring. After successful replacement of one of the pyrazole methyl groups for the metabolically more stable CF3 group (12), further SAR exploration of the quinoline core demonstrated an unsubstituted amide at position 2 and a fluorine at position 7 (19, BAY‐876) to be very beneficial regarding GLUT1 potency and selectivity against the other GLUTs.
At the pyrazole core a double substitution at positions 3 and 5 was found to be crucial for the excellent potency/selectivity profile especially against GLUT3. Regarding a substituent at the benzyl ring, the para position yielded more promising compounds than the ortho or meta position. With a para‐cyano group and an additional ring nitrogen, compound 54 demonstrated also an interesting GLUT profile.
The synthesis of the N‐(1H‐pyrazol‐4‐yl)quinoline‐4‐carboxamides was straightforward as exemplified for BAY‐876 (19). In vitro PK data showed that both BAY‐876 (19) and 54 were very stable in liver microsomes and hepatocytes, although 54 had a strong efflux ratio of around 16. Preliminary in vivo PK studies of BAY‐876 (19) demonstrated that a good oral bioavailability and long terminal half‐life is attainable making it an excellent chemical probe to further evaluate the hypothesis of cancer treatment with a very selective GLUT1 inhibitor.
Experimental Section
Chemistry
Materials and methods: All commercially available starting materials and solvents were used without further purification. Microwave irradiation was applied with a Biotage Initiator 60. Flash column chromatography was performed on prepacked flash chromatography columns PF‐15‐SIHP purchased from Interchim or KP‐Sil purchased from Biotage using a Biotage Isolera separation system. 1H and 13C NMR spectra were recorded at room temperature on Bruker Avance spectrometers operating at 300 or 400 MHz for 1H NMR and at 75 or 100 MHz for 13C NMR acquisitions. NMR signal multiplicities are reported as they appear, without considering higher‐order effects. Chemical shifts (δ) are given in ppm with the residual solvent signal used as reference (CDCl3: s, 7.26 ppm (1H) and t, 77.1 ppm (13C); [D6]DMSO: quint, 2.50 ppm (1H) and quint, 40.1 ppm (13C)). LC–MS spectra were recorded on a Waters Acquity UPLC–MS SQD 3001 spectrometer, using an Acquity UPLC BEH C18 1.7 50×2.1 mm column, with acetonitrile and water+0.1 % formic acid as eluents at 60 °C, a flow of 0.8 mL min−1, an injection volume of 2 μL, with DAD scan at 210–400 nm, ELSD. All tested compounds were at least 95 % pure as determined by 1H NMR spectroscopy.
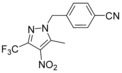 4‐{[5‐Methyl‐4‐nitro‐3‐(trifluoromethyl)‐1H‐pyrazol‐1‐yl]methyl}benzonitrile (64): 3‐Methyl‐4‐nitro‐5‐(trifluoromethyl)‐1H‐pyrazole (4.30 g, 22.0 mmol, 62, CAS‐RN 27116–80–9) was dissolved in acetonitrile (65 mL), and 4‐(bromomethyl)benzonitrile (5.19 g, 26.5 mmol, 63, CAS‐RN 17201‐43‐3) and cesium carbonate (8.62 g, 26.5 mmol) were added. The suspension was stirred at 60 °C for 2 h. Then, the reaction mixture was filtered, the filtrate was evaporated, and the crude product was purified by flash chromatography to obtain the desired compound 64 (6.30 g, 92 %): 1H NMR (300 MHz, [D6]DMSO): δ=2.63 (s, 3 H), 5.67 (s, 2 H), 7.41 (d, J=8.5 Hz, 2 H), 7.86 ppm (d, J=8.5 Hz, 2 H); LC–MS (ESI+): t
R=1.21 min, m/z 311.1 [M+H]+.
4‐{[5‐Methyl‐4‐nitro‐3‐(trifluoromethyl)‐1H‐pyrazol‐1‐yl]methyl}benzonitrile (64): 3‐Methyl‐4‐nitro‐5‐(trifluoromethyl)‐1H‐pyrazole (4.30 g, 22.0 mmol, 62, CAS‐RN 27116–80–9) was dissolved in acetonitrile (65 mL), and 4‐(bromomethyl)benzonitrile (5.19 g, 26.5 mmol, 63, CAS‐RN 17201‐43‐3) and cesium carbonate (8.62 g, 26.5 mmol) were added. The suspension was stirred at 60 °C for 2 h. Then, the reaction mixture was filtered, the filtrate was evaporated, and the crude product was purified by flash chromatography to obtain the desired compound 64 (6.30 g, 92 %): 1H NMR (300 MHz, [D6]DMSO): δ=2.63 (s, 3 H), 5.67 (s, 2 H), 7.41 (d, J=8.5 Hz, 2 H), 7.86 ppm (d, J=8.5 Hz, 2 H); LC–MS (ESI+): t
R=1.21 min, m/z 311.1 [M+H]+.
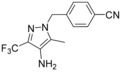 4‐{[4‐Amino‐5‐methyl‐3‐(trifluoromethyl)‐1H‐pyrazol‐1‐yl]methyl}benzonitrile (65): To a solution of 4‐{[5‐methyl‐4‐nitro‐3‐(trifluoromethyl)‐1H‐pyrazol‐1‐yl]methyl}benzonitrile (3.20 g, 10.3 mmol, 64) in ethanol (160 mL) was added water (80 mL), acetic acid (16 mL), and zinc dust (3.20 g, 49.0 mmol). This reaction mixture was stirred at 60 °C for 1.5 h. After cooling to 25 °C the suspension was filtered through Celite, washed with ethyl acetate, and the complete filtrate was evaporated. To the residue was added water (100 mL) and conc. aq. sodium carbonate (50 mL). This aqueous phase was extracted three times with ethyl acetate (150 mL). The combined organic layer was washed with brine, dried over sodium sulfate, filtered and evaporated to obtain a crude product that was purified by flash chromatography to obtain compound 65 (2.66 g, 92 %): 1H NMR (300 MHz, [D6]DMSO): δ=2.05 (s, 3 H), 4.06 (s, 2 H), 5.38 (s, 2 H), 7.22 (d, J=8.5 Hz, 2 H), 7.79–7.85 ppm (m, 2 H); LC–MS (ESI+): t
R=0.96 min, m/z 281.1 [M+H]+.
4‐{[4‐Amino‐5‐methyl‐3‐(trifluoromethyl)‐1H‐pyrazol‐1‐yl]methyl}benzonitrile (65): To a solution of 4‐{[5‐methyl‐4‐nitro‐3‐(trifluoromethyl)‐1H‐pyrazol‐1‐yl]methyl}benzonitrile (3.20 g, 10.3 mmol, 64) in ethanol (160 mL) was added water (80 mL), acetic acid (16 mL), and zinc dust (3.20 g, 49.0 mmol). This reaction mixture was stirred at 60 °C for 1.5 h. After cooling to 25 °C the suspension was filtered through Celite, washed with ethyl acetate, and the complete filtrate was evaporated. To the residue was added water (100 mL) and conc. aq. sodium carbonate (50 mL). This aqueous phase was extracted three times with ethyl acetate (150 mL). The combined organic layer was washed with brine, dried over sodium sulfate, filtered and evaporated to obtain a crude product that was purified by flash chromatography to obtain compound 65 (2.66 g, 92 %): 1H NMR (300 MHz, [D6]DMSO): δ=2.05 (s, 3 H), 4.06 (s, 2 H), 5.38 (s, 2 H), 7.22 (d, J=8.5 Hz, 2 H), 7.79–7.85 ppm (m, 2 H); LC–MS (ESI+): t
R=0.96 min, m/z 281.1 [M+H]+.
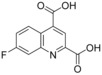 7‐Fluoroquinoline‐2,4‐dicarboxylic acid (67): To a mixture of 6‐fluoro‐1H‐indole‐2,3‐dione (5.0 g, 30.3 mmol, 66, CAS‐RN 324‐03‐8) in 33 % aq. potassium hydroxide solution (75 mL) was added pyruvic acid (4.67 g, 53.0 mmol) and this mixture was heated at 40 °C for 18 h. After cooling to room temperature 10 % aq. sulfuric acid was added until pH reached about 1. The precipitate was isolated by filtration and dried in vacuo to give the desired compound 67 (6.02 g, 85 %), which was used without further purification: 1H NMR (300 MHz, [D6]DMSO): δ=7.78 (ddd, J=9.4, 8.5, 2.8 Hz, 1 H), 7.99 (dd, J=10.0, 2.6 Hz, 1 H), 8.42 (s, 1 H), 8.89 ppm (dd, J=9.5, 6.3 Hz, 1 H); LC–MS (ESI+): t
R=0.56 min, m/z 236.1 [M+H]+.
7‐Fluoroquinoline‐2,4‐dicarboxylic acid (67): To a mixture of 6‐fluoro‐1H‐indole‐2,3‐dione (5.0 g, 30.3 mmol, 66, CAS‐RN 324‐03‐8) in 33 % aq. potassium hydroxide solution (75 mL) was added pyruvic acid (4.67 g, 53.0 mmol) and this mixture was heated at 40 °C for 18 h. After cooling to room temperature 10 % aq. sulfuric acid was added until pH reached about 1. The precipitate was isolated by filtration and dried in vacuo to give the desired compound 67 (6.02 g, 85 %), which was used without further purification: 1H NMR (300 MHz, [D6]DMSO): δ=7.78 (ddd, J=9.4, 8.5, 2.8 Hz, 1 H), 7.99 (dd, J=10.0, 2.6 Hz, 1 H), 8.42 (s, 1 H), 8.89 ppm (dd, J=9.5, 6.3 Hz, 1 H); LC–MS (ESI+): t
R=0.56 min, m/z 236.1 [M+H]+.
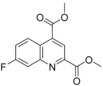 Dimethyl 7‐fluoroquinoline‐2,4‐dicarboxylate (68): A mixture of 7‐fluoroquinoline‐2,4‐dicarboxylic acid (6.0 g, 25.5 mmol, 67) and thionyl chloride (28 mL, 383 mmol) was heated at 80 °C for 2 days. After cooling to 25 °C the resulting suspension was evaporated to dryness in vacuo. This crude product was suspended in methanol (47 mL) and held at reflux for 3 h. After cooling to 25 °C the solid was isolated by filtration to give compound 68 (3.06 g, 46 %), which was used without further purification: 1H NMR (300 MHz, [D6]DMSO): δ=3.99 (s, 3 H), 4.01 (s, 3 H), 7.85 (ddd, J=9.2, 8.4, 2.6 Hz, 1 H), 8.07 (dd, J=9.8, 2.6 Hz, 1 H), 8.45 (s, 1 H), 8.80 ppm (dd, J=9.5, 6.1 Hz, 1 H); LC–MS (ESI+): t
R=1.07 min, m/z 264.0 [M+H]+.
Dimethyl 7‐fluoroquinoline‐2,4‐dicarboxylate (68): A mixture of 7‐fluoroquinoline‐2,4‐dicarboxylic acid (6.0 g, 25.5 mmol, 67) and thionyl chloride (28 mL, 383 mmol) was heated at 80 °C for 2 days. After cooling to 25 °C the resulting suspension was evaporated to dryness in vacuo. This crude product was suspended in methanol (47 mL) and held at reflux for 3 h. After cooling to 25 °C the solid was isolated by filtration to give compound 68 (3.06 g, 46 %), which was used without further purification: 1H NMR (300 MHz, [D6]DMSO): δ=3.99 (s, 3 H), 4.01 (s, 3 H), 7.85 (ddd, J=9.2, 8.4, 2.6 Hz, 1 H), 8.07 (dd, J=9.8, 2.6 Hz, 1 H), 8.45 (s, 1 H), 8.80 ppm (dd, J=9.5, 6.1 Hz, 1 H); LC–MS (ESI+): t
R=1.07 min, m/z 264.0 [M+H]+.
 Methyl 2‐carbamoyl‐7‐fluoroquinoline‐4‐carboxylate (69): To a solution of dimethyl 7‐fluoroquinoline‐2,4‐dicarboxylate (3.05 g, 11.6 mmol, 68) in methanol (42 mL) was added a 7 m solution of ammonia in methanol (41 mL, 290 mmol) and stirred for 3.5 h at 50 °C. After cooling to 25 °C, the precipitate was isolated by filtration and dried to give the desired compound 69 (2.33 g, 81 %), which was used without further purification: 1H NMR (400 MHz, [D6]DMSO): δ=4.03 (s, 3 H), 7.83 (ddd, J=9.4, 8.4, 2.8 Hz, 1 H), 7.94 (dd, J=9.9, 2.8 Hz, 1 H), 7.97 (br s, 1 H), 8.39 (br s, 1 H), 8.52 (s, 1 H), 8.83 ppm (dd, J=9.4, 6.1 Hz, 1 H); LC–MS (ESI+): t
R=0.95 min, m/z 249.1 [M+H]+.
Methyl 2‐carbamoyl‐7‐fluoroquinoline‐4‐carboxylate (69): To a solution of dimethyl 7‐fluoroquinoline‐2,4‐dicarboxylate (3.05 g, 11.6 mmol, 68) in methanol (42 mL) was added a 7 m solution of ammonia in methanol (41 mL, 290 mmol) and stirred for 3.5 h at 50 °C. After cooling to 25 °C, the precipitate was isolated by filtration and dried to give the desired compound 69 (2.33 g, 81 %), which was used without further purification: 1H NMR (400 MHz, [D6]DMSO): δ=4.03 (s, 3 H), 7.83 (ddd, J=9.4, 8.4, 2.8 Hz, 1 H), 7.94 (dd, J=9.9, 2.8 Hz, 1 H), 7.97 (br s, 1 H), 8.39 (br s, 1 H), 8.52 (s, 1 H), 8.83 ppm (dd, J=9.4, 6.1 Hz, 1 H); LC–MS (ESI+): t
R=0.95 min, m/z 249.1 [M+H]+.
 2‐Carbamoyl‐7‐fluoroquinoline‐4‐carboxylic acid (70): To a solution of methyl 2‐carbamoyl‐7‐fluoroquinoline‐4‐carboxylate (3.00 g, 12.1 mmol, 69) in methanol (56 mL) and tetrahydrofuran (20 mL) was added a solution of sodium hydroxide (4.35 g, 109 mmol) in water (111 mL). This mixture was stirred for 1 h at 25 °C and then concentrated in vacuo. The residue was diluted with water; 10 % aq. sulfuric acid was then added until pH 5 was reached. After stirring for additional 15 min the solid was isolated by filtration and dried in vacuo to obtain the desired compound 70 (2.38 g, 84 %), which was used without further purification: 1H NMR (300 MHz, [D6]DMSO): δ=7.76 (ddd, J=9.4, 8.4, 2.8 Hz, 1 H), 7.89 (dd, J=9.9, 2.7 Hz, 1 H), 7.92 (br s, 1 H), 8.35 (br s, 1 H), 8.46 (s, 1 H), 8.89 ppm (dd, J=9.4, 6.2 Hz, 1 H); LC–MS (ESI+): t
R=0.70 min, m/z 235.1 [M+H]+.
2‐Carbamoyl‐7‐fluoroquinoline‐4‐carboxylic acid (70): To a solution of methyl 2‐carbamoyl‐7‐fluoroquinoline‐4‐carboxylate (3.00 g, 12.1 mmol, 69) in methanol (56 mL) and tetrahydrofuran (20 mL) was added a solution of sodium hydroxide (4.35 g, 109 mmol) in water (111 mL). This mixture was stirred for 1 h at 25 °C and then concentrated in vacuo. The residue was diluted with water; 10 % aq. sulfuric acid was then added until pH 5 was reached. After stirring for additional 15 min the solid was isolated by filtration and dried in vacuo to obtain the desired compound 70 (2.38 g, 84 %), which was used without further purification: 1H NMR (300 MHz, [D6]DMSO): δ=7.76 (ddd, J=9.4, 8.4, 2.8 Hz, 1 H), 7.89 (dd, J=9.9, 2.7 Hz, 1 H), 7.92 (br s, 1 H), 8.35 (br s, 1 H), 8.46 (s, 1 H), 8.89 ppm (dd, J=9.4, 6.2 Hz, 1 H); LC–MS (ESI+): t
R=0.70 min, m/z 235.1 [M+H]+.
 N
4
‐[1‐(4‐Cyanobenzyl)‐5‐methyl‐3‐(trifluoromethyl)‐1H‐pyrazol‐4‐yl]‐7‐fluoroquinoline‐2,4‐dicarboxamide (19, BAY‐876): To a solution of 4‐{[4‐amino‐5‐methyl‐3‐(trifluoromethyl)‐1H‐pyrazol‐1‐yl]methyl}benzonitrile (144 mg, 0.51 mmol, 65) in DMSO (2.3 mL) was added HATU (195 mg, 0.51 mmol), N,N‐diisopropylethylamine (112 μL, 0.64 mmol) and 2‐carbamoyl‐7‐fluoroquinoline‐4‐carboxylic acid (100 mg, 0.43 mmol, 70). The reaction mixture was stirred for 1 h at 25 °C. This mixture was directly purified by preparative HPLC to obtain the desired compound 19 (98 mg, 46 %): 1H NMR (300 MHz, [D6]DMSO): δ=2.27 (s, 3 H), 5.61 (s, 2 H), 7.38 (d, J=8.3 Hz, 2 H), 7.74–7.84 (m, 1 H), 7.86–7.95 (m, 3 H), 7.97 (br s, 1 H), 8.24–8.33 (m, 2 H), 8.40 (br s, 1 H), 10.48 ppm (s, 1 H); 13C NMR (101 MHz, [D6]DMSO): δ=9.3 (s, CH3), 53.1 (s, CH2), 111.0 (s, C), 113.3 (d, J
C−F=20.3 Hz, CH), 114.8 (s, C), 116.4 (s, CH), 118.6 (s, C), 119.7 (d, J
C−F=25.7 Hz, CH), 121.4 (q, J
C−F=269.1 Hz, C), 122.4(s, C), 128.1 (d, J
C−F=10.3 Hz, CH), 128.2 (s, 2CH), 132.9 (s, 2CH), 136.2 (q, J
C−F=35.6 Hz, C), 138.7 (s, C), 141.7 (s, C), 142.6 (s, C), 147.9 (d, J
C−F=13.0 Hz, C), 151.4 (s, C), 163.0 (d, J
C−F=250.4 Hz, C), 165.5 (s, C), 166.1 ppm (s, C); LC–MS (ESI+): t
R=1.11 min, m/z 497.1 [M+H]+.
N
4
‐[1‐(4‐Cyanobenzyl)‐5‐methyl‐3‐(trifluoromethyl)‐1H‐pyrazol‐4‐yl]‐7‐fluoroquinoline‐2,4‐dicarboxamide (19, BAY‐876): To a solution of 4‐{[4‐amino‐5‐methyl‐3‐(trifluoromethyl)‐1H‐pyrazol‐1‐yl]methyl}benzonitrile (144 mg, 0.51 mmol, 65) in DMSO (2.3 mL) was added HATU (195 mg, 0.51 mmol), N,N‐diisopropylethylamine (112 μL, 0.64 mmol) and 2‐carbamoyl‐7‐fluoroquinoline‐4‐carboxylic acid (100 mg, 0.43 mmol, 70). The reaction mixture was stirred for 1 h at 25 °C. This mixture was directly purified by preparative HPLC to obtain the desired compound 19 (98 mg, 46 %): 1H NMR (300 MHz, [D6]DMSO): δ=2.27 (s, 3 H), 5.61 (s, 2 H), 7.38 (d, J=8.3 Hz, 2 H), 7.74–7.84 (m, 1 H), 7.86–7.95 (m, 3 H), 7.97 (br s, 1 H), 8.24–8.33 (m, 2 H), 8.40 (br s, 1 H), 10.48 ppm (s, 1 H); 13C NMR (101 MHz, [D6]DMSO): δ=9.3 (s, CH3), 53.1 (s, CH2), 111.0 (s, C), 113.3 (d, J
C−F=20.3 Hz, CH), 114.8 (s, C), 116.4 (s, CH), 118.6 (s, C), 119.7 (d, J
C−F=25.7 Hz, CH), 121.4 (q, J
C−F=269.1 Hz, C), 122.4(s, C), 128.1 (d, J
C−F=10.3 Hz, CH), 128.2 (s, 2CH), 132.9 (s, 2CH), 136.2 (q, J
C−F=35.6 Hz, C), 138.7 (s, C), 141.7 (s, C), 142.6 (s, C), 147.9 (d, J
C−F=13.0 Hz, C), 151.4 (s, C), 163.0 (d, J
C−F=250.4 Hz, C), 165.5 (s, C), 166.1 ppm (s, C); LC–MS (ESI+): t
R=1.11 min, m/z 497.1 [M+H]+.
Biology
Materials and methods: Cytochalasin B and buffers were obtained from Sigma–Aldrich. All other materials were of reagent grade and were obtained from commercial sources.
Ultra‐high‐throughput screen (uHTS) with human GLUT1: It is well known that a combination of small‐molecule inhibitors of mitochondrial electron transport chain and glucose catabolism synergistically suppress ATP production.40 For uHTS, CHO‐K1 cells were stable transfected with human GLUT1 and a constitutively expressing luciferase as described previously.41 Cells were seeded in 1536 microtiter plates with a density of 1000 cells per well and starved for 24 h in glucose free DMEM in the presence of 1 % FCS. Prior to measurements cells were incubated for 30 min at 37 °C in the presence of 10 μm rotenone to fully block oxidative phosphorylation. Test compounds and caged luciferin were loaded simultaneously. Before application of 0.5 mm glucose and corresponding activation of GLUT1, basal ATP was indirectly measured by luciferase activity in order to identify effects on cellular ATP levels independent of glucose; 10 min kinetic luciferase recordings after application of 500 μm glucose allowed the investigation of compound induced inhibition of GLUT1.
GLUT isoform specificity testing: For specificity testing between GLUT1, GLUT2, GLUT3 and GLUT4 we used DLD1 (for GLUT1), DLD1GLUT1−/− (Horizon discovery, for GLUT3), CHO‐hGLUT2 and CHO‐hGLUT4 (GLUT2 and 4) cells in combination with an oxidative phosphorylation inhibitor (rotenone 1 μm). Cell lines were maintained in DMEM medium supplemented with 10 % FCS and 1 % penicillin‐streptomycin solution and 2 % Glutamax under standard conditions. The cells were treated with trypsin and seeded into 384 plates at a density of 4000 cells per well. The cells were then cultured overnight in glucose free media containing 1 % FCS to reduce intracellular ATP levels. For GLUT1/2/3, after 16 h the cells were incubated with appropriate glucose concentration or in case of GLUT2 fructose concentration (0.1 m for GLUT1, 0.3 m for GLUT3 and 30 mm fructose for GLUT2, respectively) with or without compounds and 1 μm rotenone for 15 min. The CellTiter‐Glo® Luminescent Cell Viability Assay from Promega was then used to measure ATP levels. Assay was normalized to the control cytochalasin B (IC50 GLUT1: 0.1 μm GLUT2: 2.8 μm, GLUT3: 0.12 μm, GLUT4: 0.28 μm), assay variance: 9 %, IC50 calculation R 2>0.9. For GLUT4, after 16 h the glucose free medium was removed and cells were adapted to KCl free tyrode buffer for 3 h. Compounds and rotenone were added and after 20 min cells were incubated with glucose (0.1 m final concentration) for 15 min. The CellTiter‐Glo® Luminescent Cell Viability Assay from Promega was then used to measure ATP levels.
Glucose competition: For the glucose competition DLD1 cells were treated with trypsin and seeded into 384 plates at a density of 4000 cells per well. The cells were then cultured overnight in glucose free media containing 1 % FCS to reduce intracellular ATP levels. After 16 h the cells were incubated with different glucose concentration (0.1; 1 and 10 mm, respectively) together with compound (30 μm to 1 nm) and 1 μm rotenone for 15 min. The CellTiter‐Glo® Luminescent Cell Viability Assay from Promega was then used to measure ATP levels.
Supporting information
As a service to our authors and readers, this journal provides supporting information supplied by the authors. Such materials are peer reviewed and may be re‐organized for online delivery, but are not copy‐edited or typeset. Technical support issues arising from supporting information (other than missing files) should be addressed to the authors.
Supplementary
Acknowledgements
The authors thank the following people for their valuable assistance and input in the experimental procedures: Dr. Marcus Koppitz, Dr. Jens Geisler, Dr. Joachim Kuhnke, Dirk Schneider, Dr. Mélanie Héroult, Dr. Charlotte Christine Kopitz, Dr. Carolyn Sperl, Dr. Heike Petrul, Dr. Maria Quanz, Dr. Luisella Toschi, Dr. Sylvia Gruenewald, Dr. Andrea Haegebarth, and Dr. Holger Hess‐Stumpp. The authors also thank Dr. Ludwig Zorn for his valuable support and precise proofreading during the preparation of this manuscript. BAY‐876 is available as a chemical probe from the Structural Genomics Consortium (SGC, www.thesgc.org).
H. Siebeneicher, A. Cleve, H. Rehwinkel, R. Neuhaus, I. Heisler, T. Müller, M. Bauser, B. Buchmann, ChemMedChem 2016, 11, 2261.
References
- 1.
- 1a. Warburg O. in Ueber den Stoffwechsel der Tumoren, Constable, London, 1930; [Google Scholar]
- 1b. Koppenol W. H., Bounds P. L., Dang C. V., Nat. Rev. Cancer 2011, 11, 325–327; [DOI] [PubMed] [Google Scholar]
- 1c. Warburg O., Science 1956, 123, 309–314; [DOI] [PubMed] [Google Scholar]
- 1d. Warburg O., Science 1956, 124, 269–270; [PubMed] [Google Scholar]
- 1e. Kim J. W., Dang C. V., Cancer Res. 2006, 66, 8927–8930; [DOI] [PubMed] [Google Scholar]
- 1f. Vander Heiden M. G., Cantley L. C., Thompson C. B., Science 2009, 324, 1029–1033; [DOI] [PMC free article] [PubMed] [Google Scholar]
- 1g. Gatenby R. A., Gillies R. J., Int. J. Biochem. Cell Biol. 2007, 39, 1358–1366. [DOI] [PubMed] [Google Scholar]
- 2. Gillies R. J., Robey I., Gatenby R. A., J. Nucl. Med. 2008, 49, 24S–42S. [DOI] [PubMed] [Google Scholar]
- 3. Amann T., Hellerbrand C., Expert Opin. Ther. Targets 2009, 13, 1411–1427. [DOI] [PubMed] [Google Scholar]
- 4. Fu X., Zhang G., Liu R., Wei J., Zhang-Negrerie D., Jian X., Gao Q., J. Chem. Inf. Model. 2016, 56, 517–526. [DOI] [PubMed] [Google Scholar]
- 5. Medina R. A., Owen G. I., Biol. Res. 2002, 35, 9–26. [DOI] [PubMed] [Google Scholar]
- 6. Nishioka T., Oda Y., Seino Y., Yamamoto T., Inagaki N., Yano H., Imura H., Shigemoto R., Kikuchi H., Cancer Res. 1992, 52, 3972–3979. [PubMed] [Google Scholar]
- 7.
- 7a. Brown R. S., Wahl R. L., Cancer 1993, 72, 2979–2985; [DOI] [PubMed] [Google Scholar]
- 7b. Krzeslak A., Wojcik-Krowiranda K., Forma E., Jozwiak P., Romanowicz H., Bienkiewicz A., Brys M., Pathol. Oncol. Res. 2012, 18, 721–728. [DOI] [PMC free article] [PubMed] [Google Scholar]
- 8.
- 8a. Rashed H. E., Ahmed S. A., Abdelgawad M., Life Sci. J. 2015, 12, 162–169; [Google Scholar]
- 8b. Shen Y.-M., Arbman G., Olsson B., Sun X.-F., Int. J. Biol. Markers 2011, 26, 166–172. [DOI] [PubMed] [Google Scholar]
- 9. Nagase Y., Takata K., Moriyama N., Aso Y., Murakami T., Hirano H., J. Urol. 1995, 153, 798–801. [PubMed] [Google Scholar]
- 10. Sasaki H., Shitara M., Yokota K., Hikosaka Y., Moriyama S., Yano M., Fujii Y., Mol. Med. Rep. 2012, 5, 599–602. [DOI] [PubMed] [Google Scholar]
- 11. Cai Y., Zhai J.-j., Feng B.-b., Duan X.-z., He X.-j., J. Obstet. Gynaecol. Res. 2014, 40, 1925–1930. [DOI] [PubMed] [Google Scholar]
- 12.
- 12a. Reinicke K., Sotomayor P., Cisterna P., Delgado C., Nualart F., Godoy A., J. Cell. Biochem. 2012, 113, 553–562; [DOI] [PubMed] [Google Scholar]
- 12b. Effert P., Beniers A. J., Tamimi Y., Handt S., Jakse G., Anticancer Res. 2004, 24, 3057–3063. [PubMed] [Google Scholar]
- 13. Osthus R. C., Shim H., Kim S., Li Q., Reddy R., Mukherjee M., Xu Y., Wonsey D., Lee L. A., Dang C. V., J. Biol. Chem. 2000, 275, 21797–21800. [DOI] [PubMed] [Google Scholar]
- 14. Sheu J. J.-C., Guan B., Tsai F.-J., Hsiao E. Y.-T., Chen C.-M., Seruca R., Wang T.-L., Shih I.-M., Am. J. Pathol. 2012, 180, 1179–1188. [DOI] [PMC free article] [PubMed] [Google Scholar]
- 15. Schwartzenberg-Bar-Yoseph F., Armoni M., Karnieli E., Cancer Res. 2004, 64, 2627–2633. [DOI] [PubMed] [Google Scholar]
- 16.
- 16a. Xu H., Li B., Yu W., Wang H., Zhao X., Yao Y., Huang D., Nucl. Med. Commun. 2013, 34, 953–958; [DOI] [PubMed] [Google Scholar]
- 16b. Wincewicz A., Sulkowska M., Koda M., Sulkowski S., Pathol. Oncol. Res. 2007, 13, 15–20. [DOI] [PubMed] [Google Scholar]
- 17. Barron C. C., Bilan P. J., Tsakiridis T., Tsiani E., Metab. Clin. Exp. 2016, 65, 124–139. [DOI] [PubMed] [Google Scholar]
- 18.
- 18a. Smith T. A. D., Nucl. Med. Biol. 2001, 28, 1–4; [DOI] [PubMed] [Google Scholar]
- 18b. Brown R. S., Leung J. Y., Fisher S. J., Frey K. A., Ethier S. P., Wahl R. L., J. Nucl. Med. 1996, 37, 1042–1047. [PubMed] [Google Scholar]
- 19. Gnudi L., Viberti G., Raij L., Rodriguez V., Burt D., Cortes P., Hartley B., Thomas S., Maestrini S., Gruden G., Hypertension 2003, 42, 19–24. [DOI] [PubMed] [Google Scholar]
- 20. Hughes S. D., Quaade C., Johnson J. H., Ferber S., Newgard C. B., J. Biol. Chem. 1993, 268, 15205–15212. [PubMed] [Google Scholar]
- 21. Vannucci S. J., Maher F., Simpson I. A., Glia 1997, 21, 2–21. [DOI] [PubMed] [Google Scholar]
- 22.
- 22a. Leto D., Saltiel A. R., Nat. Rev. Mol. Cell Biol. 2012, 13, 383–396; [DOI] [PubMed] [Google Scholar]
- 22b. Bryant N. J., Govers R., James D. E., Nat. Rev. Mol. Cell Biol. 2002, 3, 267–277. [DOI] [PubMed] [Google Scholar]
- 23.
- 23a. Salas M., Obando P., Ojeda L., Ojeda P., Perez A., Vargas-Uribe M., Rivas C. I., Vera J. C., Reyes A. M., Am. J. Physiol. 2013, 305, C90–C99; [DOI] [PubMed] [Google Scholar]
- 23b. Jung K.-H., Lee J. H., Quach C. H. T., Paik J.-Y., Oh H., Park J. W., Lee E. J., Moon S.-H., Lee K.-H., J. Nucl. Med. 2013, 54, 2161–2167. [DOI] [PubMed] [Google Scholar]
- 24. Martin H.-J., Kornmann F., Fuhrmann G. F., Chem.-Biol. Interact. 2003, 146, 225–235. [DOI] [PubMed] [Google Scholar]
- 25. Falk R. E., Pat. No. CA1319107 C, 1995.
- 26. Liu Y., Cao Y., Zhang W., Bergmeier S., Qian Y., Akbar H., Colvin R., Ding J., Tong L., Wu S., Hines J., Chen X., Mol. Cancer Ther. 2012, 11, 1672–1682. [DOI] [PubMed] [Google Scholar]
- 27. Granchi C., Qian Y., Lee H. Y., Paterni I., Pasero C., Iegre J., Carlson K. E., Tuccinardi T., Chen X., Katzenellenbogen J. A., Hergenrother P. J., Minutolo F., ChemMedChem 2015, 10, 1892–1900. [DOI] [PMC free article] [PubMed] [Google Scholar]
- 28. Wang D., Chu P.-C., Yang C.-N., Yan R., Chuang Y.-C., Kulp S. K., Chen C.-S., J. Med. Chem. 2012, 55, 3827–3836. [DOI] [PMC free article] [PubMed] [Google Scholar] [Retracted]
- 29. Chan D. A., Sutphin P. D., Nguyen P., Turcotte S., Lai E. W., Banh A., Reynolds G. E., Chi J.-T., Wu J., Solow-Cordero D. E., Bonnet M., Flanagan J. U., Bouley D. M., Graves E. E., Denny W. A., Hay M. P., Giaccia A. J., Sci. Transl. Med. 2011, 3, 94ra70. [DOI] [PMC free article] [PubMed] [Google Scholar]
- 30. Siebeneicher H., Bauser M., Buchmann B., Heisler I., Mueller T., Neuhaus R., Rehwinkel H., Telser J., Zorn L., Bioorg. Med. Chem. Lett. 2016, 26, 1732–1737. [DOI] [PubMed] [Google Scholar]
- 31. Kapoora K., Finer-Moorea J. S., Pedersena B. P., Cabonia L., Waight A., Hillig R. C., Bringmann P., Heisler I., Mueller T., Siebeneicher H., Stroud R. M., Proc. Natl. Acad. Sci. USA 2016, 113, 4711–4716. [DOI] [PMC free article] [PubMed] [Google Scholar]
- 32.Promega Corporation, 2800 Woods Hollow Road, Madison, WI 53711–5399 (USA).
- 33. Lindahl P. E., Oberg K. E., Exp. Cell Res. 1961, 23, 228–237. [DOI] [PubMed] [Google Scholar]
- 34. Ciapetti P., Giethlen B. in The Practice of Medicinal Chemistry, 4th ed (Eds.: C. G. Wermuth, D. Aldous, P. Raboisson, D. Rognan), Elsevier, London, 2015, pp. 181–241. [Google Scholar]
- 35. Pedemonte M. Martinell, Muñoz I. Navarro, López M. Soler, Julián D. Mormeneo, Rosol M., Soldevila A. Llebaria, Aymamí J. Bofarull (Crystax Pharmaceuticals S.L.), Int. PCT Pub. No. WO2009007399 A1, 2009.
- 36. Buchanan J. G., Stobie A., Wightman R. H., J. Chem. Soc. Perkin Trans. 1 1981, 2374–2378. [Google Scholar]
- 37. Sangshetti J. N., Zambare A. S., Gonjari I., Shinde D. B., Mini-Rev. Org. Chem. 2014, 11, 225–250. [Google Scholar]
- 38.
- 38a. Renshaw R. R., Friedman H. L., J. Am. Chem. Soc. 1939, 61, 3320–3322; [Google Scholar]
- 38b. Reddy P. V. N., Jensen K. C., Mesecar A. D., Fanwick P. E., Cushman M., J. Med. Chem. 2012, 55, 367–377. [DOI] [PMC free article] [PubMed] [Google Scholar]
- 39. Carpino L. A., J. Am. Chem. Soc. 1993, 115, 4397–4398. [Google Scholar]
- 40.
- 40a. Ulanovskaya O. A., Janjic J., Suzuki M., Sabharwal S. S., Schumacker P. T., Kron S. J., Kozmin S. A., Nat. Chem. Biol. 2008, 4, 418–424; [DOI] [PMC free article] [PubMed] [Google Scholar]
- 40b. Ulanovskaya O. A., Cui J., Kron S. J., Kozmin S. A., Chem. Biol. 2011, 18, 222–230. [DOI] [PMC free article] [PubMed] [Google Scholar]
- 41. Craig F. F., Simmonds A. C., Watmore D., McCapra F., White M. R. H., Biochem. J. 1991, 276, 637–641. [DOI] [PMC free article] [PubMed] [Google Scholar]
Associated Data
This section collects any data citations, data availability statements, or supplementary materials included in this article.
Supplementary Materials
As a service to our authors and readers, this journal provides supporting information supplied by the authors. Such materials are peer reviewed and may be re‐organized for online delivery, but are not copy‐edited or typeset. Technical support issues arising from supporting information (other than missing files) should be addressed to the authors.
Supplementary