

Abstract
Rosuvastatin is a substrate of choice in clinical studies of organic anion‐transporting polypeptide (OATP)1B1‐ and OATP1B3‐associated drug interactions; thus, understanding the effect of OATP1B1 polymorphisms on the pharmacokinetics of rosuvastatin is crucial. Here, physiologically based pharmacokinetic (PBPK) modeling was coupled with a power calculation algorithm to evaluate the influence of sample size on the ability to detect an effect (80% power) of OATP1B1 phenotype on pharmacokinetics of rosuvastatin. Intestinal, hepatic, and renal transporters were mechanistically incorporated into a rosuvastatin PBPK model using permeability‐limited models for intestine, liver, and kidney, respectively, nested within a full PBPK model. Simulated plasma rosuvastatin concentrations in healthy volunteers were in agreement with previously reported clinical data. Power calculations were used to determine the influence of sample size on study power while accounting for OATP1B1 haplotype frequency and abundance in addition to its correlation with OATP1B3 abundance. It was determined that 10 poor‐transporter and 45 intermediate‐transporter individuals are required to achieve 80% power to discriminate the AUC0‐48h of rosuvastatin from that of the extensive‐transporter phenotype. This number was reduced to 7 poor‐transporter and 40 intermediate‐transporter individuals when the reported correlation between OATP1B1 and 1B3 abundance was taken into account. The current study represents the first example in which PBPK modeling in conjunction with power analysis has been used to investigate sample size in clinical studies of OATP1B1 polymorphisms. This approach highlights the influence of interindividual variability and correlation of transporter abundance on study power and should allow more informed decision making in pharmacogenomic study design.
Keywords: OATP1B1, PBPK modeling, rosuvastatin, study power, transporter variability, renal transporter
Membrane transporters have been frequently implicated as key determinants of intestinal absorption, hepatobiliary disposition, and renal clearance of drugs.1, 2 The organic anion‐transporting polypeptide 1B1 (OATP1B1, SLCO1B1) is one such uptake transporter expressed on the sinusoidal membrane of human hepatocytes. OATP1B1 has broad substrate specificity and is involved in the transport of the statin compounds used clinically in the treatment of hypercholesterolemia and secondary prevention of cardiovascular events.3, 4, 5 Genetic variations in the gene encoding OATP1B1 have been associated with significant interindividual variability in statin pharmacokinetics (PK) and potential adverse drug reactions following statin administration.6, 7, 8, 9, 10, 11, 12, 13 In 2008 a case‐control study of simvastatin‐induced myopathy was carried out using DNA from a randomized trial of just over 12,000 subjects who had received high‐ or low‐dose simvastatin. This analysis led to the association of the SLCO1B1 single‐nucleotide polymorphism (SNP) rs41149056 (c.521C>T) with an increased incidence of myopathy cases,14 which has been confirmed by subsequent studies.15, 16 In 2011 the US Food and Drug Administration added a warning to the simvastatin product label to discourage the administration of 80‐mg simvastatin and strongly recommend patient genotyping prior to dosing. Moreover, a comprehensive update on the corresponding genotype/phenotype database was published last year.17 Meanwhile, rosuvastatin has been highlighted as a probe compound of choice for prospective clinical studies of OATP1B1‐ and OATP1B3‐associated drug interactions because it is relatively well tolerated in patients and not significantly metabolized (in contrast to simvastatin) such that observed interactions result solely from inhibition of transporters.18, 19
Rosuvastatin is a hydrophilic compound and relies greatly on transporter‐mediated uptake and clearance.20, 21 Although the main site of action of statins is the liver, significant clearance through the renal pathway has been reported for rosuvastatin, where renal clearance (mainly tubular secretion) accounts for 28% of total plasma clearance.22 Specifically, basolateral uptake and apical efflux of rosuvastatin in the kidney are mediated by organic anion transporter 3 (OAT3; SLC22A8) and breast‐cancer resistance protein (BCRP; ABCG2), respectively.22, 23, 24 In the liver, OATP1B1, OATP1B3, and sodium‐dependent taurocholate cotransporting polypeptide (NTCP) have been shown to play a significant role in the uptake of rosuvastatin, whereas BCRP has been implicated in its efflux.20, 21, 25, 26 To date, various SNPs have been identified in the OATP1B1 sequence, among which 2 have been more widely studied in terms of their effect on rosuvastatin PK and pharmacodynamics, ie, c.521T>C in exon 5 and c.388A>G in exon 4. These main SNPs can result in 4 haplotypes, identified as *1a (wild type), *1b (involving c.388A), *5 (involving c.521T), and *15 (involving c.521T and c.388A) (Table 1).5, 27, 28 A given individual may be homozygous or heterozygous for these haplotypes. Furthermore, the functional implications of additional SLCO1B1 SNPs have been studied and have led to the identification of further haplotypes, including *14 and *35, which involve 2 additional SNPs, ie, c.463C>A and c.1929A>C.17, 29 Moreover, recent genetic studies have detected a coordinated expression (colinearity) of OATP1B1 and OATP1B3 in human liver, with respect to mRNA and, to a lesser extent, protein expression.30 These observations are believed to be linked to posttranscriptional and posttranslational regulation of OATP expression by hepatic nuclear factor 1α (HNF1α) and protein kinase C (PKC), respectively.30, 31, 32
Table 1.
OATP1B1 Phenotype Information Included as Systems Parameters in the Updated Full PBPK Rosuvastatin Model*
| Phenotype | Diplotype | Polymorphisms Involved | Relative Abundance | CV (%) |
|---|---|---|---|---|
| Extensive transporter (ET) | *1a/*1a | c.521T>C, c.388A>G | 1 | 74 |
| *1a/*1b | c.521T>C, c.388A>G | |||
| *1a/*14 | c.521T>C, c.388A>G, c.463C>A | |||
| *1a/*35 | c.521T>C, c.388A>G, c.1929A>C | |||
| Intermediate transporter (IT) | *1a/*5 | c.521T>C, c.388A>G | 0.68 | 54 |
| *1a/*15 | c.521T>C, c.388A>G | |||
| *1b/*15 | c.521T>C, c.388A>G | |||
| *5/*14 | c.521T>C, c.388A>G, c.463C>A | |||
| *14/*15 | c.521T>C, c.388A>G, c.463C>A | |||
| Poor transporter (PT) | *5/*5 | c.521T>C, c.388A>G | 0.37 | 35 |
| *15*15 | c.521T>C, c.388A>G | |||
| *5/*15 | c.521T>C, c.388A>G |
*Frequency, relative abundance, and the related population variability of each phenotype were obtained from in‐house meta‐analysis of published studies.1, 2, 3, 4, 5, 6, 7, 8, 9, 10, 11, 12 Diplotypes associated with each phenotype definition are also summarized. Note: all combinations of a given diplotype have been included in the model (eg, *1a/*1b and *1b/*1a) but for simplicity not included in this table.
The frequent use of rosuvastatin in drug‐drug interaction studies has led to a rise in clinical studies comparing the effect of various SLCO1B1 polymorphisms on the PK and pharmacodynamics of this compound.11, 12, 13 , 27, 29, 33 Within such studies, it is valuable to consider the statistical power required to detect the effect of OATP1B1 polymorphisms on PK. The power of a study defines its ability to detect a difference, if one exists (ie, correctly reject the null hypothesis). The main factors that can affect study power include the magnitude of the true difference, the population variability, and the sample size. To date, 2 rosuvastatin pharmacogenetic studies have considered the influence of sample size on study power, and 1 of them was underpowered due to post‐hoc analysis of subject genotypes and the low frequency of poor transporters in the Caucasian population (2%–3%).9 The second study based the power calculations on the observed trial variability, which might not necessarily be representative of the “true” population variability because the studied population (n = 4) was likely too small to capture the population variability.13
In this study physiologically based pharmacokinetic modeling (PBPK) in conjunction with a power calculation algorithm was used to evaluate the required sample size to detect an effect of OATP1B1 polymorphisms on rosuvastatin PK parameters. In future this approach can aid the design of clinical trials with sufficient power to detect phenotype differences in specific populations while it prevents costly population studies with markedly small or unnecessarily large sample sizes.
Methods
Rosuvastatin PBPK Model
Simulations were conducted in the Simcyp Simulator (Version 14, Release 1) (Simcyp Ltd, a Certara Company). A whole‐body PBPK model for rosuvastatin has been described previously.34 In this model, distribution to all tissues except gut and liver was assumed to be perfusion‐limited with tissue partition coefficients predicted using the Rodgers and Rowland method.35 Distribution of rosuvastatin into the liver was described by a permeability‐limited liver (PerL) model, which accounted for transporter‐mediated intrinsic clearance (CLint,T) for the sinusoidal uptake transporters OATP1B1, OATP1B3, and NTCP as well as the canalicular efflux transporter BCRP.20, 21 Absorption of oral rosuvastatin was modeled using the Advanced Dissolution, Absorption and Metabolism (ADAM) model, which accounts for active apical efflux via intestinal BCRP. Renal clearance has been shown to be an important component of rosuvastatin elimination (28%) and was accounted for in the original model using estimates from in vivo data. Recent work has demonstrated the involvement of renal transporters, namely OAT3 and BCRP, in the uptake and efflux of rosuvastatin; therefore, in the current work these were included mechanistically as described below.22, 24 The previously published parameters describing rosuvastatin absorption, distribution, metabolism, and elimination are summarized in Supplementary Table S1 and were used in the current rosuvastatin model with the additions summarized below.
Rosuvastatin Mechanistic Kidney Model
Renal clearance and variability were incorporated in the PBPK model using drug‐specific data and a mechanistic approach via the permeability‐limited kidney model (Mech KiM)36 (Figure 1). The passive diffusion clearance (CLPD) across the blood‐cell and cell‐tubule barriers was assumed to be equal. An estimate of the cellular permeability of rosuvastatin was obtained from experimental data in Caco‐2 cells.37 This permeability value was scaled using an in vitro–in vivo extrapolation (IVIVE) technique accounting for total nephron surface area (291 cm2), kidney weight (341.5 g), compound ionization, and proximal tubule cells per gram kidney (60 million) to obtain a CLPD value of 9.84 × 10⁻² mL/min per million proximal tubule cells (PTCs).36 Accounting for only CLPD and glomerular filtration, a CLR of 1.13 L/h was predicted instead of the observed 17 L/h. Therefore, the difference between the observed and predicted CLR was assigned to active secretion across renal cells. Assuming a constant CLPD along the nephron and negligible renal metabolism, active transport CLint,T via basolateral uptake (OAT3) and apical efflux (BCRP) was identified, through sensitivity analysis, to be 1100 μL/min per million cells, assuming equal unidirectional transport across both membranes. These active transport CLint,T together with the above‐mentioned CLPD and glomerular filtration resulted in a renal clearance prediction of 17 L/h as observed.22, 38, 39
Figure 1.
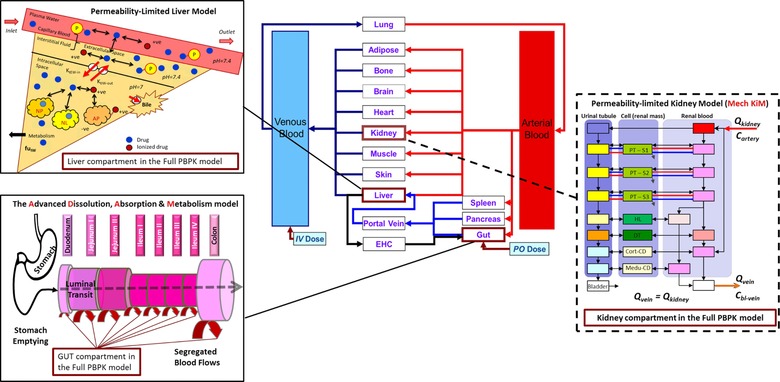
Schematic representation of the transporter pathways included in the rosuvastatin full PBPK model. This schematic depicts the mechanistic permeability‐limited models included in this study. The Advanced Dissolution, Absorption, and Metabolism (ADAM) model, which represents the gastrointestinal tract and the permeability‐limited liver (PerL) model have been previously implemented,34 whereas the mechanistic kidney model (Mech KiM) was added in the extended rosuvastatin model used in this study in order to mechanistically account for the renal component of rosuvastatin disposition and the role of renal transporters, OAT3 and BCRP.
OATP1B1‐OATP1B3 Correlation
The rosuvastatin model was further modified to include the previously reported OATP1B1‐OATP1B3 protein correlation.28, 30 , 40, 41, 42, 43 A global hepatic uptake CLint,T value was previously obtained through parameter estimation, and relevant fractions were assigned to each transporter (OATP1B1 0.49, OATP1B3 0.16, and NTCP 0.35) based on in vitro observations.34 Correlation was accounted for through addition of the CLint,T values for OATP1B1 and OATP1B3, resulting in matched interindividual variability for both transporters. The hepatic CLint,T value for OATP1B3 (36 μL/min per million cells) combined with the value assigned to OATP1B1 (109 μL/min per million cells) resulted in a final combined CLint,T value of 145 μL/min per million cells assigned to OATPs in the PerL model.
OATP1B1 Polymorphisms, Frequency, and Abundance
The default North European Caucasian healthy volunteer population within the Simcyp Simulator database was used, including information on known OATP1B1 haplotypes and their respective frequencies and abundances. Three OATP1B1 phenotypes, specifically extensive transporter (ET), intermediate transporter (IT), and poor transporter (PT), were introduced, where each phenotype was assigned based on a combination of haplotypes involving 4 nonsynonymous polymorphisms: c.521T>C, c.388A>G, c.463C>A and c.1929A>C. Frequency, relative abundance, and the related population variability of each phenotype were previously implemented within the software and are summarized in Table 1. Separate populations representing each OATP1B1 phenotype were created, where individuals were ETs, ITs, or PTs. An ultrarapid transporter (UT) population was not considered in this study, as detailed evaluation of UTs in a clinical setting is still lacking.
Simulations
To verify the performance of the extended rosuvastatin PBPK model, 10 virtual trials of healthy volunteers (number of subjects in each trial, proportion of females, and age range of the study population are summarized in Table S2) receiving a single oral dose of 10, 20, 40, and 80 mg rosuvastatin were simulated. The simulated plasma concentration profiles were compared with observed data from 11 independent pharmacokinetic studies, described in Table S2.9, 22 , 44, 45, 46, 47, 48 This model was then tested in subjects stratified based on OATP1B1 phenotype. Ten virtual trials of Caucasian healthy volunteers (matching the study subjects summarized in Table 2) receiving a single oral dose of 10 mg rosuvastatin were simulated over 48 hours in 3 OATP populations (ET, IT, and PT). The simulated plasma concentration profiles were compared with observed data published by Pasanen et al.13
Table 2.
Details of the Clinical OATP1B1 Polymorphism Study Design by Pasanen et al13 Used for Performance Verification of the OATP1B1 Phenotype Component of the Rosuvastatin PBPK Model*
| OATP1B1 | Number of | Age Range | Proportion |
|---|---|---|---|
| Genotype | Subjects | (Years) | Female |
| c.521TT | 16 | 20‐23 | 0.5 |
| c.521TC | 12 | 21‐24 | 0.42 |
| c.521CC | 4 | 20‐23 | 0.25 |
*A single oral dose of 10 mg rosuvastatin was administered.
Power Analysis
The required sample size in each OATP phenotype group to detect a significant difference in rosuvastatin AUC0‐48h (ng/[mL·h]) with a statistical power of at least 80% (α‐level 5%) was determined using a power calculation algorithm available within the Simcyp Simulator based on the methodology described by Armitage et al.49 A detailed description of the methodology for power analysis and sample size calculation is provided in the Supplementary Material. AUC0‐48h was used as the reference pharmacokinetic parameter because it is more representative of hepatic processes and therefore more relevant to OATPs, whereas Cmax values may be most sensitive to the impact of intestinal uptake and efflux. An enriched recruitment approach was utilized, in which the subject phenotypes were determined prior to start of the study. The number of virtual individuals in each phenotype group was set to 500 subjects in order to generate a representative population mean and standard deviation. A fixed‐seed random distribution method was used for randomization of the generated virtual individuals, with a seed variable of 500. The virtual subjects were assumed to be extensive transporters for BCRP, OAT3, and NTCP.
The effect of interindividual variability on study power was assessed by first setting the coefficient of variation (CV) of OATP1B1 and OATP1B3 abundance to 0 and carrying out the same power analysis as above. In the next scenario the abundance CV values of all transporters involved in the uptake and efflux of rosuvastatin were set to 0. In this case the impact of transporter variability was eliminated in the power calculations, and the remaining variability was propagated from variability associated with other system parameters such as hepatocellularity, organ size, age, weight, height, body surface area, and plasma protein binding.
Results
Verification of the Rosuvastatin PBPK Model
Simulated rosuvastatin plasma concentrations were in agreement with observed data from 11 independent clinical studies in healthy volunteers, using the rosuvastatin model including Mech KiM and information on OATP1B1‐1B3 correlation. The simulations matching the demographics of each of the 11 clinical studies are provided in Supplementary Figures S1‐S11. Following oral administration of rosuvastatin, mean predicted AUC0‐48h at 10, 20, 40, and 80 mg ranged from 26.4 to 53.4 ng/(mL·h), 51.8 to 116.7 ng/(mL·h), 103.6 to 233.4 ng/(mL·h), and 211.1 to 460.3 ng/(mL·h) for the 10 simulated trials, respectively (Supplementary Table S3). Although a high degree of variability was observed over the different dose ranges simulated (10‐80 mg) the AUC0‐48, Cmax and tmax for the mean predicted data were within 2‐fold of the observed data. The predicted vs observed AUC0‐48 ratios are depicted in Figure 2.
Figure 2.
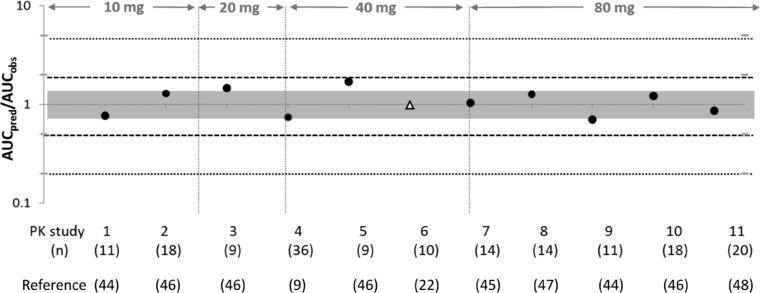
Plot summarizing the ratio of predicted over observed AUCs of 10‐, 20‐, 40‐, and 80‐mg doses of rosuvastatin. The gray area indicates a 1.25‐fold over‐ or underprediction, the dashed lines indicate 2‐fold over‐ or underprediction, and the dotted lines represent 5‐fold over‐ or underprediction. The black circles represent the mean AUC ratios (predicted/observed) that were used in testing of the updated rosuvastatin compound file,9 , 44, 45, 46 , 48 and the Caucasian triangle represents the AUC ratio from a study that was also used in model development.22 The study numbers (Table 2) and number of subjects in each study are indicated below the plot. The dose studied in each study is indicated on the top.
Rosuvastatin plasma concentrations were then simulated in subjects stratified on the basis of OATP1B1 phenotype (ET, IT, or PT) following an oral dose of 10 mg. The simulated profiles matched the observed data from each phenotype group with AUC0‐48, Cmax, and tmax for the predicted data within 2‐fold of the observed data (Figure 3) (individual mean and standard deviations are summarized in Supplementary Table S4).
Figure 3.
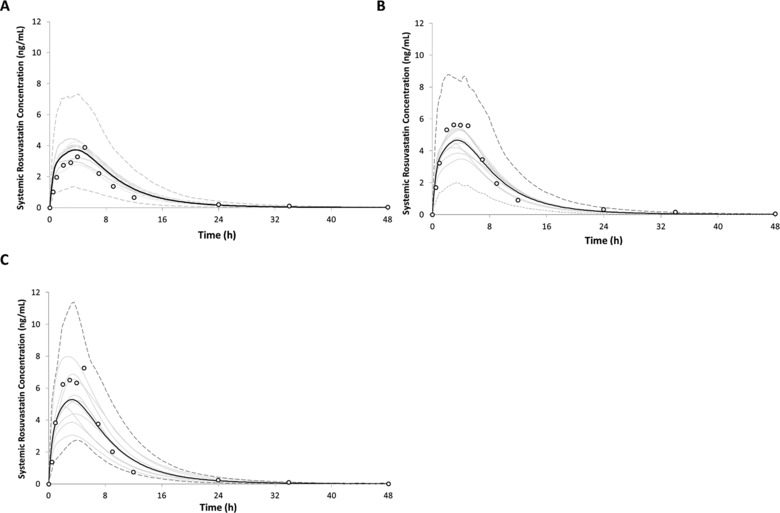
Simulated and observed plasma concentration‐time profiles of rosuvastatin in healthy volunteers following oral administration of a 10‐mg dose in healthy volunteers stratified based on OATP phenotype as (A) extensive transporter (ET), (B) intermediate transporter (IT), or (C) poor transporter (PT). The black lines indicate the mean concentration for the simulated population (n = 160) matched to the observed study design with respect to age, sex, and subject number. Trial means are indicated using the solid gray lines. The dashed gray lines represent the upper (5th) and lower (95th) percentiles for the simulated concentrations. Empty circles represent observed mean values from the reference clinical study.13
Power Analysis
In the extended rosuvastatin PBPK model, the number of subjects required in a clinical study to achieve at least 80% statistical power to discriminate the AUC of rosuvastatin in PT and IT individuals compared to ETs was determined. The corresponding powers to detect differences in AUC between the OATP1B1 PT and IT compared to the ET phenotype are shown in Figure 4 and Table 3. Initially, the rosuvastatin model excluding the correlation between OATP1B1 and ‐1B3 was used. The power analysis indicated that 10 PT and 45 IT subjects will be required to obtain 80% power to discriminate the AUC from ETs (Figure 4A). However, when the OATP1B1‐1B3 correlation was taken into account, the number of subjects required to obtain 80% power was reduced to 7 PTs and 40 ITs (Figure 4B). In order to assess the influence of interindividual variability on study power, 2 additional scenarios were explored. In scenario 3, the CVs of OATP1B1 and OATP1B3 abundance were set to 0, and power analysis was carried out. In scenario 4, the CV in the abundance of all other transporters involved in the uptake and efflux (intestine, liver, and kidney) of rosuvastatin was set to 0, representing the simplest scenario where no transporter variability is present. The results of this assessment are presented in Table 3. These indicate that a reduction in variability, especially associated with all transporters involved in the uptake and efflux of rosuvastatin, results in a reduction in the number of subjects to 3 PTs and 17 ITs. Analysis of AUC values from 40 simulated trials (using scenario 2) of 4 individuals and the respective variability compared to published mean AUC value and variability is shown in Figure 5 and indicates that only 2 of the simulated trials matched the published clinically associated variability, although all studies were within 2‐fold of the observed AUC.13
Figure 4.
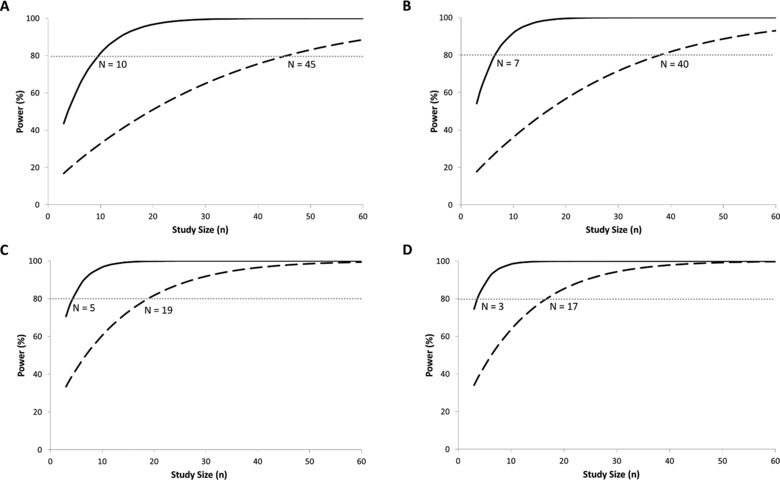
Outputs of simulations depicting the statistical power of detecting differences in rosuvastatin AUC0‐48h in the presence of OATP polymorphisms using the extended rosuvastatin model (A) without OATP1B1‐1B3 colinearity, (B) with OATP1B1‐1B3 colinearity, (C) OATP CV = 0, and (D) all transporters, CV = 0. The solid black line represents the poor transporter population, and the dashed black line represents the intermediate transporter population. The dashed gray line indicates the point at which 80% power to discriminate the AUC of rosuvastatin from the extensive transporter phenotype individuals has been reached. The intersection of the respective PT and IT lines with this dashed gray line indicates the minimum number of subjects required from each phenotype group.
Table 3.
Outcome of Simulations to Determine the Number of Poor Transporter (PT) and Intermediate Transporter (IT) Subjects Required to Reach 80% Power to Discriminate the AUC of Rosuvastatin From Extensive Transporter Phenotype Carriers Tested Under Various Conditions
| Condition Tested in the | Number of | Number of |
|---|---|---|
| PBPK Model | PT Subjects | IT Subjects |
| No colinearity between OATP1B1 and OATP1B3 assumed (scenario 1) | 10 | 45 |
| Colinearity between OATP1B1 and OATP1B3 assumed (scenario 2) | 7 | 40 |
| Setting all CV values for OATPs to 0 (scenario 3) | 5 | 19 |
| Setting all transporter CV values to 0 (scenario 4) | 3 | 17 |
Figure 5.
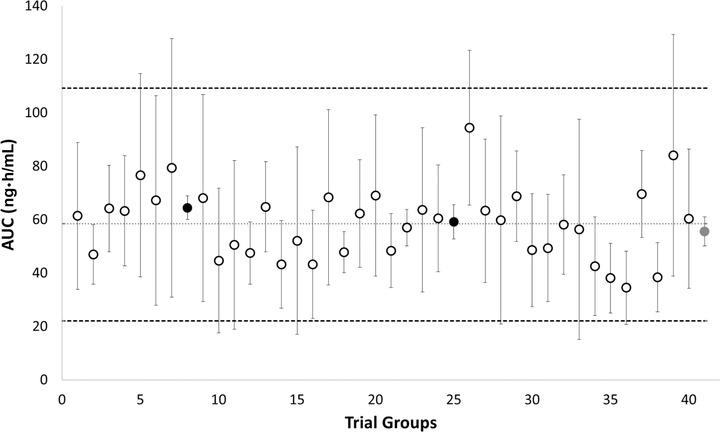
AUC results from 40 trials of 4 individuals out of a population of 160 OATP1B1 poor transporter individuals simulated using the Simcyp Simulator. The circles represent the median AUC obtained from each trial. The dotted lines represent the upper (5th) and lower (95th) percentiles for the simulated AUCs. The dashed line represents the median of the simulated population AUC. The red circle indicates the published AUC (including variability) from a trial of 4 poor transporter subjects,13 and the 2 black circles represent the 2 simulated trials, which matched the published variability.
Discussion
This is the first study to illustrate the application of PBPK modeling in investigating the statistical power of OATP pharmacogenetic studies to recognize covariates a priori while facilitating informed decision making. As a case example, the sample size required to detect a difference (80% power) in the AUC of rosuvastatin was investigated in North European Caucasian individuals with different OATP1B1 phenotypes.
The rosuvastatin PBPK model presented here considered the hepatic and renal clearance in a mechanistic manner. The model accounted for the hepatic abundances (activities) of the different OATP1B1 phenotype groups as well as the reported correlation between OATP1B1 and OATP1B3 observed at the mRNA and protein expression level. Given that 28% of rosuvastatin is cleared renally via BCRP and OAT3 in parallel with the glomerular filtration, passive (nonsaturable) secretion, and reabsorption, the model can capture the effect of both the hepatic and renal pathways and the potential link between these organs.22
The model was able to adequately recover the observed plasma rosuvastatin concentrations, although some profiles were still not completely recovered, especially in cases where a delay in absorption was observed (eg, Supplementary Figures S3, S5). Because these studies all used the same formulation, this observation might be due to the fact that additional pathways are involved in the intestinal active transport of rosuvastatin,50 which are currently not clearly identified and therefore were not incorporated into the model. Further research into the intestinal uptake and efflux of rosuvastatin will be required to fully understand and account for these differences more mechanistically.
With respect to the genotype studies, slight differences in the predicted and observed profiles may be attributed to differences in the populations used (Figure 3, Supplementary Table 4). Although the simulated trials and virtual subjects were matched to corresponding clinical trials, the model included information on 4 different SNPs and the corresponding haplotypes, allowing a comparison of different OATP1B1 phenotypes, whereas the matched clinical study focused on the major OATP1B1 SNP (rs41149056; C521T) genotypes only. Furthermore, evaluation of the influence of OATP1B1 phenotype on hepatic unbound intracellular water concentrations of rosuvastatin, which has been shown to be the relevant driving concentration for a rosuvastatin PD model, did not suggest an influence of OATP phenotype on PD response to rosuvastatin in the extended model, consistent with results presented previously51 (data not shown).
Previous studies have investigated the effect of OATP1B1 polymorphisms (mainly c.521T>C) on the PK of various statins.7, 9 , 11, 12, 13 , 27 However, the robustness of such studies may be greatly influenced by study power. The aims of the current study were to determine the number of subjects required to achieve 80% power as well as to assess the influence of interindividual variability on calculating study power.
Initial power analyses, which did not account for the OATP1B1‐OATP1B3 correlation, indicated that 10 PT and 45 IT subjects are required to achieve 80% power to discriminate the AUC of rosuvastatin from that of ET individuals. However, the observed PK variability is dependent on all the saturable and nonsaturable processes involved in drug disposition and metabolism and their interconnections. Therefore, it would be expected that as more transporters are involved, the higher the chance of observing a coordinated regulation of transporters (eg, via shared expression and regulation pathways), resulting in less variability than if the variability of each transporter had been randomly assigned by Monte‐Carlo sampling. Thus, the in vivo variability in the PK parameters following a clinical study (such as AUC) would be expected to be lower than the corresponding variability that is simulated when individual, unlinked, protein variability is assumed because different transporter and enzyme pathways will have lower degrees of freedom in their values. In fact, when OATP1B1‐OATP1B3 correlation was taken into account in this study, the number of subjects required was reduced to 7 PTs and 40 ITs due to a reduced variability in the presence of the correlation. Of the 40 trials simulated in the PT population (each containing 4 PT subjects), 2 trials agreed with the reported in vivo trial mean and variability (Figure 5),13 which was also obtained from only 4 poor transporter subjects. For both trials the virtual individuals within the trial were comparable in total OATP1B1/OATP1B3 expression, leading to small overall variability in AUC. Therefore, as expected, when the in vivo trial mean is used to calculate statistical power, homogeneity of the study population (as shown above) will affect the sample size required to reach 80% power, such that a smaller sample size will be required for a homogeneous sample, which may not necessarily be representative of the complete range of variability in a population. Although under specific circumstances (ie, a homogeneous sample), a sample size of 4 may be sufficient, when attempting to recover the range of variability in a population, a slightly larger sample size should be considered (Figure 4A).
To test this observation, the effect of interindividual variability of transporter abundances on study power and sample size was assessed by using 2 additional scenarios. First, liver transporter abundance CV values were set to 0 for OATP1B1 and OATP1B3 (scenario 3), and in the next scenario (scenario 4), the transporter abundance CV was set to 0 for all transporters involved in the uptake and efflux of rosuvastatin. As expected, removal of variability in the expression of OATPs led to a reduction in the sample size required to reach 80% power to 5 PTs and 19 ITs. This observation confirms that although the correlation between OATP1B1 and OATP1B3 will affect the power of the study, it is not sufficient to completely explain the reported in vivo trial variability for rosuvastatin in Caucasians13 and that interactions between other transporters and/or enzymes exist. Furthermore, in the last approach, where no transporter variability was present, the sample size was further reduced (Table 3, Figure 4) but did not reach the minimum, suggesting that the variability in other systems parameters in the model (eg, hepatocelularity, liver weight) also plays a role in the calculation of the study power regardless of the transporter‐specific parameters. Thus, to discriminate the AUC of rosuvastatin from ET individuals, at least 3 PTs and 17 ITs would be required when accounting for population variability propagated from system parameters other than transporter abundances such as liver weight, hepatocellularity, glomerular filtration, and plasma binding.52, 53
It is expected that accounting for additional transporter‐transporter and transporter‐enzyme correlations will result in further changes in the required sample size. Although the latter is less relevant in the case of rosuvastatin, the former may involve OATP2B1‐BCRP interplay in the absorption (gut) and elimination (liver), which is expected to further influence variability and study power. Active uptake of rosuvastatin by OATP2B1 has been previously described; however, this process is influenced by pH, whereby uptake has been shown to decrease when buffer pH was changed from 5.5 to 7.4.54 Therefore, OATP2B1 transport may be more relevant as an intestinal transporter of rosuvastatin (published data for this are currently not available) or play a significant role in the liver under disease conditions that affect the local (hepatic Na+/H+ exchanger‐driven) pH gradient. As this was not the scope of the current study, only OATP1B1, OATP1B3 and NTCP were considered in the hepatic uptake of rosuvastatin in the current model. The next step into refining the power calculation for pharmacogenetic studies of rosuvastatin should involve accounting for the role of BCRP polymorphisms and a potential OATP2B1‐BCRP correlation. Furthermore, it should be noted that the variability in the expression of transporters and enzymes is not the same among different ethnicities and populations. In addition, transporters and enzymes might contribute to different extents to the disposition of a given compound in different populations. Currently, published information on absolute abundance of OATPs in healthy Japanese or Chinese volunteers, as well as information on the linkage between transporters and/or enzymes, is not available, as indicated by a recent in‐house meta‐analysis (55). However, this information will be required to carry out similar studies in different ethnicities. Alternatively, substrate‐specific transporter scalars can be utilized for such studies but will require compound‐specific genotype‐linked pharmacokinetic data in the ethnic population of interest, which is currently not available for many substrates.56 It has been previously shown that the observed ethnic differences in rosuvastatin pharmacokinetics cannot be explained using only weight‐ and diet‐related differences between the Asian and Caucasian populations. 6, 9 Thus, it is likely that the observed ethnic differences are related to differences in genetic and/or intrinsic factors that influence the expression and/or activity of the various drug transporters involved in the uptake and efflux of rosuvastatin.9 Furthermore, when only the body weight and height were used as covariates, there was still unexplained variability present between the Asian and Caucasian populations.
Last, it is important to note that in this study, rosuvastatin was used as an example compound to illustrate the utility of the PBPK modeling combined with the power calculation approach. However, this approach can be applied to a wide range of other compounds where the appropriate drug data and relevant population data are available to build a PBPK model comparable to the one illustrated here for rosuvastatin.
Conclusions
This study is the first in which PBPK modeling in conjunction with a power calculation algorithm has been used to investigate the influence of OATP1B1 polymorphisms on the sample size required to detect phenotypic differences in rosuvastatin PK. The current findings highlight the importance of understanding the saturable and nonsaturable processes involved in the disposition of the compound of interest. In particular, it is important to integrate all contributing factors, for example, by determining how much of the active component might be contributed by a given transporter. This information is as vital to the prediction of study power as it is to predicting the PBPK profile and the magnitude of drug‐drug interactions of a given compound, similar to the role of fraction metabolized, which has been previously shown for CYP450 enzymes.57 Furthermore, the importance of accounting for correlation between transporters and/or enzymes and the potential effect on interindividual variability was highlighted, which could in turn influence the number of subjects required to achieve a given study power.58 Based on the currently available population data and assuming no correlation between OATP1B1 and OATP1B3, 10 PTs and 45 ITs would be required to reach 80% study power. Assuming a strong correlation between OATP1B1 and OATP1B3 reduces the required number to only 7 PTs and 40 ITs. Although the required sample size may be even smaller in clinical studies where a homogeneous sample of the population is used, realistically a larger number of subjects will be required when accounting for the interindividual and interoccasion variability present in the “true” population.
Supporting information
Disclaimer: Supplementary materials have been peer‐reviewed but not copyedited.
Supplementary Material
Acknowledgments
The authors would like to thank Eleanor Savill and Jessica Waite for their assistance in formatting the manuscript for submission. The authors would also like to thank Kim Crewe for her help with the inclusion of OATP1B1 phenotype information into the Simcyp Simulator.
Disclosures
Ariane Emami Riedmaier, Howard Burt, Khaled Abduljalil, and Sibylle Neuhoff are employees of Simcyp Ltd (a Certara Company).
References
- 1. Giacomini KM, Huang SM. Transporters in drug development and clinical pharmacology. Clin Pharmacol Ther. 2013;94(1):3–9. [DOI] [PubMed] [Google Scholar]
- 2. Hillgren KM, Keppler D, Zur AA, et al. Emerging transporters of clinical importance: an update from the International Transporter Consortium. Clin Pharmacol Ther. 2013;94(1):52–63. [DOI] [PubMed] [Google Scholar]
- 3. Niemi M. Role of OATP transporters in the disposition of drugs. Pharmacogenomics. 2007;8(7):787–802. [DOI] [PubMed] [Google Scholar]
- 4. Kalliokoski A, Niemi M. Impact of OATP transporters on pharmacokinetics. Br J Pharmacol. 2009;158(3):693–705. [DOI] [PMC free article] [PubMed] [Google Scholar]
- 5. Niemi M, Pasanen MK, Neuvonen PJ. Organic anion transporting polypeptide 1B1: a genetically polymorphic transporter of major importance for hepatic drug uptake. Pharmacol Rev. 2011;63(1):157–181. [DOI] [PubMed] [Google Scholar]
- 6. Birmingham BK, Bujac SR, Elsby R, et al. Impact of ABCG2 and SLCO1B1 polymorphisms on pharmacokinetics of rosuvastatin, atorvastatin and simvastatin acid in Caucasian and Asian subjects: a class effect? Eur J Clin Pharmacol. 2015;71(3):341–355. [DOI] [PubMed] [Google Scholar]
- 7. Kalliokoski A, Backman JT, Neuvonen PJ, Niemi M. Effects of the SLCO1B1*1B haplotype on the pharmacokinetics and pharmacodynamics of repaglinide and nateglinide. Pharmacogenet Genom. 2008;18(11):937–942. [DOI] [PubMed] [Google Scholar]
- 8. Kivisto KT, Niemi M. Influence of drug transporter polymorphisms on pravastatin pharmacokinetics in humans. Pharm Res. 2007;24(2):239–247. [DOI] [PubMed] [Google Scholar]
- 9. Lee E, Ryan S, Birmingham B, et al. Rosuvastatin pharmacokinetics and pharmacogenetics in Caucasian and Asian subjects residing in the same environment. Clin Pharmacol Ther. 2005;78(4):330–341. [DOI] [PubMed] [Google Scholar]
- 10. Niemi M. Transporter pharmacogenetics and statin toxicity. Clin Pharmacol Ther. 2010;87(1):130–133. [DOI] [PubMed] [Google Scholar]
- 11. Niemi M, Pasanen MK, Neuvonen PJ. SLCO1B1 polymorphism and sex affect the pharmacokinetics of pravastatin but not fluvastatin. Clin Pharmacol Ther. 2006;80(4):356–366. [DOI] [PubMed] [Google Scholar]
- 12. Pasanen MK, Neuvonen M, Neuvonen PJ, Niemi M. SLCO1B1 polymorphism markedly affects the pharmacokinetics of simvastatin acid. Pharmacogenet Genom. 2006;16(12):873–879. [DOI] [PubMed] [Google Scholar]
- 13. Pasanen MK, Fredrikson H, Neuvonen PJ, Niemi M. Different effects of SLCO1B1 polymorphism on the pharmacokinetics of atorvastatin and rosuvastatin. Clin Pharmacol Ther. 2007;82(6):726–733. [DOI] [PubMed] [Google Scholar]
- 14. SEARCH Collaborative Group , Link E, Parish S, et al. SLCO1B1 variants and statin‐induced myopathy—a genomewide study. N Engl J Med. 2008;359(8):789–799. [DOI] [PubMed] [Google Scholar]
- 15. Heart Protection Study Collaborative Group , Bulbulia R, Bowman L, et al. Effects on 11‐year mortality and morbidity of lowering LDL cholesterol with simvastatin for about 5 years in 20,536 high‐risk individuals: a randomised controlled trial. Lancet. 2011;378(9808):2013–2020. [DOI] [PMC free article] [PubMed] [Google Scholar]
- 16. Voora D, Shah SH, Spasojevic I, et al. The SLCO1B1*5 genetic variant is associated with statin‐induced side effects. J Am Coll Cardiol. 2009;54(17):1609–1616. [DOI] [PMC free article] [PubMed] [Google Scholar]
- 17. Ramsey LB, Bruun GH, Yang W, et al. Rare versus common variants in pharmacogenetics: SLCO1B1 variation and methotrexate disposition. Genome Res. 2012;22(1):1–8. [DOI] [PMC free article] [PubMed] [Google Scholar]
- 18. Ebner T, Ishiguro N, Taub ME. The use of transporter probe drug cocktails for the assessment of transporter‐based drug‐drug interactions in a clinical setting—proposal of a four component transporter cocktail. J Pharm Sci. 2015;104(9):3220–3228. [DOI] [PubMed] [Google Scholar]
- 19. US Food and Drug Administration . FDA drug interaction studies—Study design, data analysis, implications for dosing, and labeling recommendations. Draft Guidance. Silver Spring, MD: FDA; 2012. [Google Scholar]
- 20. Ho RH, Tirona RG, Leake BF, et al. Drug and bile acid transporters in rosuvastatin hepatic uptake: function, expression, and pharmacogenetics. Gastroenterology. 2006;130(6):1793–1806. [DOI] [PubMed] [Google Scholar]
- 21. Kitamura S, Maeda K, Wang Y, Sugiyama Y. Involvement of multiple transporters in the hepatobiliary transport of rosuvastatin. Drug Metab Dispos. 2008;36(10):2014–2023. [DOI] [PubMed] [Google Scholar]
- 22. Martin PD, Warwick MJ, Dane AL, Brindley C, Short T. Absolute oral bioavailability of rosuvastatin in healthy Caucasian adult male volunteers. Clin Ther. 2003;25(10):2553–2563. [DOI] [PubMed] [Google Scholar]
- 23. Martin PD, Mitchell PD, Schneck DW. Pharmacodynamic effects and pharmacokinetics of a new HMG‐CoA reductase inhibitor, rosuvastatin, after morning or evening administration in healthy volunteers. Br J Clin Pharmacol. 2002;54(5):472–477. [DOI] [PMC free article] [PubMed] [Google Scholar]
- 24. Windass AS, Lowes S, Wang Y, Brown CDA. The contribution of organic anion transporters OAT1 and OAT3 to the renal uptake of rosuvastatin. J Pharmacol Exp Ther. 2007;322(3):1221–1227. [DOI] [PubMed] [Google Scholar]
- 25. Abe K, Bridges AS, Brouwer KLR. Use of sandwich‐cultured human hepatocytes to predict biliary clearance of angiotensin II receptor blockers and HMG‐CoA reductase inhibitors. Drug Metab Dispos. 2009;37(3):447–452. [DOI] [PMC free article] [PubMed] [Google Scholar]
- 26. Bergman E, Forsell P, Tevell A, et al. Biliary secretion of rosuvastatin and bile acids in humans during the absorption phase. Eur J Pharm Sci. 2006;29(3–4):205–214. [DOI] [PubMed] [Google Scholar]
- 27. Igel M, Arnold KA, Niemi M, et al. Impact of the SLCO1B1 polymorphism on the pharmacokinetics and lipid‐lowering efficacy of multiple‐dose pravastatin. Clin Pharmacol Ther. 2006;79(5):419–426. [DOI] [PubMed] [Google Scholar]
- 28. Pasanen MK, Neuvonen PJ, Niemi M. Global analysis of genetic variation in SLCO1B1. Pharmacogenomics. 2008;9(1):19–33. [DOI] [PubMed] [Google Scholar]
- 29. Couvert P, Giral P, Dejager S, et al. Association between a frequent allele of the gene encoding OATP1B1 and enhanced LDL‐lowering response to fluvastatin therapy. Pharmacogenomics. 2008;9(9):1217–1227. [DOI] [PubMed] [Google Scholar]
- 30. Nies AT, Niemi M, Burk O, et al. Genetics is a major determinant of expression of the human hepatic uptake transporter OATP1B1, but not of OATP1B3 and OATP2B1. Genome Med. 2013;5(1):1. [DOI] [PMC free article] [PubMed] [Google Scholar]
- 31. Powell J, Farasyn T, Kock K, et al. Novel mechanism of impaired function of organic anion‐transporting polypeptide 1B3 in human hepatocytes: post‐translational regulation of OATP1B3 by protein kinase C activation. Drug Metab Dispos. 2014;42(11):1964–1970. [DOI] [PMC free article] [PubMed] [Google Scholar]
- 32. Hong M, Hong W, Ni C, Huang J, Zhou C. Protein kinase C affects the internalization and recycling of organic anion transporting polypeptide 1B1. Biochim Biophys Acta. 2015;1848(10 Pt A):2022–2030. [DOI] [PubMed] [Google Scholar]
- 33. de Graan AJ, Lancaster CS, Obaidat A, et al. Influence of polymorphic OATP1B‐type carriers on the disposition of docetaxel. Clin Cancer Res. 2012;18(16):4433–4440. [DOI] [PMC free article] [PubMed] [Google Scholar]
- 34. Jamei M, Bajot F, Neuhoff S, et al. A mechanistic framework for in vitro‐in vivo extrapolation of liver membrane transporters: prediction of drug‐drug interaction between rosuvastatin and cyclosporine. Clin Pharmacokinet. 2014;53(1):73–87. [DOI] [PMC free article] [PubMed] [Google Scholar]
- 35. Rodgers T, Rowland M. Mechanistic approaches to volume of distribution predictions: understanding the processes. Pharm Res. 2007;24(5):918–933. [DOI] [PubMed] [Google Scholar]
- 36. Neuhoff S, Lu G, Burt H, et al. Accounting for transporters in renal clearance: towards a mechanistic kidney model (Mech KiM). In: Sugiyama Y, Steffansen B, eds. Transporters in Drug Development: Discovery, Optimization, Clinical Study New York City, NY: Springer Science & Business Media; 2013:155–177.
- 37. Li J, Volpe DA, Wang Y, et al. Use of transporter knockdown caco‐2 cells to investigate the in vitro efflux of statin drugs. Drug Metab Dispos. 2011;39(7):1196–1202. [DOI] [PubMed] [Google Scholar]
- 38. Keskitalo JE, Kurkinen KJ, Neuvonen M, Backman JT, Neuvonen PJ, Niemi M. No significant effect of ABCB1 haplotypes on the pharmacokinetics of fluvastatin, pravastatin, lovastatin, and rosuvastatin. Br J Clin Pharmacol. 2009;68(2):207–213. [DOI] [PMC free article] [PubMed] [Google Scholar]
- 39. Keskitalo JE, Zolk O, Fromm MF, Kurkinen KJ, Neuvonen PJ, Niemi M. ABCG2 polymorphism markedly affects the pharmacokinetics of atorvastatin and rosuvastatin. Clin Pharmacol Ther. 2009;86(2):197–203. [DOI] [PubMed] [Google Scholar]
- 40. Briz O, Romero MR, Martinez‐Becerra P, et al. OATP8/1B3‐mediated cotransport of bile acids and glutathione: an export pathway for organic anions from hepatocytes? J Biol Chem. 2006;281(41):30326–30335. [DOI] [PubMed] [Google Scholar]
- 41. Kunze A, Huwyler J, Camenisch G, Poller B. Prediction of organic anion‐transporting polypeptide 1B1‐ and 1B3‐mediated hepatic uptake of statins based on transporter protein expression and activity data. Drug Metab Dispos. 2014;42(9):1514–1521. [DOI] [PubMed] [Google Scholar]
- 42. Michalski C, Cui Y, Nies AT, et al. A naturally occurring mutation in the SLC21A6 gene causing impaired membrane localization of the hepatocyte uptake transporter. J Biol Chem. 2002;277(45):43058–43063. [DOI] [PubMed] [Google Scholar]
- 43. Vildhede A, Karlgren M, Svedberg EK, et al. Hepatic uptake of atorvastatin: influence of variability in transporter expression on uptake clearance and drug‐drug interactions. Drug Metab Dispos. 2014;42(7):1210–1218. [DOI] [PubMed] [Google Scholar]
- 44. Cooper KJ, Martin PD, Dane AL, Warwick MJ, Schneck DW, Cantarini MV. Effect of itraconazole on the pharmacokinetics of rosuvastatin. Clin Pharmacol Ther. 2003;73(4):322–329. [DOI] [PubMed] [Google Scholar]
- 45. Cooper KJ, Martin PD, Dane AL, Warwick MJ, Schneck DW, Cantarini MV. The effect of fluconazole on the pharmacokinetics of rosuvastatin. Eur J Clin Pharmacol. 2002;58(8):527–531. [DOI] [PubMed] [Google Scholar]
- 46. Martin PD, Warwick MJ, Dane AL, Cantarini MV. A double‐blind, randomized, incomplete crossover trial to assess the dose proportionality of rosuvastatin in healthy volunteers. Clin Ther. 2003;25(8):2215–2224. [DOI] [PubMed] [Google Scholar]
- 47. Cooper KJ, Martin PD, Dane AL, Warwick MJ, Raza A, Schneck DW. The effect of erythromycin on the pharmacokinetics of rosuvastatin. Eur J Clin Pharmacol. 2003;59(1):51–56. [DOI] [PubMed] [Google Scholar]
- 48. Schneck DW, Birmingham BK, Zalikowski JA, et al. The effect of gemfibrozil on the pharmacokinetics of rosuvastatin. Clin Pharmacol Ther. 2004;75(5):455–463. [DOI] [PubMed] [Google Scholar]
- 49. Armitage PBG, Mattews JNS. Sample‐size determination In: Statistical Methods in Medical Research. 4th ed. Boston, MA: Blackwell Science; 2002:137–146. [Google Scholar]
- 50. Li J, Wang Y, Zhang W, Huang Y, Hein K, Hidalgo IJ. The role of a basolateral transporter in rosuvastatin transport and its interplay with apical breast cancer resistance protein in polarized cell monolayer systems. Drug Metab Dispos. 2012;40(11):2102–2108. [DOI] [PubMed] [Google Scholar]
- 51. Rose RH, Neuhoff S, Abduljalil K, Chetty M, Rostami‐Hodjegan A, Jamei M. Application of a physiologically based pharmacokinetic model to predict OATP1B1‐related variability in pharmacodynamics of rosuvastatin. CPT Pharmacometrics Syst Pharmacol. 2014;3:e124. [DOI] [PMC free article] [PubMed] [Google Scholar]
- 52. Dickinson GL, Lennard MS, Tucker GT, Rostami‐Hodjegan A. The use of mechanistic DM‐PK‐PD modelling to assess the power of pharmacogenetic studies—CYP2C9 and warfarin as an example. Br J Clin Pharmacol. 2007;64(1):14–26. [DOI] [PMC free article] [PubMed] [Google Scholar]
- 53. Jamei M, Dickinson GL, Rostami‐Hodjegan A. A framework for assessing inter‐individual variability in pharmacokinetics using virtual human populations and integrating general knowledge of physical chemistry, biology, anatomy, physiology and genetics: a tale of “bottom‐up” vs “top‐down” recognition of covariates. Drug Metab Pharmacokinet. 2009;24(1):53–75. [DOI] [PubMed] [Google Scholar]
- 54. Varma MV, Rotter CJ, Chupka J, et al. pH‐sensitive interaction of HMG‐CoA reductase inhibitors (statins) with organic anion transporting polypeptide 2B1. Mol Pharm. 2011;8(4):1303–1313. [DOI] [PubMed] [Google Scholar]
- 55. Emami Riedmaier A, Burt H, Gill K, Harwood M, Neuhoff S Abundance of hepatic transporters in Caucasians: a meta‐analysis. Paper presented at: 20th North American ISSX Meeting; October 18-22, 2015; Orlando, FL. [Google Scholar]
- 56. Tomita Y, Maeda K, Sugiyama Y. Ethnic variability in the plasma exposures of OATP1B1 substrates such as HMG‐CoA reductase inhibitors: a kinetic consideration of its mechanism. Clin Pharmacol Ther. 2013;94(1):37–51. [DOI] [PubMed] [Google Scholar]
- 57. Zhao P, Zhang L, Grillo JA, et al. Applications of physiologically based pharmacokinetic (PBPK) modeling and simulation during regulatory review. Clin Pharmacol Ther. 2011;89(2):259–267. [DOI] [PubMed] [Google Scholar]
- 58. Heikkinen AT, Lignet F, Cutler P, Parrott N. The role of quantitative ADME proteomics to support construction of physiologically based pharmacokinetic models for use in small molecule drug development. Proteomics Clin Appl. 2015;9(7–8):732–744. [DOI] [PubMed] [Google Scholar]
Associated Data
This section collects any data citations, data availability statements, or supplementary materials included in this article.
Supplementary Materials
Disclaimer: Supplementary materials have been peer‐reviewed but not copyedited.
Supplementary Material