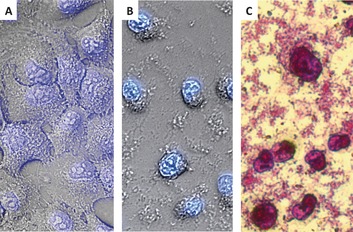
Figure 4.

Micrographs of A549 cells (40×). 4′,6‐Diamidino‐2‐phenylindole (DAPI) staining (of DNA) of A) untreated cells and B) cells treated with [3](PF6)2 (25 μm). C) Micrograph of cells after treatment with [3](PF6)2 (25 μm), fixation (trichloroacetic acid (TCA), 10 %), and SRB staining (to visualize proteins).
