

Abstract
Background:
Abnormalities in ureteric bud (UB) branching morphogenesis lead to congenital anomalies of the kidney and reduced nephron numbers associated with chronic kidney disease (CKD) and hypertension. Previous studies showed that the epithelial fibroblast growth factor receptor 2 (Fgfr2) IIIb splice variant supports ureteric morphogenesis in response to ligands from the metanephric mesenchyme during renal organogenesis. The epithelial‐specific splicing regulator Esrp1 is required for expression of Fgfr2‐IIIb and other epithelial‐specific splice variants. Our objective was to determine whether Esrp1 is required for normal kidney development.
Results:
Ablation of Esrp1 in mice, alone or together with its paralog Esrp2, was associated with reduced kidney size and increased incidence of renal aplasia. Three‐dimensional imaging showed that embryonic Esrp1 knockout (KO) kidneys had fewer ureteric tips and reduced nephron numbers. Analysis of alternative splicing in Esrp‐null ureteric epithelial cells by RNA‐Seq confirmed a splicing switch in Fgfr2 as well as numerous other transcripts.
Conclusions:
Our findings reveal that Esrp1‐regulated splicing in ureteric epithelial cells plays an important role in renal development. Defects in Esrp1 KO kidneys likely reflect reduced and/or absent ureteric branching, leading to decreased nephron induction secondary to incorrect Fgfr2 splicing and other splicing alterations. Developmental Dynamics 245:991–1000, 2016. © 2016 The Authors. Developmental Dynamics published by Wiley Periodicals, Inc. on behalf of American Association of Anatomists.
Keywords: alternative splicing, kidney development, fibroblast growth factor receptors, epithelial splicing regulatory proteins
Key findings
Abnormalities in Ureteric bud (UB) branching morphogenesis lead to congenital anomalies of the kidney and reduced nephron numbers associated with chronic kidney disease (CKD) and hypertension.
We investigated the consequences of ablating the epithelial‐specific splicing regulator Esrp1 on renal organogenesis and determined that Esrp1 KO mice have reduced kidney size, fewer ureteric tips, reduced nephron numbers, and increased incidence of renal aplasia.
Analysis of alternative splicing in Esrp null ureteric epithelial cells by RNA‐Seq identified numerous alterations in splicing.
These findings reveal that Esrp1 regulated splicing in ureteric epithelial cells plays an important role in the kidney and illustrate the importance of alternative splicing for normal renal organogenesis.
Introduction
Developmental abnormalities of the kidney underlie a diverse array of human diseases. Kidney formation begins with outgrowth of the ureteric bud (UB) from the nephric duct in response to signals from the adjacent metanephric mesenchyme (MM). Ongoing signals from the MM drive UB growth and branching to form the renal collecting system and ureter (Nigam and Shah, 2009; Costantini and Kopan, 2010; Little et al., 2010). Reciprocal signals from the UB branch tips to the MM induce a mesenchymal‐to‐epithelial transition (MET) that gives rise to the nephron epithelia from the glomerulus to the connecting tubules. Abnormalities in UB branching morphogenesis can lead to congenital anomalies of the kidney and urinary tract (CAKUT), which are among the most common human birth defects (Schedl, 2007; Little and McMahon, 2012). In addition, abnormal ureteric branching and reduced tip numbers result in decreased nephron numbers that confer a higher risk of developing hypertension and chronic kidney disease (CKD) (Clark and Bertram, 1999; Poladia et al., 2006).
Understanding the molecular mechanisms and the gene expression networks that guide renal development is critical ultimately to therapeutically impact many kidney diseases. Numerous congenital abnormalities and genetic diseases that cause renal failure are due to mutations in key developmental genes (Schedl, 2007; Costantini, 2010). In addition, both genetic and environmental factors such as prenatal stresses and premature birth can reduce UB branching and nephron endowment (Schedl, 2007; Dressler, 2009; Costantini and Kopan, 2010; Little et al., 2010). Genetic studies in mouse models have been invaluable in identifying and characterizing key transcriptional factors, cell surface receptors, and signaling pathways that guide UB branching morphogenesis and nephron formation. For example, outgrowth of the UB occurs when MM‐derived glial cell–derived neurotrophic factor (Gdnf) interacts with the Ret receptor tyrosine kinase (RTK) and the co‐receptor Grfα1, and knockout of any of these factors in mice leads to renal agenesis or aplasia (Schuchardt et al., 1994; Pichel et al., 1996; Sanchez et al., 1996; Treanor et al., 1996; Enomoto et al., 1998).
Many studies have identified gene expression patterns and transcriptional networks in the developing kidney that are mechanistically informative. (Brunskill et al., 2008; Mugford et al., 2009; Harding et al., 2011; Thiagarajan et al., 2011; Yu et al., 2012). However, the role that alternative splicing (AS) plays in the gene expression programs and regulatory networks that underlie kidney formation are largely unknown. Recent studies have shown that nearly all mammalian multi‐exon genes produce multiple alternatively spliced mRNAs (Pan et al., 2008; Wang et al., 2008). These alternatively spliced transcripts produce protein isoforms with widely divergent functions including changes in subcellular localization, protein‐protein interactions, and post‐translational modifications (Kelemen et al., 2013). Furthermore, many AS events are tightly regulated in a cell‐type or tissue‐specific manner and at different developmental stages by RNA‐binding proteins, including cell‐ or tissue‐specific splicing factors (Chen and Manley, 2009; Nilsen and Graveley, 2010; Kalsotra and Cooper, 2011).
While the impact of AS in kidney development is unclear, it is required for expression of the proper Fgfr2 isoform in the ureteric epithelium (Sawicka et al., 2008). Alternative splicing of mutually exclusive Fgfr2 exons IIIb and IIIc yields receptor isoforms Fgfr2‐IIIb and Fgfr2‐IIIc in epithelial and mesenchymal cells, respectively (Zhang et al., 2006). Moreover, Fgfr2‐IIIb and Fgfr2‐IIIc isoforms have differing ligand‐binding specificities that impact development of numerous organs (Min et al., 1998; Xu et al., 1998; Zhang et al., 2006). Previously, our group has shown that mesenchymal Fgfr2‐IIIc is critical for maintenance of the developing kidney MM (Sims‐Lucas et al., 2011). In addition, isoform‐specific knockout of Fgfr2‐IIIb as well as its specific ligands Fgf7 or Fgf10 leads to reduced kidney size, nephron number, and/or renal dysgenesis (Qiao et al., 1999; Ohuchi et al., 2000; Revest et al., 2001; Michos et al., 2010). Furthermore, we showed that Hoxb7cre‐mediated conditional deletion of Fgfr2 in the ureteric bud (where Fgfr2‐IIIb is the exclusive isoform) leads to defects in ureteric branching and secondarily to reduced nephrogenesis (Zhao et al., 2004; Sims‐Lucas et al., 2009). Others have shown mechanisms by which Fgf signaling can partially compensate for a loss of the Gdnf/Ret axis in some contexts. Deletion of the RTK inhibitor Sprouty1 (Spry1) led to rescue of UB branching and kidney formation in Gdnf or Ret knockout (KO) mice (Michos et al., 2010). However, in Gdnf −/−/Spry1−/− mice, deletion of one or both alleles of Fgf10 caused renal aplasia. Together these findings indicate there is a requirement for mesenchymal Fgf ligands signaling via Fgfr2‐IIIb in the ureteric bud for normal UB morphogenesis. It is unclear how improper splicing of Fgfr2 would affect ureteric and overall renal development.
We discovered epithelial cell‐type‐specific splicing factors Esrp1 and Esrp2 in a genome‐wide, cell‐based screen for regulators of Fgfr2 splicing (Warzecha et al., 2009). Combined knockdown of ESRP1 and ESRP2 in human epithelial cell lines induced a complete switch from FGFR2 exon IIIb to exon IIIc splicing. Conversely, ectopic expression of Esrp1 in a mesenchymal cell line induced a switch from FGFR2‐IIIc to FGFR2‐IIIb (Warzecha et al., 2009). Thus, Esrp1/Esrp2 is the master regulator that is necessary and sufficient for the expression of the Fgfr2‐IIIb splice variant in diverse epithelial cell types. We also found that depletion of ESRP1 and ESRP2 in epithelial cell lines induced changes in splicing of numerous other transcripts that were relevant to epithelial cell biology and polarity (Warzecha et al., 2010; Dittmar et al., 2012; Yang et al., 2016). These observations hinted at a broader developmental role for the Esrps in regulating epithelial cell morphogenesis during development.
To investigate the functions of Esrp1 and Esrp2 in mammalian development, we generated mice with KO alleles for Esrp1 and Esrp2 (Bebee et al., 2015). Whereas Esrp2 mice were viable, Esrp1 KO mice had 100% penetrant cleft lip associated with cleft palate (CL/P) and postnatal lethality, but no other obvious gross anatomic defects, nor reduced size or weight. In contrast, Esrp1/Esrp2 double KO (DKO) mice demonstrated a host of more severe developmental defects. In the present study, we conducted a detailed investigation into renal developmental defects associated with KO of Esrp1 alone, as well as Esrp1/Esrp2 DKO. We determined that Esrp1 ablation alone induced defects in UB branching, reduced kidney size, and increased incidence of renal aplasia, which partially recapitulates the renal defects deletion of Fgfr2 in UB (Sims‐Lucas et al., 2009). We also isolated ureteric epithelial cells from Esrp1/Esrp2 DKO kidneys and identified numerous splicing switches in Esrp‐ablated cells relative to controls. Thus, the defects in UB branching morphogenesis, and thus renal morphogenesis, likely result from aberrant alternative splicing in Fgfr2 and likely other genes in the ureteric epithelium.
Results
Esrp1 KO Mice Exhibit Renal Hypoplasia and an Increased Incidence of Renal Aplasia
Due to postnatal lethality and frequent maternal cannibalization of Esrp1 KO pups, we initially carried out more detailed analysis of E18.5 Esrp1 KO embryonic kidneys. Consistent with an absence of splicing alterations in mice with at least one intact Esrp1 allele (Bebee et al., 2015), we noted no apparent difference in the appearance or size of Esrp1 +/+ and Esrp1 +/‐ kidneys. However, Esrp1 ‐/‐ kidneys appeared smaller and had a ∼15% decrease in mean kidney cross‐sectional area relative to control littermate kidneys (KO 4.35 ± 0.38 mm2, controls 3.71 ± 0.40 mm2, p < 0.0001; Fig. 1; as previously noted, Esrp1‐/‐ E18.5 embryos were not different from littermates based on weight and crown‐to‐rump length). H & E staining of tissue cross‐sections did not reveal any obvious differences in tubular epithelial cell or glomerular morphology in E18.5 mutants vs. controls (Fig. 2), consistent with renal hypoplasia in the mutants. We also assessed whether there were any redundant actions of Esrp2 with Esrp1 on kidney development by examining compound mutants. As previously reported, Esrp1‐/‐;Esrp2+/‐ and Esrp1‐/‐;Esrp2‐/‐ embryos and pups exhibited several significant non‐renal abnormalities, and Esrp1/Esrp2 DKO pups were ∼30% reduced in total size and weight (Bebee et al., 2015). However, we did not note a further apparent reduction in E18.5 kidney size when comparing Esrp1‐/‐;Esrp2+/+ mice to Esrp1 ‐/‐ mice that had a heterozygous or null allele for Esrp2. Interestingly, as we generated large numbers of mutants, we noted that a significant number of mice with Esrp1 ‐/‐ genotypes had unilateral renal aplasia, whereas all mice with at least one wild‐type (WT) Esrp1 allele had two kidneys, independent of the Esrp2 allele (Table 1). In addition, we identified one Esrp1‐/‐; Esrp2‐/‐ embryo in which both kidneys were missing. Thus, Esrp1 actions appear most critical in guiding normal kidney development without apparent redundant actions of Esrp2. The reduced kidney sizes and partially penetrant renal aplasia in Esrp1‐null mutants strongly suggest that alterations in the expression or splicing of Esrp1‐regulated targets lead to these kidney defects.
Figure 1.
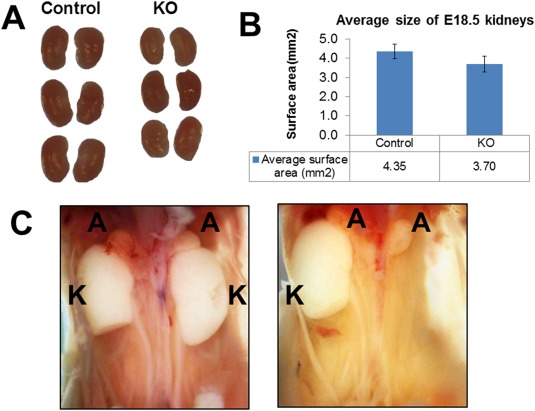
Esrp1 KO mice have reduced kidney size compared to control littermates. A: Representative images of E18.5 kidneys from Control (Esrp1 +/+ and Esrp1 +/‐; N=22) and Esrp1 KO (Esrp1‐/‐; N=12) mice. B: Graphical representation of average cross‐sectional area is shown (p‐value for difference in size = 0.00007 by two‐tailed t‐test). C: Example of unilateral renal agenesis in an Esrp1‐/‐;Esrp2+/‐ E18.5 embryo (right) compared to a littermate control with both kidneys (left). A, adrenal glands; K, kidney; U, ureter.
Figure 2.
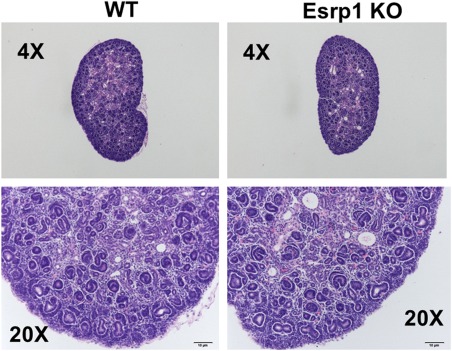
Representative H & E stained sections from wild‐type (WT) control (left panels) and Esrp1 KO kidneys (right panels) showing no apparent abnormalities in developing glomeruli or tubular structures in Esrp1 KO kidneys.
Table 1.
Frequency of Renal Agenesis in Esrp1 KO E18.5 Embryos
| Genotype | 0 kidneys | 1 kidney | 2 kidneys | Frequency of renal agenesis |
|---|---|---|---|---|
| Controls (at least on intact Esrp1 allele) | 0 | 0 | 377 | 0/377 (0%) |
| Esrp1‐/‐;Esrp2+/+ | 0 | 8 | 38 | 8/46 (17.4%) |
| Esrp1‐/‐;Esrp2+/‐ | 0 | 4 | 14 | 4/18 (22.2%) |
| Esrp1‐/‐;Esrp2‐/‐ | 1 | 8 | 59 | 9/68 (12.5%) |
Ablation of Esrp1 Results in Ureteric Branching Defects, Reduced Ureteric Tips, and Reduced Nephron Formation
To further characterize ureteric and possible secondary nephrogenesis defects in Esrp1‐null kidneys, we performed three‐dimensional (3‐D) reconstruction of serially sectioned E13.5 embryos to investigate branching and nephron formation in both Esrp1 KO and Esrp1/Esrp2 DKO kidneys. For this analysis, we compared four Esrp1‐/‐:Esrp2+/+ (Esrp1 KO) kidneys to four WT Esrp1+/+;Esrp2+/+ control kidneys, and four Esrp1‐/‐:Esrp2‐/‐ (Esrp1/Esrp2 DKO) kidneys to four Esrp1+/+;Esrp2‐/‐ control kidneys. Consistent with the analysis of E18.5 kidneys, the 3‐D reconstruction showed reduced kidney surface area by ∼25% in both Esrp1 KO and Esrp1/Esrp2 DKO kidneys relative to the respective controls (Fig. 3 and Table 2). In assessing ureteric volumes, we detected a trend for a reduction in mean Esrp1 ‐/‐ ureteric volume and a significant reduction in mean Esrp1‐/‐;Esrp2‐/‐ ureteric volume vs. littermate controls (Table 2). Moreover, relative mean ureteric volume (normalized to kidney size) and absolute mean ureteric surface area were reduced in both Esrp1 ‐/‐ and Esrp1‐/‐;Esrp2‐/‐ kidneys vs. littermate controls. We then skeletonized the ureteric trees and noted statistically significant decreases in mean ureteric branch and tip numbers (∼55%–60%) in both KO and DKO kidneys relative to controls. The 3‐D analysis also revealed significant reductions in Esrp1 KO and Esrp1;Esrp2 DKO mean developing nephron structures relative to controls that were similar to the reduced tip numbers (meaning that the nephron number loss was likely due to fewer ureteric tips inducing nephron development). Thus, these findings strongly suggested that there is a defect in developing kidneys that primarily reflects transcriptomic alterations in the ureteric lineage that leads to reduced kidney size and nephron endowment. Taken together with the increased incidence of renal aplasia in Esrp1‐null mice, these findings suggest that Esrp1 is critical for Fgfr2 splicing in the ureteric epithelium to maintain ureteric epithelial architecture.
Figure 3.
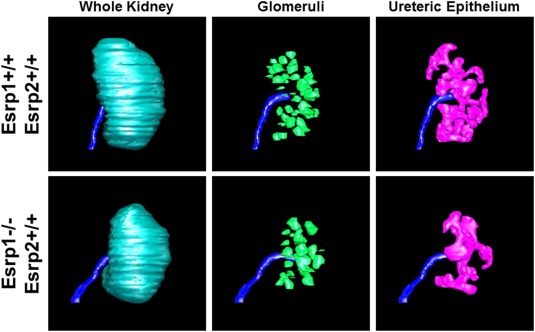
Representative 3‐D images showing reduced ureteric volume (pink) and fewer nephrons (green) in E13.5 Esrp1 KO kidneys compared to littermate controls.
Table 2.
Ureteric and Nephron Measurements in Esrp KO and Control Kidneys
| Measurement | Esrp1+/+; Esrp2+/+ (control) | Esrp1‐/‐; Esrp2+/+ | % of controls | p‐value | Esrp1+/+; Esrp2‐/‐ (control) | Esrp1‐/‐; Esrp2‐/‐ | % of controls | p‐value |
|---|---|---|---|---|---|---|---|---|
| Kidney surface area (× 105 μm2) | 6.07 ± 0.88 | 4.60 ± 0.81 | 76% | 0.0498 | 5.96 ± 0.91 | 4.66 ± 0.45 | 78% | 0.0426 |
| Ureteric epithelium (UE) Volume (× 106 μm3) | 5.58 ± 1.63 | 3.35 ± 1.02 | 60% | 0.0606 | 5.58 ± 1.06 | 3.21 ± 0.54 | 58% | 0.0072 |
| UE % of kidney (%) | 12.0 ± 0.8 | 10.2 ± 0.6 | 85% | 0.0090 | 12.3 ± 0.4 | 9.6 ± 0.3 | 78% | 0.0001 |
| UE surface area (× 105 μm2) | 4.86 ± 1.24 | 2.92 ± 0.79 | 60% | 0.0391 | 4.70 ± 1.00 | 2.71 ± 0.50 | 58% | 0.0117 |
| Dev. glomeruli volume (× 106 μm3) | 3.54 ± 1.08 | 2.55 ± 0.78 | 72% | 0.1864 | 3.24 ± 1.15 | 2.24 ± 0.60 | 69% | 0.1742 |
| Dev. glomeruli avg size (× 104 μm3) | 7.04 ± 1.63 | 7.36 ± 1.23 | 104% | 0.7704 | 6.71 ± 1.04 | 7.59 ± 1.23 | 113% | 0.3160 |
| Dev. glomeruli number | 49.75 ± 7.13 | 34.25 ± 7.27 | 69% | 0.0227 | 47.25 ± 9.88 | 29.50 ± 5.91 | 62% | 0.0216 |
| Dev glomeruli % of kidney (%) | 7.6 ± 1.0 | 7.8 ± 0.9 | 102% | 0.8239 | 7.0 ± 1.2 | 6.7 ± 1.11 | 96% | 0.7104 |
| Branch number | 69 ± 19.77 | 41 ± 0.81 | 59% | 0.0478 | 85 ± 19.77 | 48 ± 15.06 | 56% | 0.0130 |
| Tip number | 70 ± 18.35 | 43 ± 10.56 | 61% | 0.0421 | 87 ± 13.67 | 50 ± 13.11 | 58% | 0.0082 |
| Branch length (μm) | 7030.42 ± 1971.11 | 4305.75 ± 1211.58 | 61% | 0.0567 | 7756.82 ± 1435.70 | 4530.26 ± 1332.36 | 58% | 0.0165 |
Identification of Esrp1‐regulated Splicing in Ureteric Epithelial Cells
While previous studies indicate that there is also Esrp1 expression in distal nephron epithelial cells in addition to ureteric expression (Yu et al., 2012), the phenotypic assessments of the mutants suggest that the primary developmental defects are in ureteric morphogenesis. We note, however, that we cannot rule out defects in Esrp1‐null distal nephron segments that were not identified by standard H & E staining. To further investigate potential molecular mechanisms that give rise to the defects in ureteric branching, we investigated changes in AS in Esrp‐null kidneys using RNA‐Seq of ureteric epithelial cells isolated by fluorescence‐activated cell sorting (FACS). Studies from our group and others have noted that RNA‐Seq is associated with significant false negatives when used for detection of changes in alternative splicing. Thus, although we noted kidney defects in Esrp1 KO as well as Esrp1/Esrp2 DKO kidneys, we used Esrp1/Esrp2 DKO embryos for splicing analysis in order to optimize detection of Esrp‐regulated splicing. Using Dolichos biflorus agglutinin coupled with Fluorescein isothiocyanate (DBA‐FITC) to label ureteric cells, we sorted DBA‐positive ureteric epithelial cells from two biological replicates each for Esrp1‐/‐;Esrp2‐/‐ and control Esrp1+/+;Esrp2‐/‐ E18.5 kidneys. To identify differential AS events between control and DKO samples, we used the replicate Multivariate Analysis of Transcript Splicing (rMATS) computational tool to identify differential AS events from strand‐specific RNA‐Seq data corresponding to all five basic types of AS patterns (Shen et al., 2014). For each AS event, we used both the reads mapped to the splice junctions and the reads mapped to the exon body as the input for rMATS. Differentially spliced events with an associated change in Percent Spliced In (ΔPSI or ΔΨ) of ≥ 5% and a false discovery rate of < 5% are summarized in Table S1. Of note, we identified 39 cassette exons (also called SE, for skipped exons) that underwent a change in splicing using our statistical cutoffs, seven mutually exclusive events (MXE), and two alternative 5' splice sites (A5SS). Not surprisingly, a switch in Fgfr2 splicing was associated with the largest change in splicing of mutually exclusive exons, and this was confirmed by reverse transcription‐polymerase chain reaction (RT‐PCR) (Fig. 4A). Among the SE events, we noted several splicing changes that previously had been identified in Esrp1/Esrp2 DKO epidermis and/or Esrp‐depleted epithelial cell lines such as p120‐catenin (Ctnnd1), Cd44, Scrib, and Arhgap17. However, we also identified splicing switches that were not previously defined in Esrp‐depleted non‐ureteric epithelial cells. We used semi‐quantitative RT‐PCR to validate several additional splicing switches predicted by RNA‐Seq, as well as two additional Esrp targets (Enah and Macf1) identified in our previous studies (Fig. 4B). We confirmed splicing switches in 11 of 15 SE events tested, for which RT‐PCR was successful. We did, however, note that several of the splicing switches that included previously identified Esrp‐regulated targets were quantitatively less than observed in other contexts, which we suspect is to some degree of mesenchymal or stromal cell contamination using the DBA lectin–based sorting approach. For example, even for Fgfr2, the control pattern showed ∼20% of transcripts with the mesenchymal Fgfr2‐IIIc splice variant, consistent with baseline splicing patterns in control cells that are less epithelial than in other homogenous populations of epithelial cells previously analyzed. We thus suspect that some component of a non‐epithelial cell population was one limitation in identifying an even broader number of Esrp‐regulated targets in UB cells. In addition, the limited number of splicing changes we observed in Esrp1;Esrp2 DKO DBA‐sorted cells reflects the limited sequencing depth obtained from the limited cell populations isolated, which is a known shortcoming of RNA‐Seq for detection of changes in alternative splicing. Nonetheless, a Gene Ontology (GO) analysis for biological processes yields enrichment of Esrp‐regulated targets for terms relevant to UB and branching morphogenesis (Fig. 4C). For example, the top three enriched terms were gland morphogenesis, organ morphogenesis, and organ development. Ureteric bud development was also among the enriched terms, based upon changes in splicing of Fgfr2, Fgfr1, and CD44. In future studies it will be useful to incorporate fluorescent reporter lines and larger numbers of replicates and expanded sequencing depth to identify an even more comprehensive set of regulated targets in the kidney, including renal tubular epithelial cells.
Figure 4.
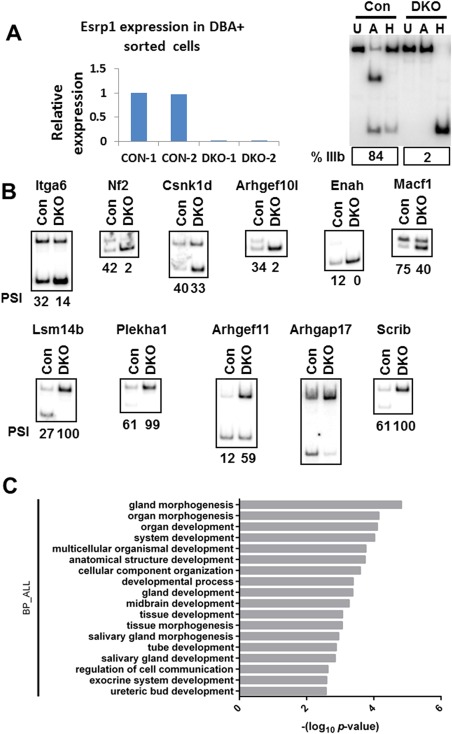
Validations of splicing changes in DBA + ureteric epithelial cells in Esrp1‐/‐;Esrp2‐/‐ DKO embryos compared to Esrp1+/+;Esrp2‐/‐ control littermates by semi‐quantitative RT‐PCR. A: At left is gPCR data confirming Esrp1 ablation in two Esrp1 KO sample replicates compared to control replicates. At right is validation of a nearly complete switch in Fgfr2 splicing from exon IIIb to IIIc. Note that RT‐PCR products containing exon IIIb contain a restriction site for AvaI (A), whereas those with exon IIIc have 2 HincII (H) sites that were used in restriction digests to distinguish these products. Lanes labelled U represent uncut RT‐PCR products. Quantification of exon IIIb splicing is indicated. B: Additional examples of validated alternative splicing switches. The quantifications for Percent Spliced In (PSI) are shown for each condition. Values for mean PSI from both replicates are shown in a tab in Table S1. C: GO analysis of enriched categories for genes with alternative splicing switches in DKO ureteric epithelium. Con, control; DKO, Esrp1;Esrp2 double knockout.
We also determined changes in total transcript using the FPKM metric (fragments per kilobase of exon per million fragments mapped) and identified 436 transcripts with at least a two‐fold change in gene expression between the DKO and control samples at FDR < 5% for transcripts with a minimum FPKM > 0.1 (Table S2). Interestingly, GO analysis for genes with altered expression in Esrp KO ureteric epithelium showed a high enrichment for genes involved in immune response or inflammation, including numerous genes encoding chemokines, complement components, and toll‐like receptors. Determining whether these changes in gene expression represent direct regulation of transcript stability or indirect effects requires further investigation. We note that Esrp ablation in the skin induces large‐scale changes in gene expression that we suspect are indirect due to a defect in barrier function of the epidermis. It is thus possible that some of these changes in the UB may indicate alterations in inflammatory responses, though the mechanisms for such a response are not clear. On the other hand, a previous study noted conserved Esrp1/2 binding sites in 3' untranslated regions, suggesting that Esrp1 may also regulate post‐transcriptional gene expression at the level of stability as well as splicing. Recent studies of numerous other RNA binding proteins support such multifunctional roles in post‐transcriptional regulation for an increasing number of genes (Sawicka et al., 2008).
Discussion
This study presents a detailed view of defects in kidney development that result from ablation of the epithelial‐specific splicing factor Esrp1 and represents the first investigation of an essential splicing factor on renal organogenesis. We determined that disruption of an Esrp1‐directed epithelial splicing program is associated with several abnormalities in renal organogenesis that likely have relevance to human congenital kidney diseases that result in childhood or adult‐onset CKD and/or hypertension. First, we discovered a significantly increased risk of unilateral (and rarely bilateral) renal aplasia in many Esrp1‐null mice. Second, we noted that those E18.5 kidneys that did form in Esrp1‐null mice were hypoplastic relative to control kidneys, suggesting reduced ureteric branching and a reduced nephron mass. Third, detailed 3‐D imaging of E13.5 kidneys revealed abnormal and reduced ureteric branching and tip formation that was associated with a corresponding decrease in nephron number. Fourth, we determined that there were few, if any, redundant roles for Esrp2 with Esrp1 in ureteric morphogenesis.
The abnormalities we observed are most likely due to alterations in splicing of key Esrp target transcripts, whose functions in kidney development and other epithelial cell processes are fine‐tuned through the expression of epithelial‐specific protein isoforms, or alterations in isoform ratios. It is important to note that it is now recognized that AS events are often tightly regulated in a cell‐type or tissue‐specific manner, and at different developmental stages (Chen and Manley, 2009; Nilsen and Graveley, 2010). An emerging concept in the AS field is that, similar to transcriptional regulators, tissue‐specific splicing regulators coordinate programs of AS involving transcripts that encode proteins that function in biologically coherent pathways (Ule et al., 2005; Karni et al., 2007; Zhang et al., 2008). Thus, the definition of programs of alternative splicing directed by cell‐type‐specific splicing factors will reveal novel genes that are important for the development and functions of the specific cell types or tissues in which they are expressed. By extension, disruption of the function of these splicing factors, as well as their regulation target genes, can also result in disease. The GO analysis presented here using an Esrp‐regulated AS program in the UB is consistent with this proposition, as it consisted of a number of regulated gene transcripts known to be important for organ development, including the kidney. For example, one Esrp‐regulated target is CD44, which was previously shown to play a role in in branching morphogenesis of ureteric bud cells (Pohl et al., 2000). This example, together with Fgfr2, suggests that coordinated functions of other Esrp‐regulated genes may collectively contribute to kidney formation, and that disruption in the expression or splicing of other target genes may also be involved in kidney disease. We thus propose that some of the genes we identify here whose splicing is regulated by the Esrps in the UB may also have yet to be defined roles in kidney development, possibly through regulation of epithelial‐mesenchymal cross talk or branching morphogenesis. In addition, some of these genes may also be modifier genes associated with increased risk of renal congenital anomalies as well as chronic kidney disease. A more extensive characterization of AS in the different segments of the developing kidney, as well a more comprehensive determination of Esrp‐regulated targets in the UB and other renal epithelial cells, is expected to provide further insights into normal programs of kidney development.
While the functional consequences of the change in Fgfr2 splicing have been well characterized at the cellular level, the differential functions of most protein isoforms that result from alternative splicing of Esrp‐regulated gene transcripts remain undefined. It therefore is a challenge to dissect how alterations in splicing of defined transcripts contribute to the kidney phenotypes described here, as well as those in other organs and tissues impacted by Esrp1 or Esrp1/Esrp2 ablation. Nonetheless, we suspect that the loss of the epithelial Fgfr2‐IIIb isoform in ureteric epithelial cells is one of likely many key splicing changes that contribute to these phenotypes. Previous studies, for example, showed reduced kidney size in mice with isoform‐specific KO of the Fgfr2‐IIIb isoform as well as its specific ligands Fgf7 or Fgf10 (Qiao et al., 1999; De Moerlooze et al., 2000; Ohuchi et al., 2000; Michos et al., 2010). We also previously showed that conditional deletion of Fgfr2 in the ureteric bud lineage was also associated with branching defects, reduced kidney size, and reduced ureteric tips and nephrons (Zhao et al., 2004; Sims‐Lucas et al., 2009). As previously noted, it has also been shown that in certain genetic contexts, Fgf10 signaling through Fgfr2‐IIIb in ureteric epithelium can compensate for impaired Gdnf/Ret signaling in renal organogenesis (Michos et al., 2010).
While the effects of Esrp loss on Fgfr2 splicing likely account for much of the ureteric and renal defects in the mutants, there are some phenotypic differences between Esrp mutants and Fgfr2 mutants. First, unlike in the Esrp1 mutants, we did not routinely observe renal aplasia (suggesting ureteric induction defects). Second, the glomeruli in Fgfr2UB‐/‐ kidneys are increased in size, whereas they are unchanged in size in Esrp1 ‐/‐ kidneys. One reason for the differences in the phenotypes is likely a key functional distinction between the Hoxb7cre deletion of Fgfr2 or the global Fgfr2 exon IIIb mutants and the Fgfr2 splice variants that result from isoform‐specific deletion of exon IIIb of Fgfr2 and Esrp ablation in our Esrp KO mice. Although deletion of exon IIIb preserves expression of Fgfr2‐IIIc in mesenchymal tissues, in epithelial cells the consequence of exon IIIb deletion is not splicing to the mutually exclusive exon IIIc, but rather the skipping of both exons. This results in a frameshift into a stop codon in the next exon; hence, the result is effectively a complete ablation of Fgfr2 expression altogether in epithelial cell types, similar to the Hoxb7cre‐mediated deletion of Fgfr2. In contrast, KO of Esrp1/2 in epithelial cells induces a complete switch in splicing from exon IIIb to exon IIIc, resulting in ectopic expression of the normally mesenchymal Fgfr2‐IIIc isoform in epithelial cells. Therefore, while Fgfr2 in the ureteric bud and derivatives in Esrp KO mice can no longer respond to mesenchyme‐ or stromal‐derived Fgf7 or Fgf10, it can still signal in response to other Fgfs with known specificity for Fgfr2‐IIIc. Such Fgfs include Fgf9, which is expressed from the ureteric tips themselves, as well as other Fgfr2‐IIIc‐specific Fgf ligands expressed in the milieu such as Fgf8 and Fgf20 (Barak et al., 2012). Hence, it is possible that such autocrine or paracrine pathways could preserve some Fgfr2 signaling in the ureteric bud as opposed to those that effectively ablate Fgfr2 expression in the ureteric epithelium or its natural Fgf ligands. In addition, we have previously shown that ablation or depletion of Esrp1 alone (with intact Esrp2 alleles) does not induce a complete switch in Fgfr2 splicing from exon IIIb to exon IIIc, such that there is likely some Fgfr2‐IIIb in the ureteric cells of Esrp1 KO mice that would also be expected to preserve some Fgf7/Fgf10 responsive signaling. Finally, the high incidence of renal aplasia, which we have not observed in our Hoxb7cre;Fgfr2 Fl/Fl mutants, strongly suggests that perturbations in other Esrp targets underpin some of the phenotypes seen in our Esrp mutants.
In conclusion, this study describes the role of a key splicing factor in kidney development. Further investigations into the functions of alternative splicing events regulated by the Esrps may provide further insights into the pathways and signaling programs that underlie epithelial‐mesenchymal cross talk and branching morphogenesis. These investigations begin to extend our understanding of the gene‐expression programs that affect ureteric branching and nephron formation beyond transcriptional regulation. Further studies into the functional consequences of splicing switches in some of these target genes will provide further insights into the pathways and cell‐cell interactions that are required for UB branching. It will also be of interest to use conditional KO of Esrp1/Esrp2 to further investigate the consequences of Esrp ablation in ureteric and renal tubular epithelial cells for kidney function in adult mice.
Experimental Procedures
Mouse Crosses
Esrp1 KO (Esrp1‐/‐;Esrp2+/+) embryos were generated in crosses of Esrp1+/‐, Esrp2+/+ mice and Esrp1/Esrp2 DKO (Esrp1‐/‐;Esrp2‐/‐) embryos from crosses of Esrp1+/‐, Esrp2‐/‐ mice. Genotyping for Esrp1 and Esrp2 was performed as described (Bebee et al., 2015). Pregnant dames were euthanized by carbon dioxide, and embryos were isolated and euthanized by decapitation. All animal procedures and experiments were approved by the Institutional Animal Care and Use Committee (IACUC) at the University of Pennsylvania.
Histologic Analysis
Kidneys were isolated from E18.5 embryos. Images of E18.5 kidneys were taken using a dissecting microscope (0.8x) along with reference scale ruler. Kidney sizes were measured using Photoshop to measure to cross‐sectional area of the kidneys. E18.5 kidneys for histological analysis were fixed in 4% paraformaldehyde overnight at 4 ºC, followed by PBS washes and transfer to 70% ethanol for processing and paraffin embedding. H & E stains were performed for gross histological analysis. Imaging of sections was performed using an Olympus BX43 microscope and cellSens software. Whole‐mount in situ hybridization (ISH) using Digoxigenin UTP‐labeled antisense RNA probes against Ret was performed on E18.5 Esrp1 KO and control dissected kidneys as described previously (Hains et al., 2008).
3‐dimensional Reconstructions of Kidneys
E13.5 embryos were collected for 3‐D reconstructions of Esrp1 KO and Esrp1;Esrp2 DKO kidneys and the respective littermate controls (i.e., Esrp1+/+, Esrp2+/ + mice were used as controls for KO embryos, and Esrp1+/+, Esrp2‐/‐ embryos were controls for DKO embryos). Four embryos for each genetic group were evaluated. Embryos were euthanized by decapitation, fixed in 4% paraformaldehyde on ice, and shipped overnight to the Bates laboratory for 3‐D reconstruction as described (Sims‐Lucas et al., 2009).
Isolation of DBA Lectin–positive Ureteric Epithelium
Ureteric epithelium (UE) from E18.5 control (Esrp1+/+;Esrp2‐/‐) and DKO (Esrp1‐/‐;Esrp2‐/‐) embryos was isolated from E18.5 embryos using FITC‐DBA lectin and FACS. E18.5 embryonic kidney pairs isolated from individual embryos were placed in PBS on ice, then transferred into 500 μl of 0.03% collagenase (Sigma, Cat#C1889) in PBS for 10 minutes at 37 ºC. Samples were transferred to ice, and the kidneys were dissociated by trituration using an 18‐gauge needle with 8–10 passes, followed by a 25‐gauge needle for 8–10 passes to homogenize to a single‐cell slurry. Cells were transferred to a 15‐ml falcon tube containing 4–5 ml 2% fetal bovine serum (FBS) in PBS to inhibit collagenase. The cells were pelleted for five minutes at 400 x g (4 ºC) and washed three times in 5 ml of 2% FBS. The final cell pellet was resuspended in 60 μl of 2% FBS in PBS and transferred to an Eppendorf tube. Cell count and viability were measured using 5 μl of cells + 5 μl trypan blue and a Hemocytometer; 5 μl of the remaining cell volume from each sample was pooled to serve as an unstained control. The remaining 50 μl was processed for labeling with FITC‐DBA lectin. The cells were pelleted at 400 x g for five minutes and stained in a fresh 50 μl of staining solution on ice and in the dark with DBA‐FITC (Vector Labs, Cat#FL‐1031) 1:10 diluted in 2% FBS in PBS for 20 minutes. The cells were washed in 1 ml of 2% FBS in PBS and centrifuged at 400 x g (4 ºC) for five minutes. The cell pellet was resuspended in 300–400 μl of 2% FBS in PBS for FACS. GFP‐positive gated cells were isolated using the unstained cells as a negative control. GFP + cells were collected directly into 500 μl of TRIzol (ThermoFisher) and snap‐frozen on dry ice and stored at ‐80 ºC.
RNA Sequencing and Data Analysis
Total RNA from FACS‐sorted DBA + from control E18.5 control and DKO UE in TRIzol was isolated according to the manufacturer's protocol and resuspended in 10mM Tris‐Cl pH 8.0. Each biological replicate (n = 2 per genetic group) was comprised of three separate, individual embryos isolations. Each pooled biological replicate was made using 66.6 ng of total RNA, for a total of 200 ng. The pooled 200‐ng samples were used for poly A selected RNA‐Seq library preparation using the NEBNext® Ultra™ Directional RNA Library Prep Kit for Illumina® (mRNA) (New England Biolabs) [products: NEBNext® Poly(A) mRNA Magnetic Isolation Module (E7490S) and NEBNext® Ultra™ Directional RNA Library Prep Kit for Illumina® (E7420S)]. Biological replicates (n = 2 per genetic group) were individually bar‐coded, pooled, and sequenced in a single lane of a HiSeq 2000 for 100 × 2 bp paired‐end RNA‐Seq at the Penn Next Generation Sequencing Core (NGSC) Facility. RNA‐Seq reads were mapped to the mouse genome (mm10) and a data set of all possible exon‐exon junction reads as previously described (Bebee et al., 2015). The RNA‐Seq data has been deposited into the NCBI Gene Expression Omnibus (GEO) under the accession number GSE81716. RNA‐Seq reads were mapped to the mouse genome (mm10) and transcriptome (Ensembl, release 72) as previously described (Bebee et al., 2015). Differences in gene expression were determined using the FPKM metric at FDR < 5%, > two‐fold difference in gene expression based on average FPKM, and minFPKM > 0.1. To identify differential AS events between the control and DKO samples, we used rMATS to identify differential AS events from strand‐specific RNA‐Seq data corresponding to all five basic types of AS patterns as previously described (Shen et al., 2014; Bebee et al., 2015). AS events with an associated change in Percent Spliced In (ΔPSI or ΔΨ) of these events were identified at an FDR < 5% and |ΔΨ| ≥ 5%.
RT‐PCR and Real‐time RT‐PCR
For synthesis of cDNA, 100 ng of pooled total RNA representing each biological replicate used in the RNA‐Seq experiment was used for random hexamer‐primed M‐MLV reverse transcriptase (Promega). Real‐time analysis of Esrp expression was evaluated using TaqMan probes for Esrp1 (Mm01220936_g1) and Gapdh (Mm99999915_g1) (LifeTechnologies) using a 7500 Fast Real‐Time machine (AppliedBiosystems). Semi‐quantitative radioactive RT‐PCR products were separated on 5% PAGE gels, dried and exposed on phosphorscreens, scanned on a Typhoon FLA 9500, and quantified using ImageQuant TL, version 7.0. Splicing ratios are represented as Percent Spliced In (PSI) of the alternative exon for cassette exons, and were normalized to RT‐PCR product sizes. The mean inclusion levels of the indicated exons for all validated splicing events are indicated in a summary table of Esrp‐regulated splicing events represented as mean values derived from each KO and control replicate (see tab in Table S1). Quantification of exon IIIb and IIIc for Fgfr1 and Fgfr2 required restriction enzyme specific to discriminate the two isoforms. Fgfr2 PCR products were digested with AvaI (IIIb) or HincII (IIIc). Fgfr1 products were digested with BstXI (IIIb) and HincII (IIIc) (all restriction digestions were performed according to NEB guidelines at 5U/digestion). Primer sequences are available on request. Graphical representation of PSI for IIIb inclusion was calculated as the ratio of IIIb/(IIIb + IIIc).
Supporting information
Additional supporting information may be found in the online version of this article.
Supporting Information Table S1
Supporting Information Table S2
Acknowledgments
We thank Katherine Sheridan and Natalie Burrill for assistance with the mouse work and general assistance. We also thank members of the Penn Flow Cytometry and Next Generation Sequencing Core Facilities.
Contributor Information
Carlton M. Bates, Email: russcars@upenn.edu
Russ P. Carstens, Email: batescm@upmc.edu
References
- Barak H, Huh SH, Chen S, Jeanpierre C, Martinovic J, Parisot M, Bole‐Feysot C, Nitschke P, Salomon R, Antignac C, Ornitz DM, Kopan R. 2012. FGF9 and FGF20 maintain the stemness of nephron progenitors in mice and man. Dev Cell 22:1191–1207. [DOI] [PMC free article] [PubMed] [Google Scholar]
- Bebee TW, Park JW, Sheridan KI, Warzecha CC, Cieply BW, Rohacek AM, Xing Y, Carstens RP. 2015. The splicing regulators Esrp1 and Esrp2 direct an epithelial splicing program essential for mammalian development. Elife 4. [DOI] [PMC free article] [PubMed] [Google Scholar]
- Brunskill EW, Aronow BJ, Georgas K, Rumballe B, Valerius MT, Aronow J, Kaimal V, Jegga AG, Yu J, Grimmond S, McMahon AP, Patterson LT, Little MH, Potter SS. 2008. Atlas of gene expression in the developing kidney at microanatomic resolution. Dev Cell 15:781–791. [DOI] [PMC free article] [PubMed] [Google Scholar]
- Chen M, Manley JL. 2009. Mechanisms of alternative splicing regulation: insights from molecular and genomics approaches. Nat Rev Mol Cell Biol 10:741–754. [DOI] [PMC free article] [PubMed] [Google Scholar]
- Clark AT, Bertram JF. 1999. Molecular regulation of nephron endowment. Am J Physiol 276:F485–497. [DOI] [PubMed] [Google Scholar]
- Costantini F. 2010. GDNF/Ret signaling and renal branching morphogenesis: From mesenchymal signals to epithelial cell behaviors. Organogenesis 6:252–262. [DOI] [PMC free article] [PubMed] [Google Scholar]
- Costantini F, Kopan R. 2010. Patterning a complex organ: branching morphogenesis and nephron segmentation in kidney development. Dev Cell 18:698–712. [DOI] [PMC free article] [PubMed] [Google Scholar]
- De Moerlooze L, Spencer‐Dene B, Revest J, Hajihosseini M, Rosewell I, Dickson C. 2000. An important role for the IIIb isoform of fibroblast growth factor receptor 2 (FGFR2) in mesenchymal‐epithelial signalling during mouse organogenesis. Development 127:483–492. [DOI] [PubMed] [Google Scholar]
- Dittmar KA, Jiang P, Park JW, Amirikian K, Wan J, Shen S, Xing Y, Carstens RP. 2012. Genome‐Wide Determination of a Broad ESRP‐Regulated Posttranscriptional Network by High‐Throughput Sequencing. Mol Cell Biol 32:1468–1482. [DOI] [PMC free article] [PubMed] [Google Scholar]
- Dressler GR. 2009. Advances in early kidney specification, development and patterning. Development 136:3863–3874. [DOI] [PMC free article] [PubMed] [Google Scholar]
- Enomoto H, Araki T, Jackman A, Heuckeroth RO, Snider WD, Johnson EM Jr, Milbrandt J. 1998. GFR alpha1‐deficient mice have deficits in the enteric nervous system and kidneys. Neuron 21:317–324. [DOI] [PubMed] [Google Scholar]
- Hains D, Sims‐Lucas S, Kish K, Saha M, McHugh K, Bates CM. 2008. Role of fibroblast growth factor receptor 2 in kidney mesenchyme. Pediatr Res 64:592–598. [DOI] [PMC free article] [PubMed] [Google Scholar]
- Harding SD, Armit C, Armstrong J, Brennan J, Cheng Y, Haggarty B, Houghton D, Lloyd‐MacGilp S, Pi X, Roochun Y, Sharghi M, Tindal C, McMahon AP, Gottesman B, Little MH, Georgas K, Aronow BJ, Potter SS, Brunskill EW, Southard‐Smith EM, Mendelsohn C, Baldock RA, Davies JA, Davidson D. 2011. The GUDMAP database—an online resource for genitourinary research. Development 138:2845–2853. [DOI] [PMC free article] [PubMed] [Google Scholar]
- Kalsotra A, Cooper TA. 2011. Functional consequences of developmentally regulated alternative splicing. Nat Rev Genet 12:715–729. [DOI] [PMC free article] [PubMed] [Google Scholar]
- Karni R, de Stanchina E, Lowe SW, Sinha R, Mu D, Krainer AR. 2007. The gene encoding the splicing factor SF2/ASF is a proto‐oncogene. Nat Struct Mol Biol 14:185–193. [DOI] [PMC free article] [PubMed] [Google Scholar]
- Kelemen O, Convertini P, Zhang Z, Wen Y, Shen M, Falaleeva M, Stamm S. 2013. Function of alternative splicing. Gene 514:1–30. [DOI] [PMC free article] [PubMed] [Google Scholar]
- Little M, Georgas K, Pennisi D, Wilkinson L. 2010. Kidney development: two tales of tubulogenesis. Curr Top Dev Biol 90:193–229. [DOI] [PubMed] [Google Scholar]
- Little MH, McMahon AP. 2012. Mammalian kidney development: principles, progress, and projections. Cold Spring Harb Perspect Biol 4. [DOI] [PMC free article] [PubMed] [Google Scholar]
- Michos O, Cebrian C, Hyink D, Grieshammer U, Williams L, D'Agati V, Licht JD, Martin GR, Costantini F. 2010. Kidney development in the absence of Gdnf and Spry1 requires Fgf10. PLoS Genet 6:e1000809. [DOI] [PMC free article] [PubMed] [Google Scholar]
- Min H, Danilenko DM, Scully SA, Bolon B, Ring BD, Tarpley JE, DeRose M, Simonet WS. 1998. Fgf‐10 is required for both limb and lung development and exhibits striking functional similarity to Drosophila branchless. Genes Dev 12:3156–3161. [DOI] [PMC free article] [PubMed] [Google Scholar]
- Mugford JW, Yu J, Kobayashi A, McMahon AP. 2009. High‐resolution gene expression analysis of the developing mouse kidney defines novel cellular compartments within the nephron progenitor population. Dev Biol 333:312–323. [DOI] [PMC free article] [PubMed] [Google Scholar]
- Nigam SK, Shah MM. 2009. How does the ureteric bud branch? J Am Soc Nephrol 20:1465–1469. [DOI] [PubMed] [Google Scholar]
- Nilsen TW, Graveley BR. 2010. Expansion of the eukaryotic proteome by alternative splicing. Nature 463:457–463. [DOI] [PMC free article] [PubMed] [Google Scholar]
- Ohuchi H, Hori Y, Yamasaki M, Harada H, Sekine K, Kato S, Itoh N. 2000. FGF10 acts as a major ligand for FGF receptor 2 IIIb in mouse multi‐organ development. Biochem Biophys Res Commun 277:643–649. [DOI] [PubMed] [Google Scholar]
- Pan Q, Shai O, Lee LJ, Frey BJ, Blencowe BJ. 2008. Deep surveying of alternative splicing complexity in the human transcriptome by high‐throughput sequencing. Nat Genet 40:1413–1415. [DOI] [PubMed] [Google Scholar]
- Pichel JG, Shen L, Sheng HZ, Granholm AC, Drago J, Grinberg A, Lee EJ, Huang SP, Saarma M, Hoffer BJ, Sariola H, Westphal H. 1996. Defects in enteric innervation and kidney development in mice lacking GDNF. Nature 382:73–76. [DOI] [PubMed] [Google Scholar]
- Pohl M, Sakurai H, Stuart RO, Nigam SK. 2000. Role of hyaluronan and CD44 in in vitro branching morphogenesis of ureteric bud cells. Dev Biol 224:312–325. [DOI] [PubMed] [Google Scholar]
- Poladia DP, Kish K, Kutay B, Bauer J, Baum M, Bates CM. 2006. Link between reduced nephron number and hypertension: studies in a mutant mouse model. Pediatr Res 59:489–493. [DOI] [PubMed] [Google Scholar]
- Qiao J, Uzzo R, Obara‐Ishihara T, Degenstein L, Fuchs E, Herzlinger D. 1999. FGF‐7 modulates ureteric bud growth and nephron number in the developing kidney. Development 126:547–554. [DOI] [PubMed] [Google Scholar]
- Revest JM, Spencer‐Dene B, Kerr K, De Moerlooze L, Rosewell I, Dickson C. 2001. Fibroblast growth factor receptor 2‐IIIb acts upstream of Shh and Fgf4 and is required for limb bud maintenance but not for the induction of Fgf8, Fgf10, Msx1, or Bmp4. Dev Biol 231:47–62. [DOI] [PubMed] [Google Scholar]
- Sanchez MP, Silos‐Santiago I, Frisen J, He B, Lira SA, Barbacid M. 1996. Renal agenesis and the absence of enteric neurons in mice lacking GDNF. Nature 382:70–73. [DOI] [PubMed] [Google Scholar]
- Sawicka K, Bushell M, Spriggs KA, Willis AE. 2008. Polypyrimidine‐tract‐binding protein: a multifunctional RNA‐binding protein. Biochem Soc Trans 36:641–647. [DOI] [PubMed] [Google Scholar]
- Schedl A. 2007. Renal abnormalities and their developmental origin. Nat Rev Genet 8:791–802. [DOI] [PubMed] [Google Scholar]
- Schuchardt A, D'Agati V, Larsson‐Blomberg L, Costantini F, Pachnis V. 1994. Defects in the kidney and enteric nervous system of mice lacking the tyrosine kinase receptor Ret. Nature 367:380–383. [DOI] [PubMed] [Google Scholar]
- Shen S, Park JW, Lu ZX, Lin L, Henry MD, Wu YN, Zhou Q, Xing Y. 2014. rMATS: robust and flexible detection of differential alternative splicing from replicate RNA‐Seq data. Proc Natl Acad Sci U S A 111:E5593–5601. [DOI] [PMC free article] [PubMed] [Google Scholar]
- Sims‐Lucas S, Argyropoulos C, Kish K, McHugh K, Bertram JF, Quigley R, Bates CM. 2009a. Three‐dimensional imaging reveals ureteric and mesenchymal defects in Fgfr2‐mutant kidneys. J Am Soc Nephrol 20:2525–2533. [DOI] [PMC free article] [PubMed] [Google Scholar]
- Sims‐Lucas S, Cusack B, Baust J, Eswarakumar VP, Masatoshi H, Takeuchi A, Bates CM. 2011. Fgfr1 and the IIIc isoform of Fgfr2 play critical roles in the metanephric mesenchyme mediating early inductive events in kidney development. Dev Dyn 240:240–249. [DOI] [PMC free article] [PubMed] [Google Scholar]
- Thiagarajan RD, Cloonan N, Gardiner BB, Mercer TR, Kolle G, Nourbakhsh E, Wani S, Tang D, Krishnan K, Georgas KM, Rumballe BA, Chiu HS, Steen JA, Mattick JS, Little MH, Grimmond SM. 2011. Refining transcriptional programs in kidney development by integration of deep RNA‐sequencing and array‐based spatial profiling. BMC Genomics 12:441. [DOI] [PMC free article] [PubMed] [Google Scholar]
- Treanor JJ, Goodman L, de Sauvage F, Stone DM, Poulsen KT, Beck CD, Gray C, Armanini MP, Pollock RA, Hefti F, Phillips HS, Goddard A, Moore MW, Buj‐Bello A, Davies AM, Asai N, Takahashi M, Vandlen R, Henderson CE, Rosenthal A. 1996. Characterization of a multicomponent receptor for GDNF. Nature 382:80–83. [DOI] [PubMed] [Google Scholar]
- Ule J, Ule A, Spencer J, Williams A, Hu JS, Cline M, Wang H, Clark T, Fraser C, Ruggiu M, Zeeberg BR, Kane D, Weinstein JN, Blume J, Darnell RB. 2005. Nova regulates brain‐specific splicing to shape the synapse. Nat Genet 37:844–852. [DOI] [PubMed] [Google Scholar]
- Wang ET, Sandberg R, Luo S, Khrebtukova I, Zhang L, Mayr C, Kingsmore SF, Schroth GP, Burge CB. 2008. Alternative isoform regulation in human tissue transcriptomes. Nature 456:470–476. [DOI] [PMC free article] [PubMed] [Google Scholar]
- Warzecha CC, Jiang P, Amirikian K, Dittmar KA, Lu H, Shen S, Guo W, Xing Y, Carstens RP. 2010. An ESRP‐regulated splicing programme is abrogated during the epithelial‐mesenchymal transition. EMBO J 29:3286–3300. [DOI] [PMC free article] [PubMed] [Google Scholar]
- Warzecha CC, Sato TK, Nabet B, Hogenesch JB, Carstens RP. 2009. ESRP1 and ESRP2 are epithelial cell‐type‐specific regulators of FGFR2 splicing. Mol Cell 33:591–601. [DOI] [PMC free article] [PubMed] [Google Scholar]
- Xu X, Weinstein M, Li C, Naski M, Cohen RI, Ornitz DM, Leder P, Deng C. 1998. Fibroblast growth factor receptor 2 (FGFR2)‐mediated reciprocal regulation loop between FGF8 and FGF10 is essential for limb induction. Development 125:753–765. [DOI] [PubMed] [Google Scholar]
- Yang Y, Park JW, Bebee TW, Warzecha CC, Guo Y, Shang X, Xing Y, Carstens RP. 2016. Determination of a Comprehensive Alternative Splicing Regulatory Network and Combinatorial Regulation by Key Factors during the Epithelial‐to‐Mesenchymal Transition. Mol Cell Biol 36:1704–1719. [DOI] [PMC free article] [PubMed] [Google Scholar]
- Yu J, Valerius MT, Duah M, Staser K, Hansard JK, Guo JJ, McMahon J, Vaughan J, Faria D, Georgas K, Rumballe B, Ren Q, Krautzberger AM, Junker JP, Thiagarajan RD, Machanick P, Gray PA, van Oudenaarden A, Rowitch DH, Stiles CD, Ma Q, Grimmond SM, Bailey TL, Little MH, McMahon AP. 2012. Identification of molecular compartments and genetic circuitry in the developing mammalian kidney. Development 139:1863–1873. [DOI] [PMC free article] [PubMed] [Google Scholar]
- Zhang C, Zhang Z, Castle J, Sun S, Johnson J, Krainer AR, Zhang MQ. 2008. Defining the regulatory network of the tissue‐specific splicing factors Fox‐1 and Fox‐2. Genes Dev 22:2550–2563. [DOI] [PMC free article] [PubMed] [Google Scholar]
- Zhang X, Ibrahimi OA, Olsen SK, Umemori H, Mohammadi M, Ornitz DM. 2006. Receptor specificity of the fibroblast growth factor family. The complete mammalian FGF family. J Biol Chem 281:15694–15700. [DOI] [PMC free article] [PubMed] [Google Scholar]
- Zhao H, Kegg H, Grady S, Truong HT, Robinson ML, Baum M, Bates CM. 2004. Role of fibroblast growth factor receptors 1 and 2 in the ureteric bud. Dev Biol 276:403–415. [DOI] [PMC free article] [PubMed] [Google Scholar]
Associated Data
This section collects any data citations, data availability statements, or supplementary materials included in this article.
Supplementary Materials
Additional supporting information may be found in the online version of this article.
Supporting Information Table S1
Supporting Information Table S2