

Abstract
In this review, we consider the ways in which vasopressin and oxytocin have been measured since their first discovery. Two different ways of measuring oxytocin in widespread use currently give values in human plasma that differ by two orders of magnitude, and the values measured by these two methods in the same samples show no correlation. The notion that we should accept this seems absurd. Either one (or both) methods is not measuring oxytocin, or, by ‘oxytocin’, the scientists that use these different methods mean something very different. If these communities are to talk to each other, it is important to validate one method and invalidate the other, or else to establish exactly what each community understands by ‘oxytocin’. A similar issue concerns vasopressin: again, different ways of measuring vasopressin give values in human plasma that differ by two orders of magnitude, and it appears that the same explanation for discrepant oxytocin measurements applies to discrepant vasopressin measurements. The first assays for oxytocin and vasopressin measured biological activity directly. When immunoassays were introduced, they encountered problems: high molecular weight factors in raw plasma interfered with the binding of antibodies to the hormones, leading to high and erroneous readings. When these interfering factors were removed by extraction of plasma samples, immunoassays gave measurements consistent with bioassays, with measures of turnover and with the sensitivity of target tissues to exogenous hormone. However, many recent papers use an enzyme‐linked immunoassay to measure plasma levels without extracting the samples. Like the first radioimmunassays of unextracted plasma, this generates impossibly high and wholly erroneous measurements.
Keywords: ELISA, radioimmunoassay, bioassay, oxytocin, vasopressin, sample matrix
Introduction
Vasopressin and oxytocin are released into the circulation from the axon terminals of magnocellular hypothalamic neurones that project to the posterior pituitary. They are also released within the brain from the dendrites of these neurones, in a manner regulated semi‐independently of axonal release. In addition, diverse populations of functionally separate neurones release oxytocin and vasopressin within the brain to regulate diverse physiological processes and behaviours 1. The involvement of these peptides in social behaviour has led some to measure them in plasma, with the assumption that these might be indicative of their activity in the brain. The sense behind this has been questioned 2. Furthermore, more than 100 papers have recently been published using assays that have been claimed to measure oxytocin and vasopressin in human plasma simply and reliably (for example 3, 4, 5, 6), but which report levels massively inconsistent with previous assays. Here, we seek to describe and explain these inconsistencies.
A brief history
In 1906, as an aside in a study of the actions of ergot, Dale 7 reported that extracts of the posterior pituitary gland could stimulate uterine contractions. In 1909, Bell 8 conducted the first clinical trial of this extract, reporting that it powerfully contracted the uterus of women in labour. The extract swiftly entered use in obstetric practice and, in 1913, the Professor of Obstetrics and Gynecology at the University of Toronto declared that ‘it has been employed in practically every obstetrical clinic throughout this continent and in Britain and Europe’ 9.
In 1925, a Committee of the League of Nations adopted the United States Pharmacopeia Standard Reference Powder as an international standard 10. This was made from the whole posterior lobes of cattle: the glands were collected immediately after death and ground in acetone to remove water and fat, with 0.5 mg of powder declared equivalent to one International Unit (IU). These extracts were standardised for their oxytocic activity by a bioassay (on guinea pig uterus), although it was clear that they contained at least two active principles: one with both a pressor activity and antidiuretic activity, and one with oxytocic activity 11. In 1928, Kamm 12 separated and concentrated the two principles, and named them ‘vasopressin’ and ‘oxytocin’.
In the 1950s, the amino acid sequences and structures of oxytocin and vasopressin were elucidated, followed shortly by their synthesis. However, the units by which they were measured remained tied to biological activity. In 1955, the Third International Standard was established by an international collaboration: samples of posterior pituitary extract were sent to 19 laboratories in 10 countries, where 185 assays were carried out to define its oxytocic, vasopressor and antidiuretic potency 13. The standard was adjusted to have the same biological activity as previous standards, and its activity was compared with that of pure synthesised peptide. The current (4th) International Standard for Oxytocin assigns 1 mg of oxytocin a potency of 600 IU 14, and the International Standard for Vasopressin assigns 1 mg of vasopressin a potency of 410 IU 15, and these are the values used for conversions in the present review.
By the end of the 1950s, it was accepted that oxytocin and vasopressin were synthesised in hypothalamic neurones, packaged into vesicles in the cell body and transported down the axons for storage in the axon terminals in the pituitary 16. The vesicles certainly contained much more than the hormones: Gainer et al. 17, 18 identified two putative precursor proteins in the hypothalamus, and showed that they were packaged into the neurosecretory vesicles where they were processed to produce the peptides and their associated neurophysins. The structures of the precursors were determined 19, and neurophysins, now established to be elements of the precursors, were thus revealed to be stored and secreted with their associated peptides in equimolar amounts.
Morris 20 then sought to establish exactly how much hormone is present in each vesicle. By counting vesicles in ultrathin sections of the pituitary under the electron microscope, he estimated that the rat posterior pituitary contains 1.44 × 10¹⁰ vesicles and, from the pituitary content of oxytocin and vasopressin measured by bioassays, he deduced that each vesicle contains approximately 84 000 hormone molecules. This calculation assumed that all of the hormone content was contained in the vesicles and so, with Jean Nordmann, he set about checking this. They prepared fractions of posterior pituitary in which the number of vesicles could be estimated, by adding latex particles of similar size, pelleting the mixture, and measuring the ratio of latex particles to vesicles 21. They measured hormone content by both radioimmunoassays and bioassays, and neurophysin content by radioimmunoassay, and concluded that vesicles from both oxen and rats contained approximately 85 000 molecules of hormone and neurophysin. The close agreement with the estimate derived by morphometry of the whole gland confirmed that all hormone was contained within the vesicles. The estimated number of molecules in each vesicle was close to the theoretical maximum in the space available, and so could not be a significant underestimate.
Oxytocin and vasopressin act at four receptors: the oxytocin receptor 22; the V2 receptor, which accounts for the antidiuretic actions of vasopressin 23, 24; the V1b receptor 25, which accounts for vasopressin effects on adrenocorticotrophin release; and the V1a receptor, which accounts for the pressor activity of vasopressin 26. These receptors bind their preferred ligands with nanomolar affinity, although each hormone can act at receptors for the other if present at a 100‐fold excess. Receptor affinity is important for comparing the potency of different peptides at a given target, although it is a poor guide to the concentrations needed to elicit biological activity. The effective concentration in any tissue depends less on the receptor affinity than on the receptor density. In the periphery, V2 receptors are at highest density in the kidney, and oxytocin receptors are at highest density in the uterus and mammary gland.
Bioassays of vasopressin
Initially, the main ways of quantifying oxytocin and vasopressin were by bioassays. The ‘pressor’ bioassay measured the blood pressure response to i.v. injection of extracts in rats 27. Specificity was a problem because other factors present in samples might also raise blood pressure. Accordingly, in the protocol of Dekanski 27, rats were injected with an α‐adrenergic antagonist to abolish the pressor responses to adrenaline and noradrenaline, which were the major confounding factors.
Bioassays for antidiuretic activity measured the degree to which injections of extract concentrated the urine of a water‐loaded rat 28, and these had fewer problems with specificity than pressor assays. By the late 1950s, antidiuretic assays could measure vasopressin at doses as low as 4 μU (10 pg) 29, a sensitivity achieved by injecting rats with alcohol to suppress endogenous vasopressin secretion and by maintaining a constant water load to stabilise the preparation for repeated measurements. These assays were still not sufficiently sensitive to measure in plasma until Heller and Stulc 30 introduced another refinement; using rats with exteriorised urinary bladders, they could detect concentrations above 0.65 μU/ml, and they estimated that vasopressin circulated in normally hydrated men at approximately 1.7 μU/ml (4 pg/ml).
Using a modified version of this assay, Czaczkes et al. 31 took blood samples from men and assayed them without extraction or concentration. Vasopressin was undetectable (< 0.25 μU/ml) in samples taken 1–2 h after an oral water load, but, during 24 h of dehydration, concentrations rose to approximately 18 μU/ml (44 pg/ml), whereas urine osmolarity increased from approximately 70 mOsm/l to more than 1000 mOsm/l. The range agreed with that reported by Heller and Stulc 30, and also with that reported by Yoshida et al. 32 who found 1.9 μU/ml (4.6 pg/ml) in extracted samples from normally hydrated subjects, rising to 6.5 μU/ml (16 pg/ml) after modest dehydration.
The antidiuretic bioassay was capable of high sensitivity and precision, and it yielded some remarkable insights. For example, Segar and Moore 33 found that vasopressin concentrations in man depend on both position and on ambient temperature. In 79 control subjects who were sitting comfortably, the mean plasma concentration was 1.65 μU/ml (4 pg/ml) compared to 0.4 μU/ml (1 pg/ml) when lying down and 3.1 μU/ml (8 pg/ml) when standing. The responses to posture reflect the sensitivity of vasopressin secretion in man to central hypovolaemia, and were later confirmed by radioimmunoassay 34, 35, 36. After 2 h of exposure to 50 °C, levels in control subjects rose to 5.2 μU/ml (13 pg/ml), falling again within 15 min at 26 °C. The sensitivity to temperature was also later confirmed by a radioimmunoassay 37 and, in 2008, it was reported that vasopressin neurones are intrinsically thermosensitive through membrane channels expressed from the trpv1 gene 38.
From such studies came the agreement that the normal plasma concentration of vasopressin in man is below 2 μU/ml (5 pg/ml) 39, with this increasing several fold after 24 h of dehydration. These conclusions were also consistent with studies of antidiuretic responses to exogenous vasopressin: Theobald 40 first showed that injection of 5–10 mU (12–24 ng) vasopressin produced near‐maximal antidiuresis in man (see also 41, 42, 43), and studies using i.v. infusions of vasopressin in water‐loaded subjects indicated that the kidney responds to changes in the rate of vasopressin secretion of < 1 pg/min/kg, and also that the rate required to produce isosmolar urine during overhydration is approximately 3 pg/min/kg 44, 45, 46. A similar sensitivity to low levels of vasopressin was found in dogs 47, 48.
Bioactivity of oxytocin
Antidiuretic assays benefitted from the extreme sensitivity of the urine concentrating mechanisms of the kidney, but practical bioassays for oxytocin were less sensitive. The uterus is most sensitive to oxytocin in late pregnancy 22 but, at this stage, the uterus contracts spontaneously, complicating the measurement of samples. Bioassays using the nonpregnant rat uterus 49 and mammary gland bioassays 42 could generally detect only concentrations above 25 μU/ml (42 pg/ml). The most sensitive bioassays used mouse mammary strips and could detect 4 μU/ml (7 pg/ml) in 0.5 ml of sample 50, although even this was still not sufficiently sensitive to measure levels in raw plasma.
The first estimates of the circulating concentration of oxytocin in man came not from any direct bioassay but were a combination of deduction and experiment 40, 51. Theobald 40, who had shown that very low doses of vasopressin evoked antidiuresis in man, speculated that similarly low doses of oxytocin would induce labour, and he showed that drips delivering 1–5 mU/min (2–8 ng/min) were indeed effective. He concluded that the physiological concentration of oxytocin which initiates labour ‘could not be more and might well be less’ than that achieved by this rate of delivery. Saameli 52 drew similar conclusions: he calculated that the half‐life of oxytocin in pregnant women was approximately 3–4 min, and also that uterine contractions were initiated by infusions that raised plasma concentrations by 3 μU/ml (5 pg/ml).
Although oxytocin infusions advance labour, and although there is a modest increase in plasma oxytocin concentrations before delivery in most animal studies, many have doubted whether there is any increase in oxytocin secretion before delivery in women 42, 53, 54, 55. They have proposed that it is not an increase in oxytocin secretion, but the increase in sensitivity of the uterus to oxytocin that initiates labour in women 56. Nevertheless, augmenting oxytocin concentrations with infusions can advance delivery in all mammals studied. Most protocols for inducing labour in women start by infusing oxytocin at 1–2 mU/min (1.7–3.3 ng/min), rising to 20–30 mU/min for at most 5 h, with a maximum total dose of 5 IU (8 μg). Higher doses than these are not more effective 57, and some have suggested that even these rates are higher than necessary. Dawood 58 advised that infusions should not exceed 2–8 mU/min and reported that oxytocin given as pulses, beginning with 1 mU/min every 8 min and doubling the pulse dose every 24 min, was as efficient as continuous infusion. Oxytocin is given at much higher doses to prevent post‐partum haemorrhage 59, but this action appears to be mediated not by oxytocin receptors but by V1a receptors on the uterine artery 60.
Theobald 51 also studied the effect of suckling during the first 10 days of the puerperium; uterine contractions began within 3 min of the onset of suckling, and this effect was matched by a single i.v. injection of 10 mU (17 ng) oxytocin. Other studies recorded intramammary pressure in women in the week after delivery, and noted that i.v. injections of just 0.1–2 mU (0.2–3 ng) caused sharp increases in intramammary pressure 61, and when a baby suckled at the uncannulated breast, sharp rises in intramammary pressure were seen in the cannulated gland, similar to those evoked by i.v. injection of approximately 5 mU of oxytocin 62, 63. The human myopithelium proved to be more sensitive to oxytocin than in any other species studied previously. Measurements by radioimmunoassay reported that, during suckling in women, intermittent pulses were observed with a mean amplitude of just approximately 9 pg/ml from a basal level of approximately 2 pg/ml, as expected for bolus release of approximately 17 ng 64.
In lactating rats, suckling results in intermittent activation of oxytocin neurones: every 5–10 min, they discharge a burst of approximately 150 action potentials over 2–3 s. Each burst is followed by an increase in intramammary pressure that can be mimicked by i.v. injection of approximately 0.5 mU (0.8 ng) of oxytocin 16, 65. In anaesthetised rats, similar increases in intramammary pressure can be produced by electrically stimulating the pituitary stalk for 4 s at 50 Hz to evoke a burst‐like train of action potentials 65. Similar stimulation of the isolated posterior pituitary gland in vitro evokes secretion into the bathing medium, which can be measured by radioimmunoassay without problems of sample matrix interference because the assay standard curve is generated in the same medium. Stimulation at 50 Hz releases approximately 7 pg of oxytocin per stimulus pulse 66, which is close to the release estimated from the intramammary pressure response to a similar electrical stimulation in vivo.
The plasma volume of a rat is approximately 4 ml/100 g 67, and so a burst that releases 0.5 mU (0.8 ng) oxytocin should raise circulating concentrations in a 300 g rat by approximately 70 pg/ml. Higuchi et al. 68 developed a radioimmunoassay that allowed oxytocin to be measured in unextracted rat plasma, and took samples at the time of suckling‐induced milk let‐down, as recognised by stretching movements of the suckling pups. Plasma concentrations rose from 16.5 pg/ml to approximately 65 pg/ml, and declined with a half‐life of approximately 1.5 min. Because the behavioural response is apparent only with a delay after milk let‐down, these samples may have missed the full peak of plasma oxytocin, although the agreement is still close.
In pigs (body weight 150–200 kg), suckling evokes increases in intramammary pressure equivalent to those induced by i.v. injection of 50 mU (83 ng) of oxytocin 69. For a plasma volume of 5 l, these would raise plasma concentrations by approximately 17 pg/ml, which is close to the peak concentration (approximately 18 pg/ml) measured by radioimmunoassay during suckling‐induced milk ejection. Larger animals show even higher sensitivity to oxytocin; in horses (body weight 543 kg), with injections of just 5–10 mU mimic the suckling‐induced increase in intramammary pressure 70.
Across mammalian species, blood volume is linearly proportional to body mass, although the mass of the pituitary is proportional only to the log of body mass 71. Consistent with this, the human posterior pituitary contains approximately 21 μg of oxytocin 72, 73, 74, whereas that of the rat contains 0.5–1 μg. Given a 400‐fold difference in plasma volume but only a 40‐fold difference in pituitary oxytocin content, it is likely that the higher sensitivity of the mammary gland and uterus in humans parallels the lower amounts of oxytocin available for secretion from the pituitary.
Immunoassays
By the end of the 20th century, bioassays were still ‘of critical importance’ in the discovery of novel antagonists and antagonists of vasopressin and oxytocin because biological activity cannot be inferred from structure alone 75. However, bioassays were time consuming and expensive in their use of animals, and they had been extensively replaced by immunoassays that could assay many samples quickly. In 1973, Chard 76 noted that best immunoassays for vasopressin were no more sensitive than the best bioassays; the same is still true today for most radioimmunoassays and most enzyme‐linked immunoassays (ELISAs). However, bioassays are less specific because of the cross‐reactivity of vasopressin and oxytocin with their respective receptors 76.
Radioimmunoassays and competitive ELISAs both depend on the reaction between the hormone in a sample and a fixed amount of antibody added to it: some of the hormone will bind to the antibody, whjereas some remains ‘free’, in a reaction governed by the law of mass action. When a fixed amount of radiolabelled or enzyme‐conjugated hormone is added, it competes for binding to the antibody with the hormone already present, and so less labelled hormone will bind when more unlabelled hormone is present. In radioimmunoassays, the bound fraction is then precipitated, usually with a second antibody that recognises the original antibody. The amount of label in the pellet is measured, and the values are compared with a standard curve generated from known concentrations of unlabelled hormone in assay buffer (processed in the same way as the samples). This is a hyperbolic curve, which, after allowing for nonspecific binding, can be reduced by a logit‐log transformation to a straight line 77. In ELISAs, the bound fraction is retained in the assay plate, and the amount of bound label is measured by optical density, giving a similar hyperbolic standard curve.
There were considerable difficulties in developing immunoassays for vasopressin and oxytocin. Because these have a low molecular weight, they are poor immunogens, making the preparation of high‐affinity antisera difficult, and circulating levels were clearly very low. Thus, close attention was given to extraction and concentration procedures 76. In 1970, Robertson et al. 78 described one of the first radioimmunoassays to measure plasma vasopressin in man. This assay was sensitive to 1 pg/ml (0.3 mU/ml) but, when whole plasma was assayed, apparent concentrations were ‘several hundredfold higher than anticipated, failed to fluctuate appropriately in response to physiological manipulation or in disease states, and were not reduced substantially by dialysis of the plasma under conditions that completely removed vasopressin’.
Robertson et al. 78 set about understanding why these initial radioimmunoassay measurements were erroneous. By filtering plasma samples on G‐25 Sephadex, they resolved three peaks of ‘immunoreactivity’, only the third and smallest of which was consistent with true vasopressin, being recovered in the same location as pure vasopressin 78. The first peak accounted for a 67% loss of binding of antibody to vasopressin, and the second peak accounted for a further 30% loss. Neither of these apparent ‘immunoreactivities’ were displaced by an excess of cold vasopressin, indicating that they did not involve competitive binding of vasopressin, but occlusion of antibody recognition of vasopressin. The immunoreactivity in the third peak reproduced the expected relationship with plasma osmotic pressure in normal adults, the expected high levels in nephrogenic diabetes insipidus (in which the kidney is unresponsive to vasopressin, resulting in high plasma osmolarity and elevated vasopressin secretion) and the expected low levels in pituitary diabetes insipidus (in which vasopressin secretion is deficient as a result of genetic mutation or to damage to the hypothalamus or pituitary). After accounting for the plasma matrix interference, Robertson et al. 78 calculated that normal plasma concentrations of vasopressin in man were approximately 1 pg/ml, increasing to approximately 10 pg/ml with dehydration.
Problems with immunoassays
Problems can come from factors such as heparin or low pH or high osmolality that interfere with the antigen–antibody reaction. High salt concentrations have a nonlinear effect, and serial dilutions of samples with a high salt content produce measurements that do not parallel the standard curve. In some cases, an antibody might recognise elements unrelated to the antigen against which it was raised. Antibodies are sensitive to differences in amino acid sequence, although they recognise the structure of a molecule, not its amino acid sequence per se, and so unrelated molecules might cross‐react 76, 79. However, it is unlikely that an antibody will recognise a different ligand with higher affinity than it has for the ligand to which it was raised; it may recognise other ligands with lower affinity, although this presents a major problem only if that different ligand is present at higher concentrations.
For peptide assays, interference mainly comes from plasma proteins that bind to the primary antibody, impairing its ability to bind hormone, leading to an excess of free label that is erroneously measured as a high concentration of hormone 78 (Fig. 1). Such interference has also been recognised in immunoassays for cholecystokinin 80, parathyroid hormone 81, thyrotropic hormone 82, glucagon 83, secretin 84, 85, angiotensin 86, growth hormone 87, vasoactive intestinal peptide 88, gonadotrophins 89 and gonadotrophin‐releasing hormone 90, all of which were resolved by sample extraction. When describing their vasopressin assay, Baylis and Heath 91 emphasised that ‘even small increases in protein concentration lower binding and therefore careful control of extract protein concentration is needed to avoid the misinterpretation that a fall in binding is due to immunoreactive vasopressin’. At that time, seven other vasopressin radioimmunoassays had been described, using different antibodies and different extraction procedures. All had reported plasma concentrations of 1–10 pg/ml, and all showed that concentrations changed with physiological conditions in the manner expected from bioassays.
Figure 1.
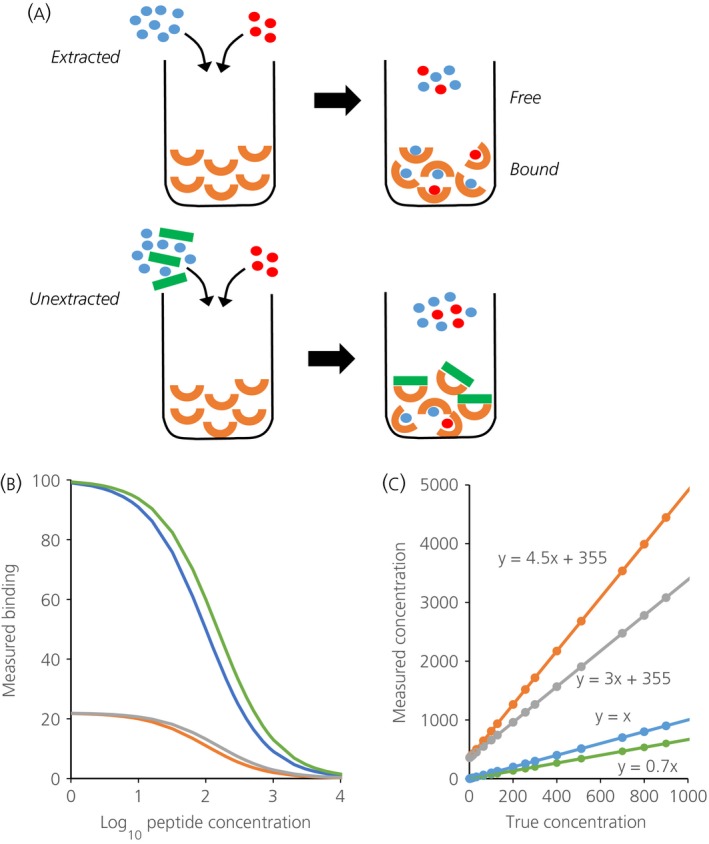
(a) Illustrates the principles underlying competitive immunoassays and the problem posed by plasma matrix interference. In an immunoassay, a sample containing an unknown amount of hormone (in blue) is mixed with a known amount of labelled hormone (red) and introduced to a given amount of antibody (orange). The labelled and unlabelled hormone compete for binding to the antibody: the more hormone in the sample, the less bound labelled hormone, which is what is measured in an immunoassay. Unextracted plasma contains large molecules that can bind nonspecifically to antibodies (green), preventing them from binding to antigen. Accordingly, less labelled hormone can bind to the antibody, and this is erroneously measured as an excess of hormone in the sample. When a ligand L interacts with antibody M to form a complex ML, the concentrations at equilibrium are governed by Kd = [M]*[L]/[ML] where Kd, the dissociation constant, characterises the affinity of the antibody. Defining Mo = [M] + [ML] as the maximum binding, the relationship [ML] = M0*[L]/(Kd + [L]) determines the hyperbolic standard curve 78. By this relationship, in a radioimmunoassay, the log of the concentration of unlabelled peptide is linearly proportional to logit (B/Bo) where B is the counts measured ([M]), B0 is the maximum number of counts measured in the absence of unlabelled peptide ([M0]), and logit (y) = loge(y/(1 − y)). (b) Illustrating (in blue) the relationship between log peptide concentration and B when B0 and Kd are given values of 100. Samples are contained not in assay buffer but in a sample matrix that can affect either Bo or Kd. If the matrix reduces the affinity of the antibody, the true concentrations of ligand will relate to measured levels by a curve that is displaced to the right of the standard curve: the green curve in (b) simulates the effect of changing Kd from 100 to 150. In an immunoassay, this leads to an underestimation of levels, as shown by the green line in (c), which plots the true concentration against that inferred from the standard curve. If the matrix reduces the antibody available for binding with the ligand, the true concentrations will relate to measured levels by a curve that is ‘compressed’. The orange curve in (b) simulates the effect of interference that changes Bo from 100 to 22; such an assay will report an erroneous high basal level (360 pg/ml) and will exaggerate the levels of any ligand present, by 4.5‐fold in the example shown by the green line in (c). Plasma proteins may affect both Kd and Bo. The grey curves in (b) and (c) show the effects of increasing Kd to 150 and reducing B0 to 22. The erroneous baseline level is unaffected, but the exaggeration is reduced; here, the gain is three‐fold.
Fyhrquist et al. 92 circumvented the problem of protein interference by using individual plasma blanks spiked with a known amount of vasopressin to correct measured values. In unextracted plasma from healthy subjects, they found a mean vasopressin concentration of 2 pg/ml in the supine position and 6.2 pg/ml in the upright position, which is in agreement with the levels measured in bioassays by Segar and Moore 33. Henneberry et al. 93 took a different approach: they assayed unextracted samples using standard curves generated in charcoal‐filtered plasma, and reported basal levels of 1.8 pg/ml, rising to 6.3 pg/ml after a saline infusion that raised plasma osmotic pressure from 280 to 293 mOsm/l.
Immunoassays for oxytocin
By the 1980s, many laboratories had generated radioimmunoassays for oxytocin, using independently produced antibodies 58, 72, 73, 74, 94, 95, 96, 97, 98] and most, but not all 99, 100, required extraction. With few exceptions, assays in extracted plasma reported basal levels of < 5 pg/ml in man: of 17 studies reviewed by Szeto et al. 101, only two reported higher levels; the highest (71 pg/ml) were in samples taken from the corpus cavernosum of the penis, a circumstance that might be expected to affect hormone secretion.
Antibodies do not recognise the whole molecule, and so an immunoassay may overestimate hormone concentrations by measuring fragments of no physiological significance 76. Generally, antibodies are raised to the tail end of oxytocin, which confers its biological activity. When oxytocin or vasopressin are secreted, the entire contents of the vesicle are discharged, including elements of incompletely processed precursor that may not be biologically active. If an extended or truncated oxytocin molecule has full biological activity, then, to all intents and purposes, it is oxytocin, as understood to be the active molecule secreted from the posterior pituitary. Problems might arise less from assays recognising such forms, than from failing to recognise them, leading to an underestimate of the levels of bioactive oxytocin. However, the major discrepancies are that some immunoassays massively overestimate oxytocin concentrations by comparison with bioassays.
Overestimation might arise if an antibody recognises a fragment with higher affinity than the native peptide, although this is unlikely. Overestimation can also arise when enzymes are present that degrade oxytocin. The plasma of late pregnant women contains abundant oxytocinase, which inactivates oxytocin by splitting the peptide linkage between the cysteine and tyrosine residues 102. When oxytocin is incubated in this plasma, there is a rapid loss of biological activity but, after 2 h, oxytocin ‘immunoreactivity’ exceeds bioactivity by three‐fold. The obvious explanation is that oxytocinase in the sample also degrades the labelled oxytocin. The consequence will be that less label will bind to antibody, leading to overestimation of the amount of oxytocin 76. Fortunately, enzymatic degradation of oxytocin is a problem only when measuring in plasma from pregnant women 54, and extraction procedures can remove such enzymes efficiently.
The relationship between plasma concentrations and rates of production and secretion
How much hormone is present in plasma depends on the rate at which it is secreted, the volume in which it is dispersed, and the rate at which it is cleared. Hormone is secreted into the extracellular fluid of the pituitary gland; from there, it enters blood that drains into the jugular vein and, unless it is bound to much larger molecules in the plasma, it will pass relatively freely between the plasma and the extravascular fluid. Thus, the ‘distribution volume’ will be between the total plasma volume and the total extracellular fluid volume. The clearance can be measured by the decline of hormone in blood samples taken after an i.v. injection or at the end of a steady‐state infusion, usually by a half‐life approximation to an exponential fit to the first, fast phase of disappearance. Other studies prefer to measure the metabolic clearance rate (MCR), by infusing hormone at a fixed rate until plasma concentrations reach an equilibrium. At equilibrium, the delivery of oxytocin must equal its clearance, and the MCR is calculated from the delivery rate and the measured concentration. The MCR is measured in units of l/min, being the equivalent volume of fluid from which hormone is completely cleared every 1 min.
Clearance of vasopressin
In dogs, Lauson and Bacanegra 103 reported that the antidiuretic activity of exogenous vasopressin disappeared with a half‐life of approximately 5.4 min. In experiments on the isolated, perifused kidney, it was found that, when vasopressin was infused at 100–120 ng/min, approximately 38% of it was cleared in each passage through the kidney. More was lost from the blood than was found in the urine, and Lauson and Bacanegra 103 concluded that, at physiological levels (< 25 pg/ml), most of the vasopressin in the plasma is bound to protein and is cleared by the tubular cells of the kidney by enzymatic inactivation and secretion. At higher concentrations, more of the vasopressin is unbound, and some of this is filtered at the glomerulus and excreted into urine.
In rats, Ginsburg and Heller 104 estimated that the initial half‐life of exogenously administered vasopressin was less than 1 min. From experiments in acutely nephrectomised rats, and by ligating arteries to reduce blood flow through the liver, it was concluded that most of the vasopressin was cleared by the kidneys and liver. In similar studies on rabbits, vasopressin was cleared with a half‐life of approximately 4.5 min, again mainly by the kidneys and liver 105. In dogs, rather than measure vasopressin by either radioimmunoassay or bioassay, Ang and Jenkins 106 injected radiolabelled vasopressin and used thin‐layer chromatography and autoradiography to quantify labelled vasopressin in plasma samples: it disappeared with an initial half‐life of 3 min and a later half‐life of 13 min.
In man, after an acute injection of vasopressin, bioactivity disappeared with an initial half‐life of 5.6 min 43. Later studies using radioimmunoassay indicated that vasopressin disappeared from the circulation with a bi‐exponential decay 107. The fast phase had a half‐life of 5.4 min and a distribution volume close to the plasma volume; the slower phase had a half‐life of 78 min with a distribution volume close to the extracellular fluid volume. In patients with chronic renal failure, the clearance is much slower: MCR is reduced by approximately half 108, which is consistent with the conclusion that vasopressin is mainly cleared from the circulation through the kidneys.
Clearance of oxytocin
Ginsburg and Smith 49, using a rat uterus bioassay, found that, when oxytocin was added to rat plasma in vitro at 37 °C, it was relatively stable, losing just 6–13% of biological activity after 40 min of incubation. By contrast, when oxytocin was injected into rats, the biological activity disappeared with a half‐life of 1.65 min. In nephrectomised rats, bioactivity declined with a half‐life of approximately 3 min in the first 7 min, and much more slowly thereafter. When the splanchnic vessels were also ligated, the initial decline was not further changed but, after 7 min, oxytocin concentrations ‘stuck’ at a high, steady level. Ginsburg and Smith deduced that, when oxytocin enters the circulation, it is rapidly removed by the kidneys and liver. Without these organs, injected oxytocin diffuses within approximately 7 min throughout the extracellular fluid, where it is degraded only very slowly.
In the baboon, oxytocin clearance was also consistent with a two‐compartmental system, corresponding to the plasma volume and the extravascular fluid volume. The initial half‐life in the first phase of distribution was approximately 1 min, followed by a terminal elimination half‐life of approximately 10 min 109.
In man, Fabian et al. 43 measured oxytocin with a mammary gland bioassay and studied its clearance after the end of an i.v. infusion. Bioactivity disappeared with a half‐life of 4.8 min with a distribution volume of 10.5 ml/100 g, which is close to the extracellular fluid volume, whereas an acute large injection disappeared with a half‐life of 3.2 min and a distribution volume of 7.4 ml/100 g. Ultrafiltration of the plasma indicated that, whereas approximately 30% of similarly infused vasopressin was bound to large molecules, there was no apparent binding of oxytocin. In vitro, oxytocin bioactivity was stable, as found in rats 49; only approximately 20% was lost after 24 h at 37 °C.
Thornton et al. 110 measured oxytocin by radioimmunoassay in extracted plasma from pregnant and post‐partum women, taking careful precautions to inactivate oxytocinase. Within 30 min, infusions of 17.9 ng/min in pregnant women raised oxytocin concentrations by 3.5 pg/ml from a basal level of 1.5 pg/ml. In postpartum women, the same increase could be matched by infusion of just 4.3 ng/min. The corresponding MCRs were 5.7 l/min in pregnant women but only 1.3 l/min in postpartum women, suggesting that oxytocinase indeed has a major effect on the clearance of oxytocin.
Thus, bioassays, radioimmunoassays and evidence of the sensitivity of peripheral targets to oxytocin and vasopressin all converged on the conclusion that, in mammals, both hormones are normally present in the circulation at < 10 pg/ml. The pharmokinetics are consistent with a two‐compartment model, where these hormones are secreted into the blood are cleared by the kidneys and liver, and diffuse between the blood and extravascular fluid. Bolus injections disappear rapidly, with an initial half‐life that varies between species and with physiological state: in the rat, both hormones disappear with an initial half‐life of approximately 2 min; in man, oxytocin has a half‐life of 4–10 min, except in pregnancy, when oxytocinase shortens this to 2–3 min. As a proportion of body weight, the rat pituitary contains much more oxytocin and vasopressin than the human pituitary and, in rats, as in other small mammals, circulating levels are higher. In man and other large animals, lower circulating concentrations are compensated for by higher sensitivity of the peripheral targets.
ELISAs
Competitive ELISAs work on the same principles as radioimmunoassays, with the advantages that they do not use radioactive materials, require less investment in equipment, and the biotinyl–oxytocin is more stable than radiolabelled oxytocin. However, ELISAs are similarly susceptible to plasma interference. Discussing the problems that arise in measurements in human plasma, Bjerner et al. 111 characterised the first step of any immunoassay as ‘the encounter between a limited number of immobilised animal antibodies in close relation to each other and a huge concentration of human immunoglobulins and non‐immunoglobulins containing a broad spectrum of reactivities’. The binding of plasma proteins to an immunoglobulin can hinder its ability to bind an antigen, reducing its affinity, and/or may completely prevent some of the antibody from binding to antigen. With a reduction in maximum binding, an assay will report erroneously high values even in the absence of any antigen, and will exaggerate measurements of added antigen. The effect of a reduction in affinity is different; in this case, the assay will under‐report added antigen. In both cases, there will be a linear relationship between the amount of oxytocin added and the amount measured, although the slope will depend on the nature of the interference (Fig. 1).
In 1994, the first ELISA suitable for measuring oxytocin in plasma was developed by Prakash et al. 112. They recognised that plasma components interfered by reducing antibody binding, and so they constructed standard curves in hormone‐stripped plasma. Their assay could detect plasma concentrations above 1.25 pg/ml, and they used it to measure oxytocin in the cow during milking, comparing the results with measurements of the same samples by radioimmunoassay after plasma extraction. The two methods showed very close agreement.
The ELISAs in most widespread use are marketed by Enzo, who draw attention to problems of plasma matrix interference, illustrate the benefits of plasma extraction, and ‘strongly recommend’ that users extract plasma samples. They state that it might be possible to dilute plasma samples enough to minimise interference (suggesting at least an eight‐fold dilution) but warn that the user ‘must verify’ that these dilutions are appropriate for their samples 113. This advice has been largely ignored. Many studies have used this assay on unextracted human plasma, reporting mean concentrations of oxytocin and vasopressin of typically 100–500 pg/ml 3, 4, 5, 6, 114. Those that have diluted samples have done so by less than the manufacturer's recommendations, without confirming that their dilution is adequate.
These values are inconsistent, by two orders of magnitude, with both bioassays of oxytocin and vasopressin and with radioimmunoassay measurements on extracted samples. They are also inconsistent with the known sensitivity of peripheral targets to oxytocin and vasopressin, and with what is known of the production, storage and clearance of these hormones. A plasma concentration of 350 pg/ml oxytocin in man implies a total blood content of approximately 1 μg (given a plasma volume of 3 l) and, for a half‐life of 10 min, this implies a secretion (and production) rate of 500 ng/min, or 720 IU/day. Jones and Pickering 115 measured the rate of hormone production in the rat by giving rats an intracisternal injection of tritiated tyrosine to label newly synthesised oxytocin and vasopressin. Radioactive hormone began to appear in the posterior pituitary within 2 h, and, after 7 days, the specific radioactivity of each hormone declined with a half‐life of approximately 13 days. They thus calculated that oxytocin must be secreted at 18.7 mU/day and vasopressin at 28.9 mU/day. Assuming a half‐life of 2 min, this is consistent with plasma concentrations of 5–10 pg/ml for each hormone. Thus, to sustain a plasma concentration of 350 pg/ml in man, oxytocin must be produced at 40 000 times the rate measured in the rat. Given a difference in pituitary mass and oxytocin content of just 40‐fold, this seems beyond plausibility.
Three studies have compared measurements of oxytocin in the same samples by the same ELISA, with and without extraction 101, 116, 117. Robinson et al. 116 measured oxytocin levels in seals: in extracted samples, they found plasma levels of approximately 8 pg/ml, compared to 300 pg/ml in unextracted samples collected in heparin vacutainers or 540 pg/ml in unextracted samples collected in ethylenediaminetetraacetic acid (vacutainers). There was no correlation between the measurements in extracted and unextracted samples. Christensen et al. 117 measured plasma samples using both a radioimmunoassay and the Enzo ELISA. Radioimmunoassay of extracted samples returned mean levels of 1.1 pg/ml, and levels measured in the same samples spiked with oxytocin were consistently higher by the expected amount. Without sample extraction, the ELISA measured basal levels of 97 pg/ml, failed to recover spiked levels accurately, and the measurements did not correlate with levels measured in extracted samples. Szeto et al. 101 also found no correlation between levels in extracted and unextracted samples. Spiking unextracted samples with oxytocin resulted in a 3.5‐fold exaggeration of the measurements, indicating that plasma factors interfere with the binding of antibody to oxytocin (Fig. 1).
Claims that the Enzo ELISA is a valid way of measuring oxytocin in unextracted plasma do not rest on manufacturer's advice, which, as we have noted, strongly recommends extraction, but, instead, converge on two papers, neither of which actually investigated human plasma at all. Kramer et al. 118 measured oxytocin in plasma of rats and prairie voles, reporting basal levels of 79 pg/ml in rats and 264 pg/ml in voles, which are both much higher than measured by radioimmunoassay in extracted samples. They showed that pooled samples from prairie voles diluted in parallel with the assay standard curve. However, nonspecific binding to antibody is also governed by the law of mass action and, accordingly, erroneous levels can dilute in parallel to the standard curve except at extreme dilutions: what constitutes a sufficient dilution will depend on the affinity of the particular interfering factor for the antibody. Kramer et al. 118 also found that, in voles injected s.c. with 5 μg of oxytocin, plasma levels reached 20 ng/ml. Oxytocin injected s.c. is expected to distribute throughout the extracellular fluid volume, which, for a vole weighing approximately 70 g is < 10 ml. An injection of 5 μg should therefore increase plasma concentrations by > 500 ng/ml, much more than reported, suggesting that vole plasma proteins also reduce the affinity of the antibody.
Carter et al. 119 further reported that, in voles, the ELISA measured spiked levels of oxytocin with a gain of 0.79. This is consistent with a reduction in antibody affinity, although not sufficient to account for the discrepancy between expected and measured oxytocin in Kramer's measurements. In fractions separated by high‐performance liquid chromatography (HPLC), apparent immunoreactivity appeared only in fractions that eluted with oxytocin, suggesting that there was no plasma interference. However, the same method had previously been used by Wismer Fries et al. 120 in a study that reported levels of oxytocin in human urine approximately one million times higher than found in previous or subsequent reports. According to Anderson 121, that discrepancy arose from the limited analytical selectivity of rapid chromatographic separation and the low sensitivity of ultraviolet absorbance detection.
Carter et al. 119 also claimed that four previous studies had validated the ELISA in unextracted plasma. Of those four studies, three neither report, nor cite any validation of the assay; the fourth 122 found higher plasma concentrations of oxytocin in rats than previously reported, and so conducted ‘a control study with known concentrations of oxytocin’. No details are provided except that the ELISA kit ‘had a detection sensitivity of 3.21 pg/ml’. Because they had found basal levels of 400 pg/ml in unextracted plasma, it appears that their control must simply have been a verification of assay performance in assay buffer.
Finally, Carter et al. 119 claimed a biological validation for the ELISA in reporting that breastfeeding in women lowered salivary concentrations of oxytocin. Because suckling‐induced oxytocin release is indispensable for milk let‐down in mammals 123, it is difficult to understand how such an anomalous observation qualifies as a validation.
Other methods of measurement
Attempts have been made to develop assays using liquid chromatography‐tandem mass spectrometry (LC‐MS/MS). Such methods also have problems with sample matrix interference 124. As Zhang et al. 125 recognised, ‘One common challenge in biomarker analysis is to select an appropriate surrogate matrix to prepare the standard curve, which is free of target analytes and is identical or similar to unknown sample matrix with regard to ionisation effects and extraction recovery’. Plasma oxytocin was measured using human plasma diluted with water (1 : 6) as a surrogate matrix, and basal levels of 2.4 pg/ml for human but 298 pg/ml for rat were reported; these high levels in the rat may indicate that human plasma is not a suitable surrogate matrix for measurements in rat. A similar LC‐MS/MS assay was used to measure vasopressin in human plasma, again using human plasma diluted with water (1 : 6) as a surrogate matrix, and this reported levels < 2 pg/ml in children 126. Tsukazaki et al. 127 developed an LC‐MS/MS assay for vasopressin, and showed that, correcting for plasma matrix effects, this assay gave close quantitative agreement with radioimmunoassay results from extracted human plasma samples, and had higher sensitivity and needed smaller sample volumes. So far, however, LC‐MS/MS assays have not been developed to become a practicable alternative for general use.
Recently, many studies have measured copeptin in plasma as a surrogate marker for vasopressin 128. Copeptin is a large glycoprotein product of the vasopressin precursor, and its large size (37 kDa) makes it much easier to measure. As a fragment of the vasopressin precursor, it is released in equimolar amounts as vasopressin: it has a similar half‐life to vasopressin in normal individuals and, in plasma, it circulates at approximately equimolar concentrations as the vasopressin that is measured by radioimmunoassay in extracted samples 129. No comparable surrogate marker for oxytocin has yet been identified.
Recommendations for validation of assays
Plasma matrix proteins interact differently with different antibodies: there is no single ‘radioimmunoassay’ and no single ‘ELISA’, and their susceptibility to plasma interference will vary with the antibody. Plasma proteins differ from individual to individual and differ substantially from species to species, and so any assay in unextracted plasma should be validated for the species in which it is measured and, ideally, in the individual in which it is measured.
It is natural to expect that measured levels should be consistent with measures of bioactivity. For vasopressin in man, testing this is straightforward. After a gastric water load, antidiuretic activity is minimal, as is evident from the production of highly dilute urine; conversely, high antidiuretic activity is evident after a modest period of dehydration from the production of highly concentrated urine. Thus, samples in these two conditions should show the extremes of very low and near maximal physiological levels. From bioassays and well‐validated radioimmunoassays, this range is from 1 to approximately 10 pg/ml in man. In mice or rats, validation could be supported by measurements in gene knockout animals or hypophysectomised animals, where vasopressin and/or oxytocin are completely absent.
There are no known conditions in which oxytocin is absent or grossly elevated in man. However, given the sensitivity of peripheral targets in man to very low concentrations, levels exceeding 10 pg/ml should be treated with scepticism. Levels from an individual could be verified by constructing a standard curve in hormone‐stripped plasma from that individual 93, although it would be impractical to do this for every individual sampled.
Whatever assay is employed, consideration must be given as to how the sample matrix affects it. Analytical verification by HPLC with chromatographic separation 78 can confirm that measurements reflect the actual peptide, although care is needed to ensure that all high molecular weight proteins are eluted from the column and are checked for assay interference. There should be quantitative agreement between the amount of hormone in the appropriate fraction, and the level reported by the assay.
Samples with high levels will not dilute in parallel to the standard curve if the levels arise from factors such as high salt levels or pH that interfere nonlinearly with antibody binding, although this test may not recognise protein interference that blocks antibody recognition of the antigen. Such interference will be apparent if, when samples are spiked with known amounts of hormone, the assay recovers amounts different to the expected amount. However, the absence of a difference is not conclusive because interference that reduces antibody affinity will lead to underestimation of added hormone, whereas interference that blocks antibody recognition will lead to overestimation, and both effects are likely to be present.
Measuring oxytocin or vasopressin in cerebrospinal fluid, urine or saliva should have fewer problems because of the relative absence of proteins but, in urine, high salt concentrations may cause problems. In a steady‐state, unbound oxytocin and vasopressin should distribute in extravascular fluids, and measurements in saliva might be useful for estimating steady‐state secretion 119, 130, 131. However, matrix interference can be a problem in measurements in saliva at least for some antibodies, again because of nonspecific interference with antibody–antigen binding 132.
Conclusions
The high levels of oxytocin and vasopressin reported by immunoassays in unextracted plasma probably arise from plasma protein interference with antibody binding that produces a high and wholly erroneous baseline. If so, these assays are, for unextracted plasma, no more than a random number generator, returning arbitrary values with a high variance and a skewed distribution. Nevertheless, this extensive literature is not without interest. If our analysis is correct, then this literature becomes a test of the conclusion of Ioannidis 133 that most published results are false, arising from a combination of underpowered studies, confirmation bias and publication bias, where apparent statistical significance is generated by ‘undisclosed researcher degrees of freedom’ 134. Indeed, none of the four studies cited in the Introduction 3, 4, 5, 6 as examples of the use of ELISAs to measure oxytocin and vasopressin in unextracted samples made any correction for multiple comparisons in their analyses.
The current impetus for measuring vasopressin and oxytocin in plasma derives from the assumption that such measurements are informative of the release of these peptides in the brain. The fallacies in this supposition have been discussed elsewhere 2. A recent systematic review has concluded that studies using ELISA on unextracted samples have produced no convincing evidence that peripheral vasopressin or oxytocin might be reliable biomarkers in psychiatric disorders 135. It would be a pity if studies based on unsound presumptions and erroneous measurements are taken as evidence that disturbances in peptide release within the brain are not involved in these conditions.
Conflicts of interest
The authors have no conflicts of interest to declare.
Acknowledgements
We thank Professors John Russell and Mike Ludwig for their helpful comments on earlier drafts of this manuscript. Research in Gareth Leng's laboratory is supported by the European Union's Seventh Framework Programme for research, technological development and demonstration (Grant No. 607310; Nudge‐it).
References
- 1. Ludwig M, Leng G. Dendritic peptide release and peptide‐dependent behaviours. Nat Rev Neurosci 2006; 7: 126–136. [DOI] [PubMed] [Google Scholar]
- 2. Leng G, Ludwig M. Intranasal oxytocin: myths and delusions. Biol Psychiatry 2016; 79: 243–250. [DOI] [PubMed] [Google Scholar]
- 3. Jobst A, Dehning S, Ruf S, Notz T, Buchheim A, Henning‐Fast K, Meissner D, Meyer S, Bondy B, Muller N, Zill P. Oxytocin and vasopressin levels are decreased in the plasma of male schizophrenia patients. Acta Neuropsychiatr 2014; 26: 347–355. [DOI] [PubMed] [Google Scholar]
- 4. Apter‐Levi Y, Zagoory‐Sharon O, Feldman R. Oxytocin and vasopressin support distinct configurations of social synchrony. Brain Res 2014; 1580: 124–132. [DOI] [PubMed] [Google Scholar]
- 5. Gouin JP, Pournajafi‐Nazarloo H, Carter CS. Changes in social functioning and circulating oxytocin and vasopressin following the migration to a new country. Physiol Behav 2015; 139: 67–72. [DOI] [PubMed] [Google Scholar]
- 6. Rubin LH, Carter CS, Bishop JR, Pournajafi‐Nazarloo H, Drogos LL, Hill SK, Ruocco AC, Keedy SK, Reilly JL, Keshavan MS, Pearlson GD, Tamminga CA, Gershon ES, Sweeney JA. Reduced levels of vasopressin and reduced behavioral modulation of oxytocin in psychotic disorders. Schizophr Bull 2014; 40: 1374–1384. [DOI] [PMC free article] [PubMed] [Google Scholar]
- 7. Dale HH. On some physiological actions of ergot. J Physiol 1906; 34: 163–206. [DOI] [PMC free article] [PubMed] [Google Scholar]
- 8. Bell WB. The pituitary body and the therapeutic value of the infundibular extract in shock, uterine atony, and intestinal paresis. Br Med J 1909; 2: 1609–1613. [DOI] [PMC free article] [PubMed] [Google Scholar]
- 9. Watson BP. Pituitary extract in obstetrical practice. Can Med Assoc J 1913; 3: 739–758. [PMC free article] [PubMed] [Google Scholar]
- 10. Editorial . Separation of the active principles of the posterior lobe of the pituitary gland. J Am Med Assoc 1928; 90: 618. [Google Scholar]
- 11. Dudley HW. Some observations on the active principles of the pituitary gland. J Pharmacol Exp Ther 1919; 14: 285–312. [Google Scholar]
- 12. Kamm O. The dialysis of pituitary extracts. Science 1928; 67: 199–200. [DOI] [PubMed] [Google Scholar]
- 13. Bangham DR, Mussett MV. Third international standard for posterior pituitary; re‐named third international standard for oxytocic, vasopressor and antidiuretic substances in 1956. Bull World Health Organ 1958; 19: 325–340. [PMC free article] [PubMed] [Google Scholar]
- 14. NIBSC . WHO International Standard, OXYTOCIN 4th International Standard, 2013. http://www.nibsc.org/documents/ifu/76-575.pdf. Accessed 8 June, 2016.
- 15. NIBSC . WHO International Standard, ARGININE VASOPRESSIN (AVP) 1st International Standard, 2013. http://www.nibsc.org/documents/ifu/77-501.pdf. Accessed 8 June 2016.
- 16. Leng G, Pineda R, Sabatier N, Ludwig M. 60 YEARS OF NEUROENDOCRINOLOGY: the posterior pituitary, from Geoffrey Harris to our present understanding. J Endocrinol 2015; 226: T173–T185. [DOI] [PubMed] [Google Scholar]
- 17. Gainer H, Sarne Y, Brownstein MJ. Neurophysin biosynthesis: conversion of a putative precursor during axonal transport. Science 1977; 195: 1354–1356. [DOI] [PubMed] [Google Scholar]
- 18. Gainer H, Sarne Y, Brownstein MJ. Biosynthesis and axonal transport of rat neurohypophysial proteins and peptides. J Cell Biol 1977; 73: 366–381. [DOI] [PMC free article] [PubMed] [Google Scholar]
- 19. Lee HJ, Macbeth AH, Pagani JH, Young WS 3rd. Oxytocin: the great facilitator of life. Prog Neurobiol 2009; 88: 127–151. [DOI] [PMC free article] [PubMed] [Google Scholar]
- 20. Morris JF. Hormone storage in individual neurosecretory granules of the pituitary gland: a quantitative ultrastructural approach to hormone storage in the neural lobe. J Endocrinol 1976; 68: 209–224. [DOI] [PubMed] [Google Scholar]
- 21. Nordmann JJ, Morris JF. Method for quantitating the molecular content of a subcellular organelle: hormone and neurophysin content of newly formed and aged neurosecretory granules. Proc Natl Acad Sci USA 1984; 81: 180–184. [DOI] [PMC free article] [PubMed] [Google Scholar]
- 22. Arrowsmith S, Wray S. Oxytocin: its mechanism of action and receptor signalling in the myometrium. J Neuroendocrinol 2014; 26: 356–369. [DOI] [PubMed] [Google Scholar]
- 23. Qureshi S, Galiveeti S, Bichet DG, Roth J. Diabetes insipidus: celebrating a century of vasopressin therapy. Endocrinology 2014; 155: 4605–4621. [DOI] [PubMed] [Google Scholar]
- 24. Juul KV, Bichet DG, Nielsen S, Norgaard JP. The physiological and pathophysiological functions of renal and extrarenal vasopressin V2 receptors. Am J Physiol Renal Physiol 2014; 306: F931–F940. [DOI] [PubMed] [Google Scholar]
- 25. Roper J, O'Carroll AM, Young W 3rd, Lolait S. The vasopressin Avpr1b receptor: molecular and pharmacological studies. Stress 2011; 14: 98–115. [DOI] [PMC free article] [PubMed] [Google Scholar]
- 26. Koshimizu TA, Nakamura K, Egashira N, Hiroyama M, Nonoguchi H, Tanoue A. Vasopressin V1a and V1b receptors: from molecules to physiological systems. Physiol Rev 2012; 92: 1813–1864. [DOI] [PubMed] [Google Scholar]
- 27. Dekanski J. The quantitative assay of vasopressin. Br J Pharmacol Chemother 1952; 7: 567–572. [DOI] [PMC free article] [PubMed] [Google Scholar]
- 28. Ginsburg M. A method for the assay of antidiuretic activity. Br J Pharmacol Chemother 1951; 6: 411–416. [DOI] [PMC free article] [PubMed] [Google Scholar]
- 29. Dettelbach HR. A method for assaying small amounts of antidiuretic substances with notes on some properties of vasopressin. Am J Physiol 1958; 192: 379–386. [DOI] [PubMed] [Google Scholar]
- 30. Heller J, Stulc J. [Significance of a new method of titration of antidiuretic hormone]. Cesk Fysiol 1959; 8: 194–195. [PubMed] [Google Scholar]
- 31. Czaczkes JW, Kleeman CR. The effect of various states of hydration and the plasma concentration on the turnover of antidiuretic hormone in mammals. J Clin Invest 1964; 43: 1649–1658. [DOI] [PMC free article] [PubMed] [Google Scholar]
- 32. Yoshida S, Motohashi K, Ibayashi H, Okinaka S. Method for the assay of antidiuretic hormone in plasma with a note on the antidiuretic titer of human plasma. J Lab Clin Med 1963; 62: 279–285. [PubMed] [Google Scholar]
- 33. Segar WE, Moore WW. The regulation of antidiuretic hormone release in man: I. Effects of change in position and ambient temperature on blood ADH levels. J Clin Invest 1968; 47: 2143–2151. [DOI] [PMC free article] [PubMed] [Google Scholar]
- 34. Davies R, Forsling M, Bulger G, Phillips T. Plasma vasopressin and blood pressure. Studies in normal subjects and in benign essential hypertension at rest and after postural challenge. Br Heart J 1983; 49: 528–531. [DOI] [PMC free article] [PubMed] [Google Scholar]
- 35. Zerbe RL, Henry DP, Robertson GL. Vasopressin response to orthostatic hypotension. Etiologic and clinical implications. Am J Med 1983; 74: 265–271. [DOI] [PubMed] [Google Scholar]
- 36. Os I, Kjeldsen SE, Aakesson I, Skjoto J, Westheim A, Eide I, Leren P. Arteriovenous difference of plasma vasopressin in normal man and effect of posture. Acta Physiol Scand 1984; 122: 49–53. [DOI] [PubMed] [Google Scholar]
- 37. Takamata A, Mack GW, Stachenfeld NS, Nadel ER. Body temperature modification of osmotically induced vasopressin secretion and thirst in humans. Am J Physiol 1995; 269: R874–R880. [DOI] [PubMed] [Google Scholar]
- 38. Sharif‐Naeini R, Ciura S, Bourque CW. TRPV1 gene required for thermosensory transduction and anticipatory secretion from vasopressin neurons during hyperthermia. Neuron 2008; 58: 179–185. [DOI] [PubMed] [Google Scholar]
- 39. Share L. Vasopressin, its bioassay and the physiological control of its release. Am J Med 1967; 42: 701–712. [DOI] [PubMed] [Google Scholar]
- 40. Theobald GW. Oxytocin reassessed. Obstet Gynecol Surv 1968; 23: 109–131. [DOI] [PubMed] [Google Scholar]
- 41. Fabian M, Forsling ML, Jones JJ, Lee J. The release, clearance and plasma protein binding of oxytocin in the anaesthetized rat. J Endocrinol 1969; 43: 175–189. [DOI] [PubMed] [Google Scholar]
- 42. Fabian M, Forsling ML, Jones JJ, Lee J. Comparison of two methods for the bioassay of oxytocin. Endocrinology 1969; 85: 600–603. [DOI] [PubMed] [Google Scholar]
- 43. Fabian M, Forsling ML, Jones JJ, Pryor JS. The clearance and antidiuretic potency of neurohypophysial hormones in man, and their plasma binding and stability. J Physiol 1969; 204: 653–668. [DOI] [PMC free article] [PubMed] [Google Scholar]
- 44. Andersen LJ, Andersen JL, Schutten HJ, Warberg J, Bie P. Antidiuretic effect of subnormal levels of arginine vasopressin in normal humans. Am J Physiol 1990; 259: R53–R60. [DOI] [PubMed] [Google Scholar]
- 45. Hollander W Jr, Williams TF, Fordham CC 3rd, Welt LG. A study of the quantitative relationship between antidiuretic hormone (vasopressin) and the renal tubular reabsorption of water. J Clin Invest 1957; 36: 1059–1071. [DOI] [PMC free article] [PubMed] [Google Scholar]
- 46. Raisz LG, Mc NW, Saxon L. Studies on the renal concentrating mechanism. I. Role of vasopressin. J Lab Clin Med 1958; 52: 437–445. [PubMed] [Google Scholar]
- 47. Shannon JA. The control of the renal excretion of water. II. The rate of liberation of the posterior pituitary antidiuretic hormone in the dog. J Exp Med 1942; 76: 387–399. [DOI] [PMC free article] [PubMed] [Google Scholar]
- 48. Baerwolff M, Bie P. Effects of subpicomolar changes in vasopressin on urinary concentration. Am J Physiol 1988; 255: R940–R945. [DOI] [PubMed] [Google Scholar]
- 49. Ginsburg M, Smith MW. The fate of oxytocin in male and female rats. Br J Pharmacol Chemother 1959; 14: 327–333. [DOI] [PMC free article] [PubMed] [Google Scholar]
- 50. Robinson IC, Walker JM. Bioassay of oxytocin on the superfused mammary gland of the mouse, using an automatic apparatus. Br J Pharmacol 1974; 50: 409–417. [PMC free article] [PubMed] [Google Scholar]
- 51. Theobald GW. The separate release of oxytocin and antidiuretic hormone. J Physiol 1959; 149: 443–461. [DOI] [PMC free article] [PubMed] [Google Scholar]
- 52. Saameli K. An indirect method for the estimation of oxytocin blood concentration and half‐life in pregnant women near term. Am J Obstet Gynecol 1963; 85: 186–192. [DOI] [PubMed] [Google Scholar]
- 53. Leake RD, Weitzman RE, Fisher DA. Pharmacokinetics of oxytocin in the human subject. Obstet Gynecol 1980; 56: 701–704. [PubMed] [Google Scholar]
- 54. Leake RD, Weitzman RE, Glatz TH, Fisher DA. Plasma oxytocin concentrations in men, nonpregnant women, and pregnant women before and during spontaneous labor. J Clin Endocrinol Metab 1981; 53: 730–733. [DOI] [PubMed] [Google Scholar]
- 55. Thornton S, Davison JM, Baylis PH. Plasma oxytocin during the first and second stages of spontaneous human labour. Acta Endocrinol (Copenh) 1992; 126: 425–429. [DOI] [PubMed] [Google Scholar]
- 56. Blanks AM, Thornton S. The role of oxytocin in parturition. BJOG 2003; 110(Suppl 20): 46–51. [DOI] [PubMed] [Google Scholar]
- 57. Budden A, Chen LJ, Henry A. High‐dose versus low‐dose oxytocin infusion regimens for induction of labour at term. Cochrane Database Syst Rev 2014; 10: CD009701. [DOI] [PMC free article] [PubMed] [Google Scholar]
- 58. Dawood MY. Evolving concepts of oxytocin for induction of labor. Am J Perinatol 1989; 6: 167–172. [DOI] [PubMed] [Google Scholar]
- 59. Weeks A. The prevention and treatment of postpartum haemorrhage: what do we know, and where do we go to next? BJOG 2015; 122: 202–210. [DOI] [PubMed] [Google Scholar]
- 60. Jovanovic A, Jovanovic S, Tulic I, Grbovic L. Effect of oxytocin as a partial agonist at vasoconstrictor vasopressin receptors on the human isolated uterine artery. Br J Pharmacol 1997; 121: 1468–1474. [DOI] [PMC free article] [PubMed] [Google Scholar]
- 61. Gaitan E, Cobo E, Mizrachi M. Evidence for the differential secretion of oxytocin and vasopressin in man. J Clin Invest 1964; 43: 2310–2322. [DOI] [PMC free article] [PubMed] [Google Scholar]
- 62. Sala NL, Luther EC, Arballo JC, Cordero Funes JC. Oxytocin reproducing reflex milk ejection in lactating women. J Appl Physiol 1974; 36: 154–158. [DOI] [PubMed] [Google Scholar]
- 63. Cobo E. Hormonal control of labor. Rev Colomb Obstet Ginecol 1970; 21: 455–469. [PubMed] [Google Scholar]
- 64. Ueda T, Yokoyama Y, Irahara M, Aono T. Influence of psychological stress on suckling‐induced pulsatile oxytocin release. Obstet Gynecol 1994; 84: 259–262. [PubMed] [Google Scholar]
- 65. Wakerley JB, Lincoln DW. Intermittent release of oxytocin during suckling in the rat. Nat New Biol 1971; 233: 180–181. [DOI] [PubMed] [Google Scholar]
- 66. Leng G, Bicknell R. Hormone release from the neural lobe In: Gross PM, ed. Circumventricular Organs and Body Fluids, vol. III Boca Raton, FL: CRC Press, 1987: 47–62. [Google Scholar]
- 67. Lee HB, Blaufox MD. Blood volume in the rat. J Nucl Med 1985; 26: 72–76. [PubMed] [Google Scholar]
- 68. Higuchi T, Tadokoro Y, Honda K, Negoro H. Detailed analysis of blood oxytocin levels during suckling and parturition in the rat. J Endocrinol 1986; 110: 251–256. [DOI] [PubMed] [Google Scholar]
- 69. Ellendorff F, Forsling ML, Poulain DA. The milk ejection reflex in the pig. J Physiol 1982; 333: 577–594. [DOI] [PMC free article] [PubMed] [Google Scholar]
- 70. Ellendorff F, Schams D. Characteristics of milk ejection, associated intramammary pressure changes and oxytocin release in the mare. J Endocrinol 1988; 119: 219–227. [DOI] [PubMed] [Google Scholar]
- 71. Stahl WR. Organ weights in primates and other mammals. Science 1965; 150: 1039–1042. [DOI] [PubMed] [Google Scholar]
- 72. Chard T, Boyd NR, Forsling ML, McNeilly AS, Landon J. The development of a radioimmunoassay for oxytocin: the extraction of oxytocin from plasma, and its measurement during parturition in human and goat blood. J Endocrinol 1970; 48: 223–234. [DOI] [PubMed] [Google Scholar]
- 73. Chard T, Forsling ML, James MA, Kitau MJ, Landon J. The development of a radioimmunoassay for oxytocin: sensitivity of the assay in aqueous buffer solution, specificity and the dissociation of immunological and biological activity. J Endocrinol 1970; 46: 533–542. [DOI] [PubMed] [Google Scholar]
- 74. Chard T, Kitau MJ, Landon J. The development of a radioimmunoassay for oxytocin: radioiodination, antibody production and separation techniques. J Endocrinol 1970; 46: 269–278. [DOI] [PubMed] [Google Scholar]
- 75. Chan WY, Wo NC, Stoev ST, Cheng LL, Manning M. Discovery and design of novel and selective vasopressin and oxytocin agonists and antagonists: the role of bioassays. Exp Physiol 2000; 85S: 7S–18S. [DOI] [PubMed] [Google Scholar]
- 76. Chard T. The radioimmunoassay of oxytocin and vasopressin. J Endocrinol 1973; 58: 143–160. [DOI] [PubMed] [Google Scholar]
- 77. Rodbard D, Lewald JE. Computer analysis of radioligand assay and radioimmunoassay data. Acta Endocrinol Suppl (Copenh) 1970; 147: 79–103. [DOI] [PubMed] [Google Scholar]
- 78. Robertson GL, Klein LA, Roth J, Gorden P. Immunoassay of plasma vasopressin in man. Proc Natl Acad Sci USA 1970; 66: 1298–1305. [DOI] [PMC free article] [PubMed] [Google Scholar]
- 79. Martin MJ, Chard T, Landon J. The development of a radioimmunoassay for bovine neurophysin. J Endocrinol 1972; 52: 481–495. [DOI] [PubMed] [Google Scholar]
- 80. Harvey RF, Dowsett L, Hartog M, Read AE. Radioimmunoassay of cholecystokinin‐pancreozymin. Gut 1974; 15: 690–699. [DOI] [PMC free article] [PubMed] [Google Scholar]
- 81. Christensen MS. A sensitive radioimmunoassay of parathyroid hormone in human serum using a specific extraction procedure. Scand J Clin Lab Invest 1976; 36: 313–322. [DOI] [PubMed] [Google Scholar]
- 82. Spencer CA, Challand GS. Interference in a radioimmunoassay for human thyrotropin. Clin Chem 1977; 23: 584–588. [PubMed] [Google Scholar]
- 83. Weir GC, Turner RC, Martin DB. Glucagon radioimmunoassay using antiserum 30K: interference by plasma. Horm Metab Res 1973; 5: 241–244. [DOI] [PubMed] [Google Scholar]
- 84. Byrnes DJ, Marjason JP. Radioimmunoassay of secretin in plasma. Horm Metab Res 1976; 8: 361–365. [DOI] [PubMed] [Google Scholar]
- 85. Schaffalitzky de Muckadell OB, Fahrenkrug J. Radioimmunoassay of secretin in plasma. Scand J Clin Lab Invest 1977; 37: 155–162. [DOI] [PubMed] [Google Scholar]
- 86. Page LB, Dessaulles E, Lagg S, Haber E. Interference with immunoassays of angiotensin I and II by proteins in human plasma. Clin Chim Acta 1971; 34: 55–62. [DOI] [PubMed] [Google Scholar]
- 87. Nadeau A, Zahnd GR. Corrections for protein interference in rat growth hormone immunoassay. Horm Metab Res 1971; 3(Suppl 3): 40–45. [PubMed] [Google Scholar]
- 88. Fahrenkrug J, Schaffalitzky de Muckadell OV. Radioimmunoassay of vasoactive intestinal polypeptide (VIP) in plasma. J Lab Clin Med 1977; 89: 1379–1388. [PubMed] [Google Scholar]
- 89. Burr IM, Grant DB, Sizonenko PC, Kaplan SL, Grumbach MM. Some critical factors in double antibody radioimmunoassay systems utilizing sheep anti‐rabbit precipitating sera for measurement of human serum LH, FSH and HGH. J Clin Endocrinol Metab 1969; 29: 948–956. [DOI] [PubMed] [Google Scholar]
- 90. Caraty A, de Reviers MM, Pelletier J, Dubois MP. Reassessment of LRF radioimmunoassay in the plasma and hypothalamic extracts of rats and rams. Reprod Nutr Dev 1980; 20: 1489–1501. [DOI] [PubMed] [Google Scholar]
- 91. Baylis PH, Heath DA. The development of a radioimmunoassay for the measurement of human plasma arginine vasopressin. Clin Endocrinol (Oxf) 1977; 7: 91–102. [DOI] [PubMed] [Google Scholar]
- 92. Fyhrquist F, Wallenius M, Hollemans HJ. Radioimmunoassay of vasopressin in unextracted plasma. Scand J Clin Lab Invest 1976; 36: 841–847. [DOI] [PubMed] [Google Scholar]
- 93. Henneberry HP, Slater JD, Eisen V, Fuhr S. Arginine vasopressin response to hypertonicity in hypertension studied by arginine vasopressin assay in unextracted plasma. J Hypertens 1992; 10: 221–228. [DOI] [PubMed] [Google Scholar]
- 94. Dawood MY, Raghavan KS, Pociask C. Radioimmunoassay of oxytocin. J Endocrinol 1978; 76: 261–270. [DOI] [PubMed] [Google Scholar]
- 95. Schams D. Oxytocin determination by radioimmunoassay. III. Improvement to subpicogram sensitivity and application to blood levels in cyclic cattle. Acta Endocrinol (Copenh) 1983; 103: 180–183. [PubMed] [Google Scholar]
- 96. Chiodera P, Louis F, Legros JJ. Simultaneous radioimmunoassay for plasma arginine‐vasopressin and oxytocin using DEAE Sephadex A 25 extraction. J Endocrinol Invest 1984; 7: 287–293. [DOI] [PubMed] [Google Scholar]
- 97. Sheldrick EL, Flint AP. Circulating concentrations of oxytocin during the estrous cycle and early pregnancy in sheep. Prostaglandins 1981; 22: 631–636. [DOI] [PubMed] [Google Scholar]
- 98. Landgraf R. Plasma oxytocin concentrations in man after different routes of administration of synthetic oxytocin. Exp Clin Endocrinol 1985; 85: 245–248. [DOI] [PubMed] [Google Scholar]
- 99. Burd JM, Weightman DR, Baylis PH. Solid phase radioimmunoassay for direct measurement of human plasma oxytocin. J Immunoassay 1985; 6: 227–243. [DOI] [PubMed] [Google Scholar]
- 100. Robinson AG, Frantz AG. Radioimmunoassay of posterior pituitary peptides: a review. Metabolism 1973; 22: 1047–1057. [DOI] [PubMed] [Google Scholar]
- 101. Szeto A, McCabe PM, Nation DA, Tabak BA, Rossetti MA, McCullough ME, Schneiderman N, Mendez AJ. Evaluation of enzyme immunoassay and radioimmunoassay methods for the measurement of plasma oxytocin. Psychosom Med 2011; 73: 393–400102. [DOI] [PMC free article] [PubMed] [Google Scholar]
- 102. Nomura S, Ito T, Yamamoto E, Sumigama S, Iwase A, Okada M, Shibata K, Ando H, Ino K, Kikkawa F, Mizutani S. Gene regulation and physiological function of placental leucine aminopeptidase/oxytocinase during pregnancy. Biochim Biophys Acta 2005; 1751: 19–25. [DOI] [PubMed] [Google Scholar]
- 103. Lauson HD, Bocanegra M. Clearance of exogenous vasopressin from plasma of dogs. Am J Physiol 1961; 200: 493–497. [DOI] [PubMed] [Google Scholar]
- 104. Ginsburg M, Heller H. The clearance of injected vasopressin from the circulation and its fate in the body. J Endocrinol 1953; 9: 283–291. [DOI] [PubMed] [Google Scholar]
- 105. Hasan SH. The clearance of vasopressin and deaminovasopressin from the circulation of normal and hypercalcaemic rabbits. J Endocrinol 1970; 47: 135–136. [DOI] [PubMed] [Google Scholar]
- 106. Ang VT, Jenkins JS. Blood‐cerebrospinal fluid barrier to arginine‐vasopressin, desmopressin and desglycinamide arginine‐vasopressin in the dog. J Endocrinol 1982; 93: 319–325. [DOI] [PubMed] [Google Scholar]
- 107. Benmansour M, Rainfray M, Paillard F, Ardaillou R. Metabolic clearance rate of immunoreactive vasopressin in man. Eur J Clin Invest 1982; 12: 475–480. [DOI] [PubMed] [Google Scholar]
- 108. Argent NB, Wilkinson R, Baylis PH. Metabolic clearance rate of arginine vasopressin in severe chronic renal failure. Clin Sci (Lond) 1992; 83: 583–587. [DOI] [PubMed] [Google Scholar]
- 109. Kowalski WB, Diveky L, Mehendale R, Parsons M, Wilson L Jr. Effect of pregnancy on the metabolic clearance rate and the volume of distribution of oxytocin in the baboon. Am J Physiol 1998; 274: E791–E795. [DOI] [PubMed] [Google Scholar]
- 110. Thornton S, Davison JM, Baylis PH. Effect of human pregnancy on metabolic clearance rate of oxytocin. Am J Physiol 1990; 259: R21–R24. [DOI] [PubMed] [Google Scholar]
- 111. Bjerner J, Bormer OP, Nustad K. The war on heterophilic antibody interference. Clin Chem 2005; 51: 9–11. [DOI] [PubMed] [Google Scholar]
- 112. Prakash BS, Metten M, Schams D, Wuttke W. Development of a sensitive enzymeimmunoassay for oxytocin determination in bovine plasma. Anim Reprod Sci 1998; 51: 185–194. [DOI] [PubMed] [Google Scholar]
- 113. Designs A. Oxytocin Enzyme Immunoassay (EIA) kit: Manufacturer's instructions. Available at: http://www.enzolifesciences.com/fileadmin/redacteur/pdf/adi/ADI-900-153.pdf.
- 114. McCullough ME, Churchland PS, Mendez AJ. Problems with measuring peripheral oxytocin: can the data on oxytocin and human behavior be trusted? Neurosci Biobehav Rev 2013; 37: 1485–1492. [DOI] [PubMed] [Google Scholar]
- 115. Jones CW, Pickering BT. Intra‐axonal transport and turnover of neurohypophysial hormones in the rat. J Physiol 1972; 227: 553–564. [DOI] [PMC free article] [PubMed] [Google Scholar]
- 116. Robinson KJ, Hazon N, Lonergan M, Pomeroy PP. Validation of an enzyme‐linked immunoassay (ELISA) for plasma oxytocin in a novel mammal species reveals potential errors induced by sampling procedure. J Neurosci Meth 2014; 226: 73–79. [DOI] [PubMed] [Google Scholar]
- 117. Christensen JC, Shiyanov PA, Estepp JR, Schlager JJ. Lack of association between human plasma oxytocin and interpersonal trust in a Prisoner's Dilemma paradigm. PLoS ONE 2014; 9: e116172. [DOI] [PMC free article] [PubMed] [Google Scholar]
- 118. Kramer KM, Choe C, Carter CS, Cushing BS. Developmental effects of oxytocin on neural activation and neuropeptide release in response to social stimuli. Horm Behav 2006; 49: 206–214. [DOI] [PubMed] [Google Scholar]
- 119. Carter CS, Pournajafi‐Nazarloo H, Kramer KM, Ziegler TE, White‐Traut R, Bello D, Schwertz D. Oxytocin: behavioral associations and potential as a salivary biomarker. Ann N Y Acad Sci 2007; 1098: 312–322. [DOI] [PubMed] [Google Scholar]
- 120. Wismer Fries AB, Ziegler TE, Kurian JR, Jacoris S, Pollak SD. Early experience in humans is associated with changes in neuropeptides critical for regulating social behavior. Proc Natl Acad Sci USA 2005; 102: 17237–17240. [DOI] [PMC free article] [PubMed] [Google Scholar]
- 121. Anderson GM. Report of altered urinary oxytocin and AVP excretion in neglected orphans should be reconsidered. J Autism Dev Disord 2006; 36: 829–830. [DOI] [PubMed] [Google Scholar]
- 122. Devarajan K, Rusak B. Oxytocin levels in the plasma and cerebrospinal fluid of male rats: effects of circadian phase, light and stress. Neurosci Lett 2004; 367: 144–147. [DOI] [PubMed] [Google Scholar]
- 123. Russell JA, Leng G, Douglas AJ. The magnocellular oxytocin system, the fount of maternity: adaptations in pregnancy. Front Neuroendocrinol 2003; 24: 27–61. [DOI] [PubMed] [Google Scholar]
- 124. Jenkins R, Duggan JX, Aubry AF, Zeng J, Lee JW, Cojocaru L, Dufield D, Garofolo F, Kaur S, Schultz GA, Xu K, Yang Z, Yu J, Zhang YJ, Vazvaei F. Recommendations for validation of LC‐MS/MS bioanalytical methods for protein biotherapeutics. AAPS J 2015; 17: 1–16. [DOI] [PMC free article] [PubMed] [Google Scholar]
- 125. Zhang G, Zhang Y, Fast DM, Lin Z, Steenwyk R. Ultra sensitive quantitation of endogenous oxytocin in rat and human plasma using a two‐dimensional liquid chromatography‐tandem mass spectrometry assay. Anal Biochem 2011; 416: 45–52. [DOI] [PubMed] [Google Scholar]
- 126. Zhang D, Rios DR, Tam VH, Chow DS. Development and validation of a highly sensitive LC‐MS/MS assay for the quantification of arginine vasopressin in human plasma and urine: application in preterm neonates and child. J Pharm Biomed Anal 2014; 99: 67–73. [DOI] [PubMed] [Google Scholar]
- 127. Tsukazaki Y, Senda N, Kubo K, Yamada S, Kugoh H, Kazuki Y, Oshimura M. Development of a high‐sensitivity quantitation method for arginine vasopressin by high‐performance liquid chromatography tandem mass spectrometry, and comparison with quantitative values by radioimmunoassay. Anal Sci 2016; 32: 153–159. [DOI] [PubMed] [Google Scholar]
- 128. Fenske W, Sandner B, Christ‐Crain M. A copeptin‐based classification of the osmoregulatory defects in the syndrome of inappropriate antidiuresis. Best Pract Res Clin Endocrinol Metab 2016; 30: 219–233. [DOI] [PubMed] [Google Scholar]
- 129. Balanescu S, Kopp P, Gaskill MB, Morgenthaler NG, Schindler C, Rutishauser J. Correlation of plasma copeptin and vasopressin concentrations in hypo‐, iso‐, and hyperosmolar States. J Clin Endocrinol Metab 2011; 96: 1046–1052. [DOI] [PubMed] [Google Scholar]
- 130. Jong TR, Menon R, Bludau A, Grund T, Biermeier V, Klampfl SM, Jurek B, Bosch OJ, Hellhammer J, Neumann ID. Salivary oxytocin concentrations in response to running, sexual self‐stimulation, breastfeeding and the TSST: the Regensburg Oxytocin Challenge (ROC) study. Psychoneuroendocrinology 2015; 62: 381–388. [DOI] [PubMed] [Google Scholar]
- 131. Frijling JL, van Zuiden M, Nawijn L, Koch SB, Neumann ID, Veltman DJ, Olff M. Salivary oxytocin and vasopressin levels in police officers with and without post‐traumatic stress disorder. J Neuroendocrinol 2015; 27: 743–751. [DOI] [PubMed] [Google Scholar]
- 132. Horvat‐Gordon M, Granger DA, Schwartz EB, Nelson VJ, Kivlighan KT. Oxytocin is not a valid biomarker when measured in saliva by immunoassay. Physiol Behav 2005; 84: 445–448. [DOI] [PubMed] [Google Scholar]
- 133. Ioannidis JP. Why most published research findings are false. PLoS Med 2005; 2: e124. [DOI] [PMC free article] [PubMed] [Google Scholar]
- 134. Simmons JP, Nelson LD, Simonsohn U. False‐positive psychology: undisclosed flexibility in data collection and analysis allows presenting anything as significant. Psychol Sci 2011; 22: 1359–1366. [DOI] [PubMed] [Google Scholar]
- 135. Rutigliano G, Rocchetti M, Paloyelis Y, Gilleen J, Sardella A, Cappucciati M, Palombini E, Dell'Osso L, Caverzasi E, Politi P, McGuire P, Fusar‐Poli P. Peripheral oxytocin and vasopressin: biomarkers of psychiatric disorders? A comprehensive systematic review and preliminary meta‐analysis Psychiatry Res 2016; 241: 207–220. [DOI] [PubMed] [Google Scholar]