

Summary
With increasing number of therapies available for the treatment of multiple myeloma, it is timely to examine the course of patients' journeys. We investigated patient characteristics, treatment durations and outcomes, and symptom burden across the treatment pathway in Belgium, France, Germany, Italy, Spain, Switzerland and the UK. In total, 435 physicians retrospectively reviewed 4997 patient charts. Profiles of patients diagnosed with multiple myeloma during the last 12 months were similar across countries; bone pain was the most common presentation. Median duration of first‐line therapy was 6 months, followed by a median treatment‐free interval of 10 months; both these decreased with increasing lines of therapy, as did time to progression. Depth of response, as assessed by the treating physician, also decreased with each additional line of therapy: 74% of patients achieved at least a very good partial response at first line, compared with only 11% at fifth line. Deeper responses were associated with longer time to progression, although these were physician‐judged. Toxicities and co‐morbidities increased with later treatment lines, and were more likely to have led to discontinuation of treatment. These real‐world data provide an insight into patient outcomes and treatment decisions being made in clinical practice.
Keywords: multiple myeloma, real‐world practice, patient chart review, duration of therapy, depth of response
Since the start of the 21st century, traditional melphalan‐based regimens for the treatment of multiple myeloma (MM) have largely been replaced by novel agents (with the exception of high‐dose melphalan). These new agents include the immunomodulatory drugs thalidomide, lenalidomide and pomalidomide, and the proteasome inhibitors bortezomib and carfilzomib (http://www.ema.europa.eu/docs/en_GB/document_library/EPAR_-_Product_Information/human/003790/WC500197692.pdf, Richardson et al, 2015; Torimoto et al, 2015). In the last 12 months, the histone de‐acetylase inhibitor, panobinostat, the antibodies, daratumumab and elotuzumab, and the oral proteasome inhibitor, ixazomib, have all been licensed for the treatment of relapsed MM. New regimens and treatment sequences have ultimately improved outcomes (Benboubker et al, 2014; San‐Miguel et al, 2014; Stewart et al, 2015). Although such regimens have been assessed in clinical trials, little is known about the current management of MM in clinical practice.
An important concern in the management of MM is whether the cumulative burden of relapsing‐remitting disease limits the use of new therapies. Treatment‐emergent neurotoxicity, gastro‐intestinal side effects, infections, thromboembolic events and cytopenias are associated with poor performance status and are likely to compromise the timely delivery of treatment and may thus contribute to early disease progression. Patient recruitment for clinical trials is highly selective, often using good performance status as an eligibility criterion and so the extent to which study populations represent real‐world patients is unclear. Information is therefore needed on how symptom and toxicity burdens affect the use of effective myeloma therapies, particularly in later lines of treatment.
Patients and treating physicians also lack data describing the periods on and off treatment in large unselected real‐world MM populations. These intervals influence treatment outcomes and could guide treatment decisions in everyday clinical practice.
We have conducted a patient chart review in order to characterize the management of patients with symptomatic MM in seven European countries.
Methods
This study aimed to map the course of patients with MM and to investigate the factors that influence treatment decisions at different stages of the treatment pathway.
Physicians and patients
An observational chart review was performed during 2014, in Belgium, France, Germany, Italy, Spain, Switzerland and the UK. Physicians were required to obtain prospective approval of the study protocol and all relevant study documents from their local ethics committee, if applicable. Ethics committee approval was received in Germany and Spain in line with national regulations in these countries. The remaining countries did not require ethics committee approval because the study was completely anonymous, with no identifiable patient information.
Physicians completed an initial questionnaire to ensure they met the following eligibility criteria: manage at least 10 patients with MM per month; at least 3 years' clinical practice experience; and be personally responsible for initiating treatment in MM patients. Quotas per region and hospital type were predefined to ensure a representative sample.
In total, 435 haematologists, onco‐haematologists, oncologists and internists who treat patients with MM were selected. Overall, in all aspects of the chart review, the aim was to capture data for approximately 7500 patients.
Materials
The chart review consisted of a cross‐sectional and a retrospective component (Appendix S1), completed concurrently by participating physicians. In the cross‐sectional component, physicians completed a census form for each patient they saw with symptomatic MM during a 2–4‐week observation period, collecting information relating to patient characteristics and treatment. In the retrospective component, physicians completed a focus form for 12 patients (14 patients in the UK) who had completed specific lines of treatment. The first patient included by each physician was the most recent who had completed the relevant line of treatment; patients were selected in reverse chronological order thereafter. Data collected included patient and treatment characteristics since diagnosis, disease response and adverse events at the end of each line of treatment, reasons for stopping treatment, and planned future treatment at subsequent relapse. Quotas were predefined by line of therapy in order to ensure sufficient sample sizes in later lines where there is greater heterogeneity in patients and treatments (and less information on real‐world patient management).
To ensure consistency, physicians were provided with information on staging systems (Durie & Salmon, 1975; Greipp et al, 2005), European Cooperative Oncology Group (ECOG) performance status, level of response and definitions of treatment stages.
Results of the cross‐sectional part of the study are described elsewhere (Raab et al, 2016); data from the retrospective study component are reported here.
Weighting
The likelihood of inclusion of some patients in the cross‐sectional study varies because some patients are seen more frequently in consultation (e.g. newly diagnosed patients, those experiencing difficulties with their treatment, etc.) than others (e.g. those on treatment with fewer complications, those who are between lines of treatment, etc.). Therefore, a weighting system was put in place to adjust for the likelihood of inclusion.
Given that physicians were asked to document each patient seen in consultation during a pre‐defined inclusion period of 2–4 weeks, the probability of seeing each patient depended on the frequency of the patient's consultations: if this frequency is less than or equal to the inclusion period, the probability that the patient would be included in the research is 1. However, if the patient has consultations less frequently than the observation period (e.g. a patient who has one consultation per month), the inclusion probability is adjusted. For example: a physician who used a 2‐week observation period in this study could include a patient who is normally seen in consultation every 4 weeks. Therefore, the probability of including this patient in the research is 0·5. Patients with more frequent consultations were allocated a lower coefficient than those who were seen less often.
Data for the retrospective component were weighted according to the data obtained from the cross‐sectional portion using a matching technique (Carpenter & Bithell, 2000; van der Laan & Dudoit, 2003). This weighting was applied to reduce individual physician bias, so that the retrospective data were representative of overall treatment practices in each country. The final pooled analysis was adjusted for country contribution size.
Statistical analyses
Quantitative variables were described in terms of mean, median and standard deviation; qualitative variables were described as absolute percentage for each modality. Logistic regression analysis was used to quantify the effect of variables (patient and disease characteristics) on a dependent factor (whether or not further treatment was planned). The output of the logistic regressions was the odds ratio. Significance was tested using t‐tests for quantitative variables (significance set at P < 0·05) and χ 2 tests for categorical variables, with a two‐tailed probability threshold of 0·05 considered significant. No adjustments were made for multiplicity therefore, the results of significance testing should be considered hypothesis generating only.
Results
Patient and disease characteristics
A total of 435 physicians retrospectively reviewed 4997 patient charts. In the 6 months before inclusion in the study, 1802 of the patients had been treated up to the end of first line, 1380 up to the end of second line and 1815 up to the end of third line or later.
Physician characteristics have been described previously (Raab et al, 2015). Characteristics of the patients included in the retrospective chart review are detailed in Table 1. Just over half (58%) of the patients were male and the majority of patients (64%) were at least 65 years old; 42% were aged between 65 and 75 years and 22% were over 75 years old. These characteristics were consistent across lines of treatment (data not shown). Overall, the mean time between diagnosis and the inclusion of patients in the study was 19 months for patients who had completed first‐line treatment, 44 months for those who had completed second‐line treatment and 65 months for those who had completed a third or later line of treatment. However, this differed between countries: at second line, mean time since diagnosis ranged from 29 months in Germany to 54 months in Italy, and at third line it ranged from 49 months in Spain to 77 months in Italy.
Table 1.
Patient characteristics at study inclusion
| All | Belgium | France | Germany | Italy | Spain | Switzerland | UK | |
|---|---|---|---|---|---|---|---|---|
| n = 4997 | n = 124 | n = 827 | n = 1190 | n = 1005 | n = 1014 | n = 84 | n = 753 | |
| Sex (%) | ||||||||
| Male | 58 | 52 | 60 | 57 | 57 | 62 | 65 | 58 |
| Female | 42 | 48 | 40 | 43 | 43 | 38 | 35 | 42 |
| Age (%) | ||||||||
| <65 years | 36 | 32 | 33 | 35 | 38 | 38 | 31 | 40 |
| 65–75 years | 42 | 37 | 39 | 46 | 41 | 45 | 52 | 42 |
| >75 years | 22 | 31 | 28 | 19 | 21 | 17 | 18 | 18 |
| First‐line treatment | n = 1802 | n = 50 | n = 314 | n = 411 | n = 433 | n = 170 | n = 43 | n = 264 |
| Mean time since diagnosis (months) | 19 | 14 | 23 | 13 | 18 | 17 | 20 | 20 |
| Second‐line treatment | n = 1380 | n = 38 | n = 241 | n = 353 | n = 246 | n = 253 | n = 16 | n = 213 |
| Mean time since diagnosis (months) | 44 | 37 | 53 | 29 | 54 | 39 | 39 | 42 |
| Third‐line or later treatment | n = 1815 | n = 35 | n = 271 | n = 425 | n = 327 | n = 591 | n = 24 | n = 276 |
| Mean time since diagnosis (months) | 65 | 72 | 74 | 61 | 77 | 49 | 69 | 62 |
Percentages may not total 100% because of rounding. Patient numbers for all countries may differ from the total of the individual countries because of weighting of the data.
Disease characteristics (Table 2) are presented for patients who were diagnosed with MM in the 12 months before inclusion in the study (n = 831), to best reflect recent diagnostic techniques and clinical practice. The most common reason for diagnosis was bone pain (61%). Almost half (48%) of patients had more than one symptom or factor leading to diagnosis (data not shown).
Table 2.
Disease characteristics at diagnosis
| Disease characteristic | Patients, % |
|---|---|
| Total previous symptomatic multiple myeloma diagnoses | 16 |
| Previous known diagnosis of MGUS | 9 |
| Previously diagnosed with smouldering multiple myeloma | 7 |
| Circumstance of diagnosis | |
| Bone pain | 61 |
| Anaemia | 39 |
| Vertebral fracture | 21 |
| Renal dysfunction | 20 |
| Hypercalcaemia | 19 |
| Other fracture | 9 |
| Abnormal sedimentation | 7 |
| Incidental diagnosis | 7 |
| Infections | 3 |
| Spinal cord compression | 1 |
| Other | 3 |
| Clinical characteristics at diagnosis | |
| ≥2 bone lesions | 59 |
| Serum beta‐2 microglobulin ≥55 mg/l | 38 |
| Haemoglobin <85 g/l | 36 |
| Serum albumin <35 g/l | 25 |
| Calcaemia >3 mmol/l | 23 |
| Lactate dehydrogenase >300 u/l | 22 |
| Receiving dialysis | 2 |
| None of these | 7 |
| ECOG performance status at diagnosis | |
| 0 | 18 |
| 1 | 52 |
| 2 | 26 |
| 3–4 | 4 |
| ISS score at diagnosis (among those with known status, n = 815) | |
| I | 16 |
| II | 35 |
| III | 49 |
ECOG, Eastern Cooperative Oncology Group; ISS, International Staging System; MGUS, monoclonal gammopathy of unknown significance; U, unit.
Disease characteristics are described only for patients diagnosed with multiple myeloma in the 12 months before inclusion in the study (n = 831; median age 69 years).
The majority of patients received bortezomib‐containing regimens as first‐line treatment (53%); 22% received thalidomide‐containing regimens and a further 14% received bortezomib with thalidomide (Fig 1A). Lenalidomide was rarely used in first line (2%) but lenalidomide‐containing regimens were the most commonly used combinations at second line (46%) (Fig 1B).
Figure 1.
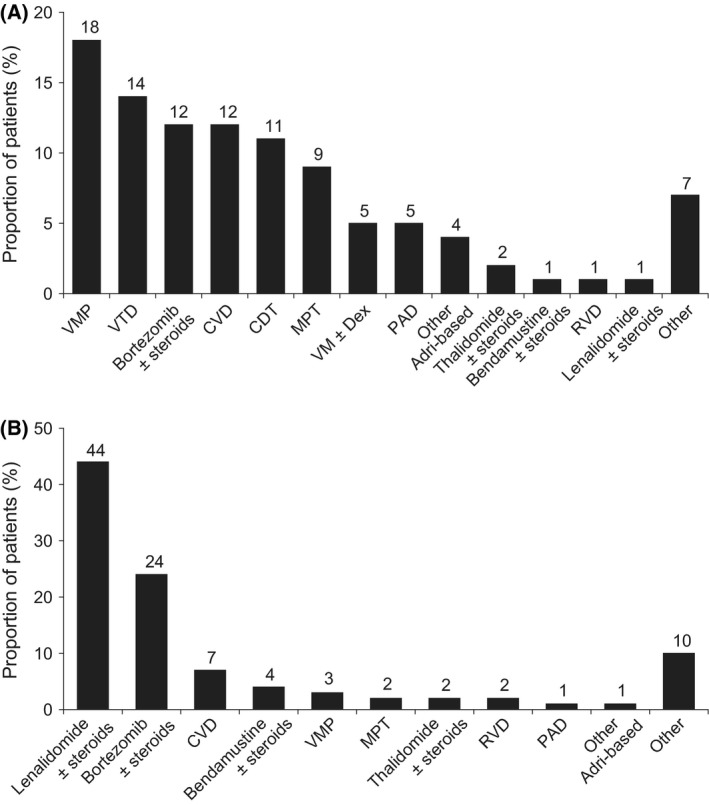
Treatment distribution: (A) first line (n = 1802); (B) second line (n = 1380). CDT, cyclophosphamide + dexamethasone + thalidomide; CVD, bortezomib (Velcade) + cyclophosphamide + dexamethasone; MPT, melphalan + prednisolone + thalidomide; RVD, lenalidomide + bortezomib + dexamethasone; PAD, bortezomib + doxorubicin (Adriamycin) + dexamethasone; VM, bortezomib (Velcade) + melphalan; VMP, bortezomib (Velcade) + melphalan + prednisone; VTD, bortezomib + thalidomide + dexamethasone.
Treatment duration and treatment‐free interval
The duration of treatment and length of the treatment‐free interval differed according to line of therapy (Fig 2). Fig 2 also shows the proportion of patients reaching each subsequent line of therapy (these data are derived partly from the cross‐sectional study). The median duration of first‐line treatment was 6 months (including the 7% of all patients who received consolidation therapy). This was followed by a median treatment‐free interval of 10 months. The median treatment‐free interval was longer for patients who received stem cell transplant (SCT) than for those who did not (16 vs. 7 months; P < 0·001). In the 12% of patients at first line who received maintenance treatment (defined as a new treatment prescribed after the regularly scheduled first‐line treatment is complete and the patient has achieved their maximum response), the median maintenance treatment duration was 6 months.
Figure 2.
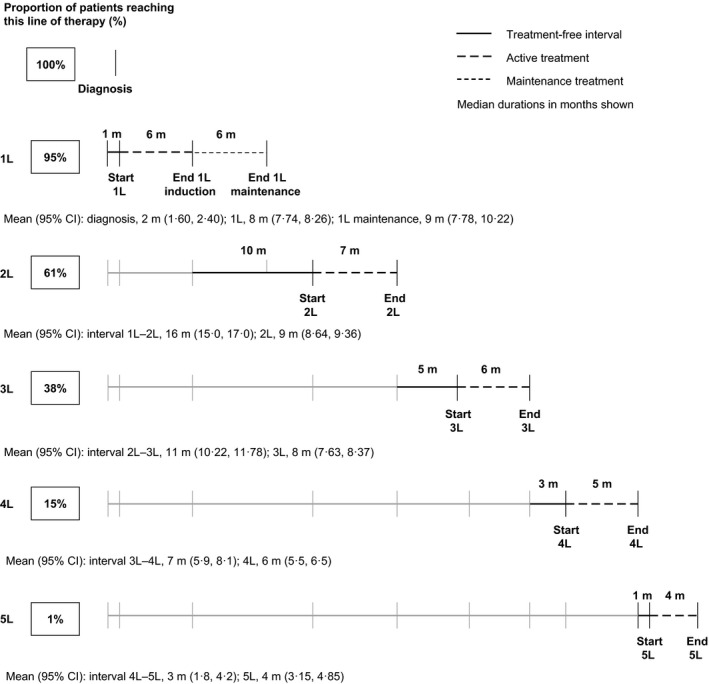
Treatment duration and treatment‐free intervals. Data on the proportion of patients who had received each line are from the cross‐sectional review; data on durations of treatment and treatment‐free intervals are from the retrospective review. 1L–5L, first line–fifth line; CI, confidence interval; m, month.
At second line, the median treatment duration was 7 months, followed by a treatment‐free interval of 5 months. Following later lines of treatment, treatment‐free intervals became progressively shorter, with only a 3‐month treatment‐free interval after third‐line treatment, and a 1‐month treatment‐free interval after fourth line. The duration of treatment was also progressively shorter at fourth and fifth lines.
Depth of response and time to progression
Physicians evaluated the best response achieved at each line of treatment (depth of response). Given the observational (non‐interventional) nature of the study, these results should be interpreted cautiously, as physicians' assessments were based on their usual practice and not necessarily on conventionally defined criteria (as is the case in clinical trials).
The proportion of patients achieving what their physician deemed to be a complete response (CR) decreased from 32% at first line to 4% at fourth line and 2% at fifth line (Fig S1). Similarly, 74% of patients achieved at least a very good partial response (VGPR) in the first‐line setting, compared with 11% at fifth line or later. Overall response rates [≥ partial response (PR)] also decreased with treatment lines. Patients who received SCT were significantly more likely to have a CR at first line than patients who did not receive SCT (47% vs. 25% of patients; P < 0·001).
The time from the start of a line of treatment to disease progression (time to progression, TTP) diminished in later therapy lines (Fig 3A). Median TTP for patients who completed first‐line treatment was 18 months, with 18% of patients progressing after 36 months or more. At second line, median TTP was 13 months, with 10% of patients progressing after 36 months or more. Median TTP for patients at third and fourth line was 7 and 5 months, respectively, with 1–3% of patients progressing after 36 months or more.
Figure 3.
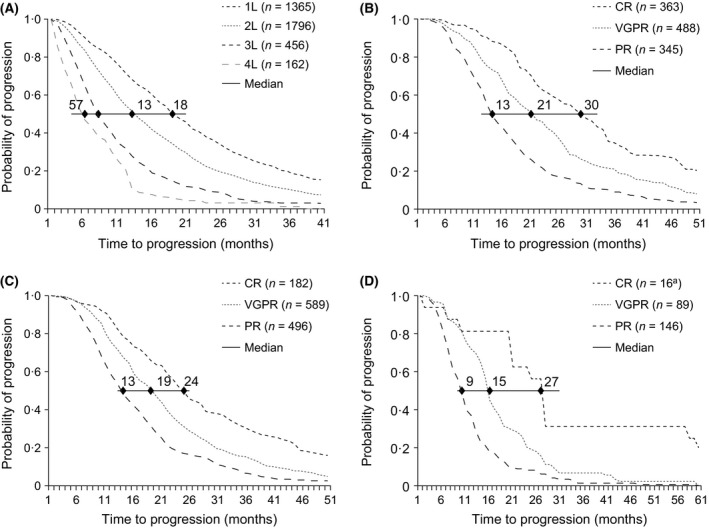
Time to progression (A) by line of treatment, and by depth of response to (B) first‐line treatment, (C) second‐line treatment, and (D) third‐line treatment. Only patients who had progressed at the time of inclusion in the study were included in this analysis. aThe number of patients with a CR at third line was too small to make an accurate estimate. 1L–5L, first line–fifth line; CR, complete response; PR, partial response; VGPR, very good partial response.
TTP was associated with the physician‐reported depth of response (Fig 3B–D). After first line, patients in CR had a median TTP of 30 months, compared with 21 months for those in VGPR, and 13 months in those in PR. Patients in CR after second line had a TTP of 24 months, compared with 19 and 13 months for those in VGPR and PR, respectively. Too few patients achieved CR at third line to estimate TTP; however, those in VGPR had a median TTP of 15 months, compared with 9 months for those in PR. In addition, across lines 1–3, about 30% of all patients with a physician‐reported CR did not have disease progression at 36 months after treatment initiation. This percentage was lower for those with a VGPR (19% at first line, 14% at second line, 9% at third line) and lower still in patients with a PR (9% at first line, 6% at second line, 1% at third line). Patients who had a physician‐reported VGPR or better at first line were more likely to achieve a VGPR or better at second line (53% vs. 21% of patients if they achieved worse than a VGPR at first line) (data not shown). A similar pattern was observed in later lines of therapy.
Factors associated with ending of treatment and further (planned) treatment
For patients who had just finished first‐line treatment, reasons for ending that line of treatment included stable disease or remission (55%; no definition of remission was specified in the questionnaire), planned end of treatment (38%) or disease progression (10%) (Fig 4).
Figure 4.

Reasons for ending treatment. Physicians could select more than one reason. 1L–5L, first line–fifth line.
The proportions of patients ending treatment because of stable disease or remission decreased with each line, to 13% of patients at fifth line or later. Patients at first line were more likely to have ended that line of treatment as planned than those at fifth line or later (38% vs. 7%). Only 10% of patients ended their first line of treatment because of disease progression but this proportion increased with each line, reaching 51% at fifth line or later. The proportion of patients ending treatment because of toxicity or poor performance status also increased with later lines of therapy (2% in patients at first line, compared with 20% for those at fifth or later lines).
Notably, in the subset of patients receiving lenalidomide at second line (n = 669), only 22% of patients were treated until progression (data not shown). In 58% of patients receiving lenalidomide whose treatment was discontinued before progression the reason cited was stable disease or remission, and 22% discontinued after reaching a planned end of treatment. Similar data were seen for patients treated with lenalidomide at third line (Fig 5).
Figure 5.

Reasons for ending lenalidomide treatment before progression.
Physicians were also asked about the next treatment line. Logistic regression analysis showed that several factors were significantly associated with the decision to continue to a further treatment line. Adverse events, comorbidities and old age were negatively associated with continuation, whereas good responses to the previous line of treatment, good performance status, good renal function, young age and previous SCT were positively associated with planned or expected progression to a subsequent line of therapy (Fig 6).
Figure 6.
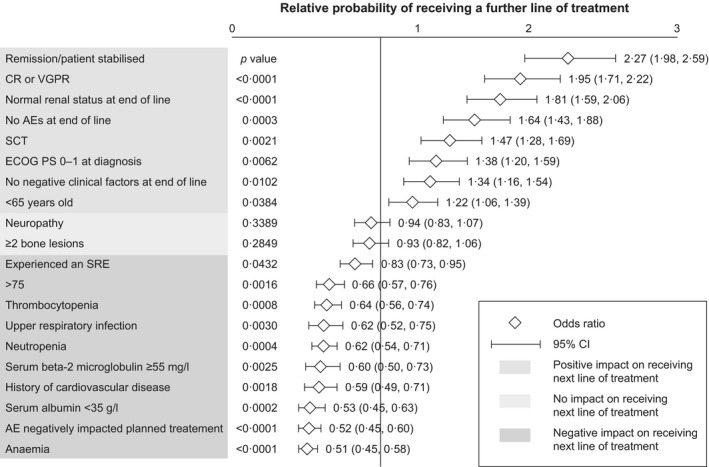
Association of patient characteristics with the probability of receiving a further line of treatment. Associations between the probability of receiving a further line of treatment and patient and disease characteristics were calculated using logistics regression analyses. A P value of <0·05 was considered statistically significant. AE, adverse event; CI, confidence interval; CR, complete response; ECOG PS, European Cooperative Oncology Group performance status; SCT, stem cell transplant; SRE, skeletal‐related event; VGPR, very good partial response.
Comorbidities and treatment‐related toxicity
The most common comorbidities and toxicities at first line were peripheral neuropathy (all grades, 45% of patients), anaemia (23%), neutropenia (22%) and thrombocytopenia (15%). The proportion of patients with one or more toxicity or comorbidity at the end of treatment increased with lines of treatment (Fig 7); 60% of patients had at least one toxicity or comorbidity at the end of the first line, compared with 77% at the end of the fifth line or later. Similarly, the proportion of patients with normal renal function decreased in later lines of treatment (70% at first line versus 45% at fifth line or later; data not shown). An exception was peripheral neuropathy, which did not appreciably increase further until fifth line, with a notably low level of grade 3 or 4 events.
Figure 7.
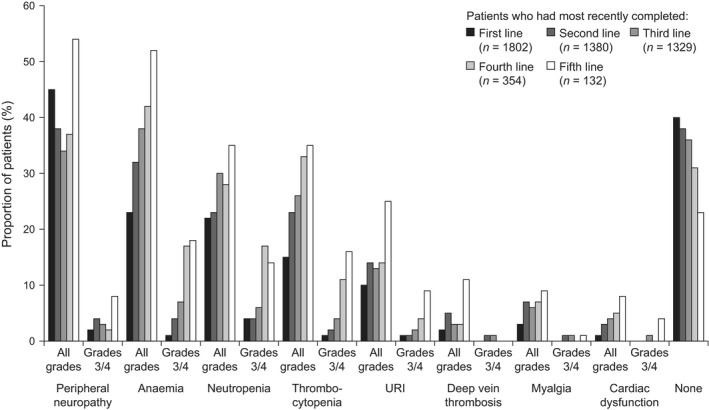
Adverse events. URI, upper respiratory infection.
Toxicities and comorbidities were more likely to negatively affect planned treatment in later lines than in earlier lines (Fig S2). After first line, toxicities and comorbidities affected planned treatment in 23% of patients, compared with 40% at completion of third‐line treatment. Requirement for supportive treatment, need for hospitalization and need for a treatment holiday all increased in later lines of therapy. More than half of the patients who required hospitalization because of a toxicity or comorbidity (5–8% of all patients who experienced a toxicity or comorbidity) were hospitalized more than once.
Concomitant medications
Bisphosphonates were the most commonly used concomitant medication, taken by 55% of patients across all lines. The proportion of patients treated with analgesics during treatment increased slightly with later lines, particularly the use of step 3 analgesics [i.e. step 1 (non‐steroidal anti‐inflammatory drugs +/− local anaesthetics) plus step 2 (step 1 plus opioid analgesics when required) plus local anaesthetic neural blockade with or without catheter plus sustained‐release opioid analgesic], from 13% at first line to 25% at fifth line and beyond; P < 0·001). Use of granulocyte‐colony stimulating factor also increased in later lines of treatment, as did use of antivirals and antibiotics. Use of antithrombotic treatments and aspirin was consistent across lines of treatment (27% and 23%, respectively) (Fig 8).
Figure 8.

Concomitant medications. 1L–5L, first line–fifth line; ESA, erythropoiesis‐stimulating agent; G‐CSF, granulocyte‐colony stimulating factor; Step 1 analgesic, mild – requiring non‐steroidal anti‐inflammatory drugs and, if the pain is postoperative in nature, infiltration with local anaesthetics; Step 2 analgesic, moderate – Step 1 plus opioid analgesics when required; Step 3 analgesic: severe – Step 1 and Step 2 plus local anaesthetic neural blockade with or without catheter plus sustained‐release opioid analgesic. Some patients received more than one level of analgesic in each line.
Discussion
These retrospective data provide valuable information on the circumstances of diagnosis of MM and real‐world outcomes following treatment, and the factors that influence treatment decisions across multiple lines of therapy.
In common with other reports (Kyle et al, 2003; Durie, 2011), the majority of patients (61%) in our study had bone pain at diagnosis. The prevalence of renal dysfunction (20%) was also in line with other studies (Kyle et al, 2003; Rifkin et al, 2015). In general, the prevalence of anaemia at diagnosis is reported to be about 70% (Kyle et al, 2003; Birgegard et al, 2006) whereas this was much lower in our study (39%) and closer to the prevalence (45%) reported in a recent registry study in the USA (Rifkin et al, 2015). In contrast, the rate of hypercalcaemia was slightly higher than reported in other papers (19% vs. 10–15%) (Kyle et al, 2003; Durie, 2011) and 30% of patients in our study presented with a fracture, indicating advanced disease (Eslick & Talaulikar, 2013). Furthermore, almost half of patients had more than one sign or symptom of disease at diagnosis, and most (84%) had an International Staging System (ISS) score of II or III at diagnosis. These data suggest that patients in Europe have considerable MM‐related organ damage at diagnosis, so initiatives facilitating earlier diagnosis are warranted.
It is generally accepted that depth of response correlates with improved outcomes (Lonial & Anderson, 2014); however, much of the supporting data are from prospective studies in clinical trial cohorts. Although real‐world methods for measuring high‐quality response are likely to be less rigorous than those used in clinical trials, we found that physician‐evaluated TTP correlated with depth of response. Furthermore, in accordance with published reports (van Rhee et al, 2014), patients who had undergone SCT were more likely to achieve CR than those who had not. Moreover, efficacy outcomes were broadly similar to those seen in clinical trials (Singhal et al, 1999; Richardson et al, 2005; Dimopoulos et al, 2007; Weber et al, 2007; San Miguel et al, 2013). Achievement of CR or VGPR was also associated with a greater likelihood of receiving a further line of treatment. These observations suggest that, in a real‐world setting, physicians are making a distinction between CR, VGPR and lower levels of response that is valid and clinically relevant.
Evidence has shown that, in addition to treatment efficacy, patients value the potential for treatment‐free intervals (Muhlbacher et al, 2008; Muhlbacher & Nubling, 2011). Data on treatment duration and treatment‐free intervals will help physicians to provide realistic estimates of how long a patient is likely to remain on treatment and how long intervals between treatments can be expected to last, which may prove useful when discussing treatment options. Not surprisingly, from the second line onwards, treatment duration and treatment‐free interval decreased with each line of treatment. Similar results have been reported in a study by Kumar et al (2004) although the duration of each treatment line was longer in our study, probably reflecting the recent introduction of more effective treatments, as well as the move towards extended therapy (e.g. with pomalidomide).
The cross‐sectional component of the current research showed that almost all patients diagnosed with symptomatic MM who were treated by haematologists received at least one line of active treatment (95%) whereas only 15% received a fourth or further line (Raab et al, 2016). Given the availability of agents that are effective in relapsed and refractory MM (Singhal et al, 1999; Richardson et al, 2005; Dimopoulos et al, 2007; Weber et al, 2007; Offidani et al, 2013; San Miguel et al, 2013; San‐Miguel et al, 2014; Stewart et al, 2015), it is perhaps surprising that relatively few patients receive multiple lines of therapy. About a quarter of patients completed fourth‐line treatment as planned, and 38% of patients ended fourth‐line treatment in remission, suggesting that patients do benefit from receiving treatment at this later stage; however, very few reach fifth‐line treatment (1%). A better understanding of the reasons for the increasingly small proportion of patients reaching later lines of treatment is needed, given the numerous new agents recently approved for the treatment of MM. One contributing factor may be the old age of many of these patients, who will accumulate comorbidities unrelated to MM. Thus, patients who are younger at diagnosis (i.e. those who were eligible for SCT) may be more likely to reach later lines and thus derive the greatest benefit from increasing treatment options at repeated relapses. This is borne out by the fact that, despite a longer time since diagnosis, the age distribution of patients at third‐line therapy was similar to that at first‐line treatment. It should also be noted that over half of patients treated at third line had been diagnosed with MM more than 5 years ago and may thus have received less than optimal regimens and supportive care than patients who are diagnosed with MM today.
A high proportion of patients in early lines ‘ended treatment as planned’, indicating that the physician did not intend to treat the patient until progression. The association between longer treatment‐free intervals and better quality of life (Acaster et al, 2013) could explain why physicians end treatment before progression. Alternatively, treatment discontinuation could be due to the use of bortezomib‐ or thalidomide‐containing regimens, for which the prescribing instructions recommend a fixed number of cycles (http://www.ema.europa.eu/docs/en_GB/document_library/EPAR_-_Product_Information/human/000823/WC500037050.pdf,http://www.ema.europa.eu/docs/en_GB/document_library/EPAR_-_Product_Information/human/000539/WC500048471.pdf). Surprisingly, patients receiving lenalidomide frequently discontinued before progression, illustrating how real‐world practice can deviate from the summary of product characteristics http://www.ema.europa.eu/docs/en_GB/document_library/EPAR_-_Product_Information/human/000717/WC500056018.pdf). As patients progressed to later lines, they were more likely to discontinue as a result of disease progression, poor physical condition or toxicity. As expected, patients experiencing toxicity or comorbidities were significantly less likely to continue to the next line of treatment than those who did not experience adverse effects. Anaemia was particularly strongly associated with discontinuation. However, this a treatable condition so there is an opportunity to reduce discontinuation rates through better management of anaemia.
Despite the increasing symptom burden with disease progression and more advanced lines of therapy, the percentage of patients who discontinued treatment as a result of toxicity remained relatively low as treatment lines increased, even at fourth and fifth line. This could be because patients who are able to tolerate therapy and who have fewer comorbidities are more likely to continue to later lines than patients who experience treatment‐related adverse effects. Disease biology may also play a role, as patients with responsive disease are likely to have a lower symptom burden and are therefore more able to tolerate further treatment. Other factors may be the availability of agents with better tolerability profiles and proactive management of toxicities and comorbidities by physicians.
In contrast to toxicity, poor performance status, which can be related as much to disease as to adverse effects of therapy, was an important factor in treatment discontinuation at later lines. Toxicities and poor performance status may also compromise treatment outcomes indirectly by causing treatment delays and interruptions, resulting in early relapse.
The study had some limitations. Patients who are not receiving active MM treatment could be managed by different physicians and so may be under‐represented. Because the proportion of patients reaching each line of therapy decreases as therapy lines advance, the records included fewer patients receiving advanced lines (third line and beyond). The weighting of the cross‐sectional component of the research was based on the date of the next consultation. This method was selected after testing multiple ways of correcting for the difference in likelihood of inclusion of different patient types related to their consultation frequency. However, this method is based on the assumption that, for any patient who was seen infrequently and who was documented in the study, there exist one or more similar patients that are seen infrequently and therefore did not have a consultation during the inclusion period. It is also possible that there remains some bias towards patients who have more frequent appointments. For example, patients receiving agents given for short, fixed durations, such as bortezomib, may be under‐represented compared with those receiving therapy over longer periods, such as lenalidomide. As this was a retrospective study based on current patient attendances, there are no survival data. It should also be noted that only patients who completed a line of treatment were included, which may mean that the responses and treatment‐free intervals reported are skewed, as patients who died during a line of treatment will have had worse responses and may have had shorter treatment‐free intervals. A prospective study is required to address these issues.
Conclusions
The chart review provides a detailed insight into patient outcomes at each line of MM treatment in 2014 in Europe. While the methods used to evaluate outcomes in real‐world clinical practice may not be as rigorous as those used in a clinical trial setting, the data show the value of physician‐assessed level of response and the information that physicians are using to make day‐to‐day decisions about patient management. Although symptom burden and comorbidities increase with subsequent lines of therapy, and depth of response and duration of treatment‐free interval decrease, it is encouraging to note that patients nevertheless benefit from effective therapies even at advanced lines of therapy. Despite this, however, only a third of patients received more than two lines of therapy, and only a minority received more than three lines. Toxicities play a role in decisions regarding the next line of treatment, and an unmet need remains for treatments that are better tolerated, along with efficacy in later treatment lines and improved quality of response. Finally, improved patient and physician education about the risk–benefit profile of new regimens may improve the outcomes of treatment at all stages by minimizing symptom burden and treatment delays, thereby increasing the number of patients who can benefit from multiple treatment lines.
Conflicts of interest
Funding for this research was provided by Amgen (Europe) GmbH. Sebastian Gonzalez‐McQuire, Reza Safaei and Paul Schoen are employed by Amgen (Europe) GmbH and hold stock in the company. Leah Fink and Alain Flinois are employed by Kantar Health, who received funding to conduct this research. Kwee Yong has received honoraria from Amgen, Janssen‐Cilag, Novartis, Celgene and MorphoSys. Michel Delforge has received honoraria from Amgen, Celgene, Janssen and Novartis. Christoph Driessen is an advisor to Amgen and Janssen‐Cilag. Lionel Karlin has received honoraria from Celgene, Gilead and Janssen, and has served on expert board committees for Amgen, BMS, Celgene and Sandoz. Maria‐Victoria Mateos has received honoraria and participated in advisory boards from Janssen, Celgene, Amgen, Novartis, BMS and Takeda. Marc S Raab is an advisor to, and has received research funding from, Amgen, Novartis, Celgene, Bristol‐Myers Squibb and MorphoSys and has received research funding or honoraria from Janssen, Novartis, Celgene, and Bristol‐Myers Squibb. Michele Cavo has received honoraria from Celgene, Janssen, Takeda, Amgen, Bristol‐Myers Squibb and Novartis.
Supporting information
Fig S1. Best response achieved.
Fig S2. Effect of adverse events on treatment.
Appendix S1. Multiple myeloma.
Acknowledgements
Leah Fink, Alain Flinois, Sebastian Gonzalez‐McQuire, Reza Safaei and Paul Schoen designed the research study. Leah Fink and Alain Flinois conducted the research. All authors analysed the data and contributed to the writing, editing and finalization of the paper. Additional data analysis and statistical support were provided by Carlotta Gazzola of Kantar Health. Medical writing support, funded by Amgen (Europe) GmbH, was provided by Kim Allcott of Oxford PharmaGenesis. Editorial support was provided by Emma Booth and Sarah Petrig of Amgen (Europe) GmbH.
References
- Acaster, S. , Gaugris, S. , Velikova, G. , Yong, K. & Lloyd, A.J. (2013) Impact of the treatment‐free interval on health‐related quality of life in patients with multiple myeloma: a UK cross‐sectional survey. Supportive Care in Cancer, 21, 599–607. [DOI] [PubMed] [Google Scholar]
- Benboubker, L. , Dimopoulos, M.A. , Dispenzieri, A. , Catalano, J. , Belch, A.R. , Cavo, M. , Pinto, A. , Weisel, K. , Ludwig, H. , Bahlis, N. , Banos, A. , Tiab, M. , Delforge, M. , Cavenagh, J. , Geraldes, C. , Lee, J.J. , Chen, C. , Oriol, A. , de la Rubia, J. , Qiu, L. , White, D.J. , Binder, D. , Anderson, K. , Fermand, J.P. , Moreau, P. , Attal, M. , Knight, R. , Chen, G. , Van Oostendorp, J. , Jacques, C. , Ervin‐Haynes, A. , Avet‐Loiseau, H. , Hulin, C. & Facon, T. (2014) Lenalidomide and dexamethasone in transplant‐ineligible patients with myeloma. New England Journal of Medicine, 371, 906–917. [DOI] [PubMed] [Google Scholar]
- Birgegard, G. , Gascon, P. & Ludwig, H. (2006) Evaluation of anaemia in patients with multiple myeloma and lymphoma: findings of the European CANCER ANAEMIA SURVEY. European Journal of Haematology, 77, 378–386. [DOI] [PMC free article] [PubMed] [Google Scholar]
- Carpenter, J. & Bithell, J. (2000) Bootstrap confidence intervals: when, which, what? A practical guide for medical statisticians. Statistics in Medicine, 19, 1141–1164. [DOI] [PubMed] [Google Scholar]
- Dimopoulos, M. , Spencer, A. , Attal, M. , Prince, H.M. , Harousseau, J.L. , Dmoszynska, A. , San Miguel, J. , Hellmann, A. , Facon, T. , Foa, R. , Corso, A. , Masliak, Z. , Olesnyckyj, M. , Yu, Z. , Patin, J. , Zeldis, J.B. & Knight, R.D. (2007) Lenalidomide plus dexamethasone for relapsed or refractory multiple myeloma. New England Journal of Medicine, 357, 2123–2132. [DOI] [PubMed] [Google Scholar]
- Durie, B.G.M. (2011) Multiple Myeloma, Cancer of the Bone Marrow: Concise Review of the Disease and Treatment Options. 2015 International Myeloma Foundation, North Hollywood, CA. [Google Scholar]
- Durie, B.G. & Salmon, S.E. (1975) A clinical staging system for multiple myeloma. Correlation of measured myeloma cell mass with presenting clinical features, response to treatment, and survival. Cancer, 36, 842–854. [DOI] [PubMed] [Google Scholar]
- Eslick, R. & Talaulikar, D. (2013) Multiple myeloma: from diagnosis to treatment. Australian Family Physician, 42, 684–688. [PubMed] [Google Scholar]
- Greipp, P.R. , San Miguel, J. , Durie, B.G. , Crowley, J.J. , Barlogie, B. , Blade, J. , Boccadoro, M. , Child, J.A. , Avet‐Loiseau, H. , Kyle, R.A. , Lahuerta, J.J. , Ludwig, H. , Morgan, G. , Powles, R. , Shimizu, K. , Shustik, C. , Sonneveld, P. , Tosi, P. , Turesson, I. & Westin, J. (2005) International staging system for multiple myeloma. Journal of Clinical Oncology, 23, 3412–3420. [DOI] [PubMed] [Google Scholar]
- Kumar, S.K. , Therneau, T.M. , Gertz, M.A. , Lacy, M.Q. , Dispenzieri, A. , Rajkumar, S.V. , Fonseca, R. , Witzig, T.E. , Lust, J.A. , Larson, D.R. , Kyle, R.A. & Greipp, P.R. (2004) Clinical course of patients with relapsed multiple myeloma. Mayo Clinic Proceedings, 79, 867–874. [DOI] [PubMed] [Google Scholar]
- Kyle, R.A. , Gertz, M.A. , Witzig, T.E. , Lust, J.A. , Lacy, M.Q. , Dispenzieri, A. , Fonseca, R. , Rajkumar, S.V. , Offord, J.R. , Larson, D.R. , Plevak, M.E. , Therneau, T.M. & Greipp, P.R. (2003) Review of 1027 patients with newly diagnosed multiple myeloma. Mayo Clinic Proceedings, 78, 21–33. [DOI] [PubMed] [Google Scholar]
- van der Laan, M.J. & Dudoit, S. (2003) Unified cross‐validation methodology for selection among estimators and a general cross‐validated adaptive epsilon‐net estimator: finite sample oracle inequalities and examples. U.C. Berkeley Division of Biostatistics Working Paper Series. Working Paper 130. Vol. 2015.
- Lonial, S. & Anderson, K.C. (2014) Association of response endpoints with survival outcomes in multiple myeloma. Leukemia, 28, 258–268. [DOI] [PMC free article] [PubMed] [Google Scholar]
- Muhlbacher, A.C. & Nubling, M. (2011) Analysis of physicians' perspectives versus patients' preferences: direct assessment and discrete choice experiments in the therapy of multiple myeloma. The European Journal of Health Economics, 12, 193–203. [DOI] [PubMed] [Google Scholar]
- Muhlbacher, A.C. , Lincke, H.J. & Nubling, M. (2008) Evaluating patients' preferences for multiple myeloma therapy, a Discrete‐Choice‐Experiment. Psycho‐Social Medicine, 5, 1–10. Doc10. [PMC free article] [PubMed] [Google Scholar]
- Offidani, M. , Corvatta, L. , Maracci, L. , Liberati, A.M. , Ballanti, S. , Attolico, I. , Caraffa, P. , Alesiani, F. , Caravita di Toritto, T. , Gentili, S. , Tosi, P. , Brunori, M. , Derudas, D. , Ledda, A. , Gozzetti, A. , Cellini, C. , Malerba, L. , Mele, A. , Andriani, A. , Galimberti, S. , Mondello, P. , Pulini, S. , Coppetelli, U. , Fraticelli, P. , Olivieri, A. & Leoni, P. (2013) Efficacy and tolerability of bendamustine, bortezomib and dexamethasone in patients with relapsed‐refractory multiple myeloma: a phase II study. Blood Cancer Journal, 3, e162. [DOI] [PMC free article] [PubMed] [Google Scholar]
- Raab, M.S. , Cavo, M. , Delforge, M. , Driessen, C. , Fink, L. , Flinois, A. , Gonzalez‐McGuire, S. , Karlin, L. , Mateos, M.‐V. , Schoen, P. & Yong, K. (2015) Multiple myeloma management: practice patterns across Europe. Haematologica, 100, 251. [DOI] [PubMed] [Google Scholar]
- Raab, M.S. , Cavo, M. , Delforge, M. , Driessen, C. , Fink, L. , Flinois, A. , Gonzalez‐McQuire, S. , Safaei, R. , Karlin, L. , Mateos, M.N. , Schoen, P. & Yong, K. (2016) Multiple myeloma: practice patterns across Europe. British Journal of Haematology, 175, 66–76. [DOI] [PubMed] [Google Scholar]
- van Rhee, F. , Giralt, S. & Barlogie, B. (2014) The future of autologous stem cell transplantation in myeloma. Blood, 124, 328–333. [DOI] [PMC free article] [PubMed] [Google Scholar]
- Richardson, P.G. , Sonneveld, P. , Schuster, M.W. , Irwin, D. , Stadtmauer, E.A. , Facon, T. , Harousseau, J.L. , Ben‐Yehuda, D. , Lonial, S. , Goldschmidt, H. , Reece, D. , San‐Miguel, J.F. , Blade, J. , Boccadoro, M. , Cavenagh, J. , Dalton, W.S. , Boral, A.L. , Esseltine, D.L. , Porter, J.B. , Schenkein, D. & Anderson, K.C. (2005) Bortezomib or high‐dose dexamethasone for relapsed multiple myeloma. New England Journal of Medicine, 352, 2487–2498. [DOI] [PubMed] [Google Scholar]
- Richardson, P.G. , Moreau, P. , Laubach, J.P. , Gupta, N. , Hui, A.M. , Anderson, K.C. , San Miguel, J.F. & Kumar, S. (2015) The investigational proteasome inhibitor ixazomib for the treatment of multiple myeloma. Future Oncology, 11, 1153–1168. [DOI] [PubMed] [Google Scholar]
- Rifkin, R.M. , Abonour, R. , Terebelo, H. , Shah, J.J. , Gasparetto, C. , Hardin, J. , Srinivasan, S. , Ricafort, R. , Nagarwala, Y. & Durie, B.G. (2015) Connect MM Registry: the importance of establishing baseline disease characteristics. Clinical Lymphoma, Myeloma and Leukemia, 15, 368–376. [DOI] [PubMed] [Google Scholar]
- San Miguel, J. , Weisel, K. , Moreau, P. , Lacy, M. , Song, K. , Delforge, M. , Karlin, L. , Goldschmidt, H. , Banos, A. , Oriol, A. , Alegre, A. , Chen, C. , Cavo, M. , Garderet, L. , Ivanova, V. , Martinez‐Lopez, J. , Belch, A. , Palumbo, A. , Schey, S. , Sonneveld, P. , Yu, X. , Sternas, L. , Jacques, C. , Zaki, M. & Dimopoulos, M. (2013) Pomalidomide plus low‐dose dexamethasone versus high‐dose dexamethasone alone for patients with relapsed and refractory multiple myeloma (MM‐003): a randomised, open‐label, phase 3 trial. The Lancet. Oncology, 14, 1055–1066. [DOI] [PubMed] [Google Scholar]
- San‐Miguel, J.F. , Hungria, V.T. , Yoon, S.S. , Beksac, M. , Dimopoulos, M.A. , Elghandour, A. , Jedrzejczak, W.W. , Gunther, A. , Nakorn, T.N. , Siritanaratkul, N. , Corradini, P. , Chuncharunee, S. , Lee, J.J. , Schlossman, R.L. , Shelekhova, T. , Yong, K. , Tan, D. , Numbenjapon, T. , Cavenagh, J.D. , Hou, J. , LeBlanc, R. , Nahi, H. , Qiu, L. , Salwender, H. , Pulini, S. , Moreau, P. , Warzocha, K. , White, D. , Blade, J. , Chen, W. , de la Rubia, J. , Gimsing, P. , Lonial, S. , Kaufman, J.L. , Ocio, E.M. , Veskovski, L. , Sohn, S.K. , Wang, M.C. , Lee, J.H. , Einsele, H. , Sopala, M. , Corrado, C. , Bengoudifa, B.R. , Binlich, F. & Richardson, P.G. (2014) Panobinostat plus bortezomib and dexamethasone versus placebo plus bortezomib and dexamethasone in patients with relapsed or relapsed and refractory multiple myeloma: a multicentre, randomised, double‐blind phase 3 trial. The Lancet. Oncology, 15, 1195–1206. [DOI] [PubMed] [Google Scholar]
- Singhal, S. , Mehta, J. , Desikan, R. , Ayers, D. , Roberson, P. , Eddlemon, P. , Munshi, N. , Anaissie, E. , Wilson, C. , Dhodapkar, M. , Zeddis, J. & Barlogie, B. (1999) Antitumor activity of thalidomide in refractory multiple myeloma. New England Journal of Medicine, 341, 1565–1571. [DOI] [PubMed] [Google Scholar]
- Stewart, A.K. , Rajkumar, S.V. , Dimopoulos, M.A. , Masszi, T. , Spicka, I. , Oriol, A. , Hajek, R. , Rosinol, L. , Siegel, D.S. , Mihaylov, G.G. , Goranova‐Marinova, V. , Rajnics, P. , Suvorov, A. , Niesvizky, R. , Jakubowiak, A.J. , San‐Miguel, J.F. , Ludwig, H. , Wang, M. , Maisnar, V. , Minarik, J. , Bensinger, W.I. , Mateos, M.V. , Ben‐Yehuda, D. , Kukreti, V. , Zojwalla, N. , Tonda, M.E. , Yang, X. , Xing, B. , Moreau, P. & Palumbo, A. (2015) Carfilzomib, lenalidomide, and dexamethasone for relapsed multiple myeloma. New England Journal of Medicine, 372, 142–152.25482145 [Google Scholar]
- Torimoto, Y. , Shindo, M. , Ikuta, K. & Kohgo, Y. (2015) Current therapeutic strategies for multiple myeloma. International Journal of Clinical Oncology, 20, 423–430. [DOI] [PubMed] [Google Scholar]
- Weber, D.M. , Chen, C. , Niesvizky, R. , Wang, M. , Belch, A. , Stadtmauer, E.A. , Siegel, D. , Borrello, I. , Rajkumar, S.V. , Chanan‐Khan, A.A. , Lonial, S. , Yu, Z. , Patin, J. , Olesnyckyj, M. , Zeldis, J.B. & Knight, R.D. (2007) Lenalidomide plus dexamethasone for relapsed multiple myeloma in North America. New England Journal of Medicine, 357, 2133–2142. [DOI] [PubMed] [Google Scholar]
Associated Data
This section collects any data citations, data availability statements, or supplementary materials included in this article.
Supplementary Materials
Fig S1. Best response achieved.
Fig S2. Effect of adverse events on treatment.
Appendix S1. Multiple myeloma.