

Abstract
Objectives
To describe individual BF responses in a nursing home resident population for one‐hour periods of bed rest.
Methods
BF was measured for one hour over the sacrum in 0° supine position and 30° supine tilt position in 25 individuals aged 65 y or older while lying on a pressure‐redistributing mattress. Measurements were made at three tissue depths (1, 2, and 10 mm) using the noninvasive optical techniques, LDF and PPG.
Results
Eleven participants had a PIV response at 1 mm depth in both positions and seven participants had a lack of this response at this depth and positions. The BF response at 1 mm depth appeared immediately and remained over, or below, baseline for the entire 60 min of loading in both positions. These BF patterns were also seen in deeper tissue layers.
Conclusions
The cutaneous BF response among the nursing home residents was distinct, appeared early, and remained during the one hour of loading.
Keywords: immobility, interface pressure, nursing home residents, pressure‐induced vasodilation, tissue blood flow
Abbreviations used:
- BF
blood flow
- BMI
body mass index
- IR
infrared
- LDF
laser Doppler flowmetry
- PIV
pressure‐induced vasodilation
- PPG
photoplethysmography
- PPP
postpressure period
- RAPS
risk assessment pressure sore scale
- SD
standard deviation
1. Introduction
Pressure ulcer development continues to be a significant problem in the healthcare system; pressure ulcers can affect the quality of life of many individuals and are associated with high costs for the healthcare system.1, 2 Pressure ulcers are defined as areas of soft tissue breakdown in skin and underlying tissue, usually over bony prominences, caused either by sustained pressure and/or by shearing forces.3
Theories about pressure ulcer etiology includes localized ischemia,4, 5, 6 sustained deformations of cells,7, 8 impaired lymphatic function,9, 10 and ischemia–reperfusion injury.11 Among these theories, it is suggested that cell deformation is mainly involved over short periods with high‐pressure exposure, while ischemia increases over time and becomes the dominant factor for prolonged pressure exposure.12 In clinical practice, where immobile patients are often exposed to prolonged loading on a supporting surface, it might be most likely that ischemia plays the major role in the damage process.13
The duration for which skin and muscle cells can tolerate ischemia without damage differs. For example, muscle tissue is more susceptible to damage than skin tissue due to the higher metabolism in muscles.14, 15 Furthermore, internal stress and strains are substantially higher in soft tissues adjacent to bony prominences than soft tissues near the surface, and these bony surfaces have the potential to cause damage in the deep tissue before damage occurs in the superficial tissue.12 This bottom‐to‐top pathway underlies the theory of deep tissue injury, which is suggested to be caused by a combination of cell deformation and ischemia.12, 16 Pressure ulcers may also occur in the epidermis, that is, category I, and these ulcers are suggested to progress in a top‐to‐bottom pathway if the pressure is not relieved.17, 18
When healthy tissue is exposed to local non‐noxious pressure, the cutaneous microvessels dilate. This is a phenomenon referred to as PIV.19, 20 This vasodilation serves to minimize damage resulting from pressure by delaying the occurrence of ischemia.21 Individuals lacking a PIV response have a decrease in BF also with low pressure, indicating a vascular dysfunction. It has been shown that the PIV function is altered in elderly patients and those with diabetes and neurological disease,22, 23, 24 and the absence of PIV has been associated with an increased risk of pressure ulcers.25 However, even younger persons can be effected with impaired PIV response.26 If tissue becomes ischemic during loading, another typical BF response that occurs after load removal is a marked increase in blood flow, termed reactive hyperemia. This response, which is a vital process that serves to restore oxygen levels to normal,27 has been shown to be impaired among elderly individuals.28 Furthermore, absence of a reactive hyperemic response has shown to be associated to higher PU incidence.21
Immobile elderly patients are particularly at risk for pressure ulcer development. With advanced age, the skin becomes more vulnerable to pressure and shear due to loss of connective tissue cells, nerve endings, and blood vessels.16 In addition, with advanced age the papilla become more flattened as the epidermis gradually thins and reduces the skin's resistance to shearing forces.29 Although it is clear that BF responses such as PIV tend to significantly alter among the elderly,28, 30 research on how BF responses among the elderly are affected by loading of their own body weight in different positions and over prolonged time is limited.
BF has previously been measured over bony prominences in different supine positions, for one‐hour periods in each position in a sample of 25 nursing home residents.31 The most common response at group level was an increase in blood flow, but the distribution was wide. Since previous studies of PIV responses have primarily been experimental, performed over relatively short measurement periods, and presented at group level among elderly individuals,22, 26, 28, 31 the objective of this study is to describe individual BF responses in a nursing home resident population for one‐hour periods of bed rest.
2. Materials and Methods
2.1. Design
This study has a descriptive experimental design performed in a clinical relevant situation.
2.2. Participants
Twenty‐five participants were recruited from three nursing homes located in southern Sweden during the period of May 2011 to August 2012. The inclusion criteria were aged 65 y or older and able to lie in two supine positions for one hour. Exclusion criteria were existing pressure ulcer or history of pressure ulcers in the area over the sacrum and a body temperature above 37.5°C.
This study was approved by the Regional Ethical Review Board (Dnr 2011/98‐31). All participants, or when appropriate next of kin, received both verbal and written information about the study and were asked to sign an informed consent prior to inclusion.
2.3. Instruments and methods
Two optical noninvasive measurement techniques were used to measure tissue blood flow: LDF and PPG. LDF (Periflux, Perimed, Järfälla, Sweden) uses monochromatic light with a wavelength of 780 nm and reflects the nutritive BF in the upper dermis at a depth of approximately 1 mm.32 One fiber in the optical laser Doppler probe leads the light to the tissue, and a second optical fiber collects the backscattered light and transmits it to a photodetector. In the tissue, photons are scattered by moving objects; for example, red blood cells and by static structures. Encounter with moving cells causes frequency shifts, and the LDF detects these shifts as an estimate of the BF in arbitrary units.33 LDF is a well‐established method and has been used in various research for evaluating the microvascular BF in tissue30, 34 and regarded to have the status as the golden standard for microcirculatory assessments.35
The PPG instrument and PPG probe (Department of Biomedical Engineering, Linköping University, Linköping, Sweden) used in this study utilize light with two wavelengths: green light (560 nm) reflecting the BF in the lower dermis–subcutaneous interface at a depth of approximately 2 mm, and near IR light (810 nm) reflecting deep tissue at a depth of ≥10 mm, in fascia or muscle. The tissue depths have been previously verified.36 The reflected light generates a pulsatile signal, synchronous with the heart rate and reflects the arterial BF in the tissue. The PPG optical components are embedded in a thin, flexible silicon probe (10 × 10 cm), which enables that the patient can lay on it. The probe allows insertion of the laser Doppler fiber optic probe (Perimed 415‐242 SPP, Järfälla, Sweden) and a temperature sensor (Perimed PF442, Järfälla, Sweden) monitor changes in skin temperature over time (°C). The LDF probe was placed at the edge of the silicon plate so as not to interfere with the lights of the PPG. This system has been validated in previous studies.37, 38, 39
Measurements of interface pressure were performed using a thin and flexible pneumatic pressure transmitter, connected to a digital manometer developed in house. The transmitter was calibrated before each measurement and was positioned between the surface of the mattress and the silicon probe. The room temperature was measured with a digital indoor thermometer (°C; Bell Xpress A/S, Tranbjerg, Denmark).
The following data were collected to describe the individuals’ condition: weight, height, medical history and current medication, blood pressure (mm Hg, Speidel & Keller, Jungingen, Germany), pulse (manually monitored), and body temperature (°C; ThermoScan 6022, Braun, Kronoberg, Germany). The participants risk score for pressure ulcer development was conducted by using the RAPS scale. The scale is composed of the following variables estimated by the staff: general physical condition, activity, mobility, moisture, food intake, fluid intake, sensory perception, friction and shear, and body temperature. Each variable has scores ranging from 1 (very poor) to 4 (good), except the friction and shear category that has a score range of 1–3. The maximum score of the RAPS is 35 with a recommended cut‐off level of ≤29 for pressure ulcer risk.40, 41 The sensitivity and specificity for the RAPS scale is 75% nd 70%, respectively, among medical hospital in‐patients.40
2.4. Procedure
In this study, the 0° supine position and the 30° supine tilt position were evaluated (Fig. 1). Measurements in each position were carried out in the resident's room, one position at a time, within a median period of 2 d (min: 1 d, max: 9 d). All participants lay on the same pressure‐reducing mattress (Optimal 5zon, Care of Sweden, Svenljunga, Sweden) using their own bedding.
Figure 1.
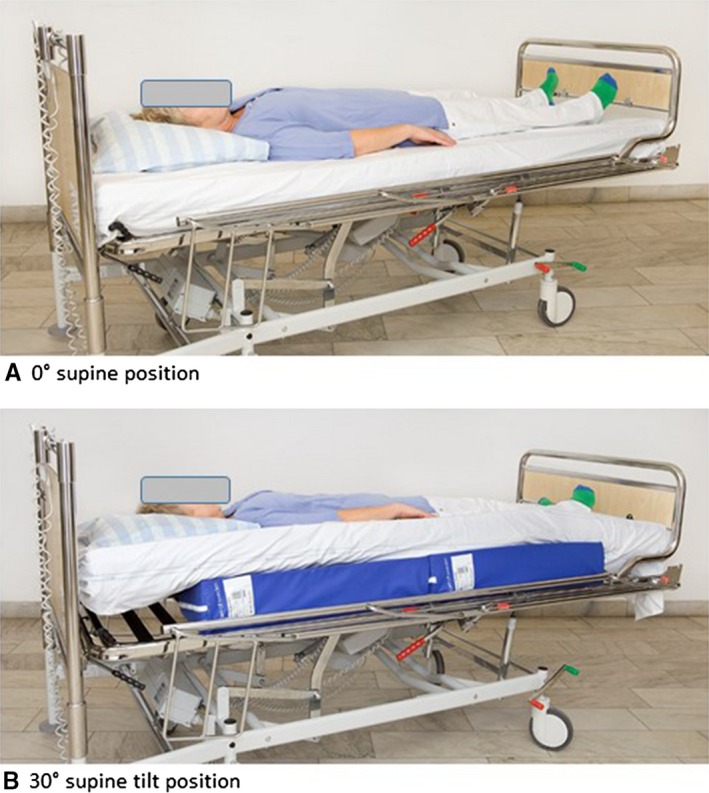
The two positions evaluated in this study
The procedure (Fig. 2) started with the participant resting in bed in a lateral position for 15 min to acclimatize to being horizontal. While in this position, the prominence of the sacrum was identified by palpation and the measurement probe was fixated with gentle adhesive tape to the identified area. At the end of the acclimatization period the participant's body temperature, blood pressure, and pulse were measured, room temperature was noted, and baseline data for BF and skin temperature were collected during a five‐minute period.
Figure 2.

Schematic description of the procedure and analysis from each session. BF (at three depths) and skin temperature were recorded continuously from the moment after the probe fixation. At t0, room temperature, body temperature, pulse, and systolic and diastolic blood pressures were measured and thereafter baseline (BL) data for blood flow, skin temperature, and interface pressure were collected. At point t2, the interface pressure during loading was analyzed. At t5–t70, 30 s of BF and skin temperature signals were analyzed. BF data from t5 to t60 were summarized and divided by 12, giving mean BF during loading
Thereafter, the participant was repositioned to either the 0° supine position or 30° supine tilt position and BF and temperature were measured for a period of 60 min. Interface pressure was registered during the first two minutes of loading. The 30° supine tilt position was achieved by using two triangular wedges (Curera®; Care of Sweden, Tranemo, Sweden) placed side by side under the mattress (Fig. 1).
After one hour, the participants were repositioned back to the lateral position and BF and temperature were recorded for an additional 10 min. The room was kept calm and quiet and participants were asked to avoid speaking or moving during the measurement period to avoid artifacts.
2.5. Data analysis
BF and skin temperature were simultaneously and continuously recorded (Fig. 2) on a laptop using Labview software (Labview 6.1; National instruments, Kista, Sweden) and analyzed using an in‐house developed program (Department of Biomedical Engineering, Linköping University; Linköping, Sweden) using Matlab version R2010a (the Mathworks, Natick, MA, USA). A 30‐s period of BF and skin temperature signals were analyzed just before loading (=baseline). Thereafter, a 30‐s period of BF and skin temperature signals were analyzed every fifth minute during the 60 min of loading, giving 12 mean values. Once unloaded, an additional 30‐s period of BF and skin temperature signals were analyzed at 2, 5, and 10 min, and the peak BF in the postpressure period was identified. Identified artifacts were excluded from in the data analysis. A 30‐s period of the interface pressure signal was analyzed after two minutes of loading and converted from volt into millimeters of mercury (mm Hg) by linear equation.42
The mean values of BF at each selected period were calculated as the relative change from the related baseline values in percentages.43 The total mean BF during loading was then calculated as the mean relative change (%) of the 12 means (t5–t60 in Fig. 2). A reactive hyperemic response in the PPP was defined as a peak BF of 5% or more over baseline preceded of a non‐PIV response during loading. The participants lacking BF data in both position (n=2) or those who could not complete the measurement period of one hour in one of the positions and at least 30 min in the other (n=2) were excluded from the analysis.
BMI was calculated as the quotient of weight (kg) and height2 (m).
2.6. Statistics
All analyses and calculations were performed using PASW statistics, 20.0 and 22.0 (IBM SPSS Inc, Chicago, IL, USA). Demographic data, individual's conditions, blood flow, interface pressure, and temperature were presented in terms of means and standard deviations. Total medium BF data were also presented.
The independent t‐test was used to compare those participants’ who had a PIV response to those who had a non‐PIV response at 1 mm depth in the supine position 0° regarding age, total RAPS score, BMI, systolic and diastolic blood pressures, pulse, body temperature, interface pressure, and skin temperature at baseline, after 30 min, and after 60 min. Dichotomous variables such as gender, risk patient according to RAPS (yes/no), and immobility, that is, chair or bed bound (yes/no), were analyzed with Fisher's exact test for the same comparison.
The paired samples t‐test was used to compare the interface pressure and skin temperature between the two positions. A P<.05 was considered statistically significant.
3. Results
Twenty‐one participants were included and their mean age was 86 (SD: 7.6) y. Nine of them were female and 10 had a RAPS score ≤29p. Furthermore, participant characteristics are presented in Table 1.
Table 1.
Participant characteristics and vital signs. Mean, SD, and/or number of cases (n)
| n | Mean (SD) | |
|---|---|---|
| Age (years) | 21 | 86.1 (7.6) |
| Women | 9 | |
| Risk patient (RAPS ≤29p) | 10 | |
| RAPS point | 21 | 30.0 (3.8) |
| Immobility (bed or chair bound) | 9 | |
| BMI (kg/m2) | 21 | 25.0 (3.8) |
| Systolic blood pressure (mm Hg) | 20 | 129.1 (16.3)a |
| Diastolic blood pressure (mm Hg) | 20 | 66.6 (8.3)a |
| Pulse (beats/min) | 21 | 66.2 (12.0)a |
| Body temperature (°C) | 21 | 36.1 (0.3)a |
Mean value based on the 0° supine position measurement position.
Eleven participants had cardiovascular disease, nine cerebrovascular disease, eight hypertension, and four had diabetes.
3.1. BF responses in supine position 0°
Thirteen participants had a PIV response and eight participants had a non‐PIV response at 1 mm depth during loading in the supine position 0° (Table 2). Participant coded 6 and 24 had a non‐PIV response at all tissue depths and participant coded 19 and 23 had a non‐PIV response at 1 and 10 mm depths, but a PIV response at 2 mm depth. In total, five participants had a non‐PIV response at 2 mm depth and nine at 10 mm depth.
Table 2.
The participants’ total mean (%) of BF during loading and peak BF (%) in PPP in the supine position 0° at three tissue depths: 1, 2, and 10 mm
| Supine position 0° | ||||||||
|---|---|---|---|---|---|---|---|---|
| Measurement depths | 1 mm | 2 mm | 10 mm | |||||
| Participant code | RAPSa score | Interface pressure (mm Hg) | Total mean BF during loading (%) | Peak BF in PPP (%) | Total mean BF during loading (%) | Peak BF in PPP (%) | Total mean BF during loading (%) | Peak BF in PPP (%) |
| 1f , g | 35 | 40.8 | 215.18 | 128.05 | −22.42 | −29.41 | −36.6 | 38.11d |
| 2e , f | 25b | 37.8 | 178.04 | 91.13 | −5.99 | −7.8 | −19.36 | −15.78 |
| 4e , f , h | 29b | 75.63 | −8.32 | 95.52 | 14.51 | −7.51 | −34.24 | |
| 6e , f , h | 26b | 50.1 | −43.42 | 317.52d | −15.01 | 80.09d | −24.67 | 12.78d |
| 7e , f | 27b | 24.0 | 14.79 | 88.25 | 79.8 | 51.36 | 76.43 | 58.79 |
| 8e , f , h | 34 | 52.5 | 57.28 | 59.12 | 194.65 | 31.44 | 75.15 | −6.23 |
| 9e | 26b | 22.8 | −13.6 | 0.21 | 21.73 | 44.7 | — | — |
| 10e | 34 | 50.3 | 29.54 | 85.92 | 2.65 | 45.68 | — | — |
| 12e , f | 35 | 30.9 | −32.83 | −12.77 | 25.81 | −6.31 | 30.87 | −14.23 |
| 13f , h , c | 35 | 43.4 | −37.35 | 25.58d | 80.24 | 60.05 | 6.36 | 27.71 |
| 15 | 31 | 43.5 | 6,0 | 117.98 | 28.09 | −5.69 | 65.03 | −4.27 |
| 16g , c | 32 | 48.2 | 22.52 | 1.85 | 78.7 | 44.41 | 55.55 | 66.98 |
| 17f | 28b | 59.0 | 102.56 | — | 83.75 | — | 10.08 | — |
| 18f | 33 | 47.0 | 0.25 | — | −26.69 | — | 21.99 | — |
| 19e , f , g , h , c | 26b | 43.2 | −15.01 | −26.17 | 18.47 | 72.63 | −27.05 | — |
| 20f , h , c | 28b | 58.2 | 4.31 | 60.52 | 71.81 | 122.53 | 63.41 | 88.7 |
| 21 | 32 | 53.6 | 51.86 | 190.49 | 219.54 | 94.92 | −1.84 | 7.59d |
| 22f , g | 31 | 46.4 | −70.16 | 692.63d | 39.25 | −3.6 | 107.85 | 40.2 |
| 23e , f | 24b | 56.6 | −67.8 | −35.76 | 62.13 | 77.07 | −11.82 | — |
| 24 | 34 | 57.7 | −22.88 | −15.64 | −35.57 | −63.44 | −35.32 | −15.92 |
| 25 | 26b | 40.9 | 22.71 | 16.5 | 26.77 | 16.82 | −22.61 | 7.04d |
RAPS, risk assessment pressure sore scale.
Participants at risk for pressure ulcer development according to the RAPS scale.
Participants with diabetes.
A reactive hyperemic response.
Cardiac medications (ACE‐code):
Beta‐blocking agents (C07).
Antithrombotic agents (B01).
Cardiac therapy (C01).
ACE inhibitors (C09).
Five of the eight participants with non‐PIV response at 1 mm depth had also a lack of reactive hyperemia in the PPP (Table 2). Participant code 24 had a lack of reactive hyperemia at all tissue depths.
3.2. BF responses in supine tilt position 30°
Twelve participants had a PIV response and nine participants had a non‐PIV response at 1 mm depth during loading in the supine tilt position 30° (Table 3). The majority of the participants (n=18) had the same response as in the supine position 0° at this measurement depth. Participant code 6 had a non‐PIV response at all depths and participant code 22 had a non‐PIV response at 1 and 2 mm depths, but not at 10 mm depth. In total, three participants had a non‐PIV response at 2 mm depth and six at 10 mm depth.
Table 3.
The participants’ total mean (%) of BF during loading and peak BF (%) in PPP in the supine tilt position 30° at three tissue depths: 1, 2, and 10 mm
| Supine tilt position 30° | ||||||||
|---|---|---|---|---|---|---|---|---|
| Measurement depths | 1 mm | 2 mm | 10 mm | |||||
| Participant code | RAPSa score | Interface pressure (mm Hg) | Total mean BF during loading (%) | Peak BF in PPP (%) | Total mean BF during loading (%) | Peak BF in PPP (%) | Total mean BF during loading (%) | Peak BF in PPP (%) |
| 1f , g | 35 | 39.7 | 4.54 | −35.83 | 73.25 | 162.04 | −43.11 | 44.27d |
| 2e , f | 25b | 28.3 | 33.36 | 35.48 | 29.28 | 17.21 | −10.74 | 7.7d |
| 4e , f , h | 29b | 17.46 | 6.15 | 90.35 | ||||
| 6e , f , h | 26b | 32.4 | −63.02 | −75.14 | −4.68 | 13.85d | −33.55 | −30.92 |
| 7e , f | 27b | 26.7 | −16.91 | 67.3 | 33.57 | |||
| 8e , f , h | 34 | 43.6 | 43.55 | 91.22 | 158.41 | 67.34 | ||
| 9e | 26b | 41.4 | −55.37 | −55.87 | 98.82 | 36.07 | ||
| 10e | 34 | 25.0 | 17.61 | 92.6 | 62.22 | 20.72 | −7.88 | |
| 12e , f | 35 | 13.4 | −0.86 | 49.17d | 29.3 | 29.45 | ||
| 13f , h , c | 35 | 41.0 | −45.71 | 209.31d | 67.02 | 71.19 | 52.67 | 41.93 |
| 15 | 31 | 33.4 | 28.83 | 12.77 | 43.31 | −10.97 | 39.48 | −12.35 |
| 16g , c | 32 | 19.9 | 130.16 | 45.77 | 42.3 | 106.04 | ||
| 17f | 28b | 21.6 | 14.24 | 36.54 | 79.69 | 69.54 | −5.62 | −4.18 |
| 18f | 33 | 41.1 | 31.31 | 51.09 | 57.84 | 8.82 | 18.97 | |
| 19e , f , g , h , c | 26b | 25.51 | −18.16 | −18.17 | ||||
| 20f , h , c | 28b | 44.0 | 92.54 | 57.03 | 153,0 | 124.94 | 54.86 | 64.67 |
| 21 | 32 | 40.4 | −55.05 | 80.05d | 116.59 | 192.57 | 121.48 | 260.06 |
| 22f , g | 31 | 43.6 | −70.39 | −23.27 | 61.29 | |||
| 23e , f | 24b | 28.3 | −51.04 | 118.36d | 35.31 | 82.68 | 88.45 | 124.07 |
| 24 | 34 | 25.2 | −5.9 | −21.39 | 42.41 | −3.76 | 5.09 | −40.05 |
| 25 | 26b | 33.6 | 8.74 | 7.36 | 86.62 | 41.39 | 32.75 | −22.06 |
RAPS, risk assessment pressure sore scale.
Participants at risk for pressure ulcer development according to the RAPS scale.
Participants with diabetes.
A reactive hyperemic response.
Cardiac medications (ACE‐code):
Beta‐blocking agents (C07).
Antithrombotic agents (B01).
Cardiac therapy (C01).
ACE inhibitors (C09).
Three of the nine participants with non‐PIV response at 1 mm depth had also a lack of reactive hyperemia in the PPP (Table 3).
3.3. BF pattern during loading
Overall, the typical pattern of the participants’ BF was that their responses appeared early; the majority within five minutes. The BF increased or decreased immediately and remained either over or below baseline for the entire 60 min of loading in both position and measurement depths (Figs 3 and 4). Fig. 3 is based on the participants who had a PIV response at 1 mm depth in the supine position 0° and presents their BF pattern in the two positions and measurement depths. Likewise, Fig. 4 is based on the participants with non‐PIV response at 1 mm depth in the supine position 0°.
Figure 3.

BF patterns at 1, 2, and 10 mm depths during load and in the PPP in the two positions among the participants with PIV response at 1 mm depth when loaded (5–60 min) in the supine position 0°. BF is presented as mean relative change (%) from baseline (minute 0). The horizontal line indicates the baseline (0) value and the vertical line indicates BF responses just before offloading at 60 min
Figure 4.
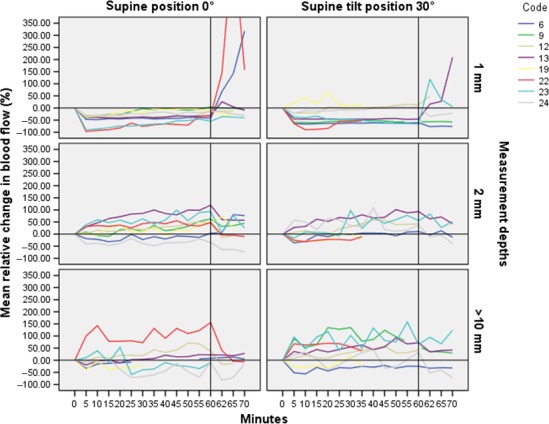
BF patterns at 1, 2, and 10 mm depths during load and in the PPP in the two positions among the participants with lack of PIV response at 1 mm depth when loaded (5–60 min) in the supine position 0°. BF is presented as mean relative change (%) from baseline (minute 0). The horizontal line indicates the baseline (0) value and the vertical line indicates BF responses just before offloading at 60 min
3.4. Comparison between participants with PIV and participants with non‐PIV
The participants with PIV in the supine position 0° at 1 mm depth were compared with the participants who had a non‐PIV response in this position and depth. The comparisons were made regarding vital signs and participants’ characteristics (Table 1), interface pressure, and skin temperature at baseline, after 30 min, and 60 min. Pulse was significantly higher in the group of participants with PIV response (n=13) compared to the group with non‐PIV (n=8); 69.5, SD: 11.0 beats/min versus 60.4, SD: 6.0 beats/min, P=.047. No other comparisons differed significantly between the groups.
3.5. Comparison of interface pressure and skin temperature between the two positions
The mean interface pressure over the sacrum was significantly higher in the 0° supine position, 45.3 (SD: 10.5) mm Hg, than in the 30° supine tilt position, 32.8 (SD: 9.2) mm Hg, t(18)=4.051, P=.001 (Table 4). Skin temperatures increased significantly between baseline and 60 min in both positions (P < .001) and had a nonlinear development with the largest increase seen in the first 30 min (Table 4). There was no difference in skin temperature increase between the two positions.
Table 4.
Comparison between the supine position 0° and supine tilt position 30° in regards to interface pressure and skin temperature at baseline, after 30 min, and 60 min of loading
| Supine position 0° | Supine tilt position 30° | |||||
|---|---|---|---|---|---|---|
| n | Mean | SD | n | Mean | SD | |
| Interface pressure (mm Hg) | 20 | 45.3 | 10.5 | 19 | 32.8 | 9.2 |
| Skin temperature at baseline (°C) | 19 | 32.9 | 1.0 | 21 | 33.0 | 0.7 |
| Skin temperature at 30 min (°C) | 19 | 34.8 | 0.8 | 20 | 35.0 | 0.6 |
| Skin temperature at 60 min (°C) | 15 | 35.6 | 0.6 | 16 | 35.9 | 0.6 |
4. Discussion
For the first time, we have been able to characterize the individual BF responses at different tissue depths during a long period of loading in an older and vulnerable population. The focus was the early changes in BF that can precede pressure ulcer development. This study demonstrated that cutaneous BF response among the nursing home residents was distinct, appeared early, and remained during the 60 min of loading among the participants in both the 0° supine position and 30° supine tilt position. The participants with absent PIV responses had thereby an insufficient BF almost immediately which continued as long as pressure was sustained: a finding and pattern linked to pressure ulcer development.25 Some participants had a reactive hyperemic response after loading, which further support that they have been exposed to ischemia during loading.27 Notable were also that some of the participants with lack of PIV also had lack of reactive hyperemia. Since both responses independently are linked to pressure ulcer development, lack of both these responses may lead to a higher risk for tissue damage due to loading. However, further research is needed to establish this relationship.
Although the BF decreased immediately among the participants with non‐PIV response at 1 mm depth and remained below baseline during the one hour of loading, the initial decrease in some cases was followed by slightly increased BF (Fig. 4). This may indicate that these individuals had a PIV function but that it was not strong enough to resist the applied pressure.19
BF responses in the deeper tissue layers, irrespective of PIV or non‐PIV responses at 1 mm depth, were inconclusive indicating that the various tissue layers are not uniformly affected by external pressure. This result is consistent with previous research.44, 45, 46 However, the BF responses in the deeper tissue layers were distinct, appeared early, and remained during the 60 min of loading in accordance with the results for the superficial layers, although with slightly increased variability (Fig. 4). Larger vessels are involved in deeper tissue structures and this results in larger fluctuations in BF than in the superficial skin, which may explain the variability.47 Some participants had a non‐PIV response at 1 mm depth, but PIV in the deeper tissue layers and vice versa; some participants had a non‐PIV response at 10 mm depth but PIV in the more superficial layers. Thus, these findings support both theories of how pressure ulcers are formed; in a top‐to‐bottom pathway where the damage occur in the epidermis first17 and in a bottom‐to‐top pathway where the deeper tissue near bone is effected and progress upward if the pressure is not relieved.12
Heat was accumulated during the one‐hour loading period and the skin temperature increased in both positions. A BF increase has shown to be related to skin temperature increase in thermal provocations,43 although this is less prominent with advanced age48 and in older in‐patient populations.49 However, in studies with pressure provocations, an increase in skin temperature has shown to not necessarily be positively related with a BF increase. When treated on group level, the skin temperature was a negative confounding factor for the overall BF when lying in bed for one hour.31 Individuals lacking a PIV response seem to have an impairment in their ability to increase BF in relation to the heat stimulus when pressure is involved.49 The temperature increased in mean by 2.7°C in the supine position 0° and 2.9°C in the supine tilt position 30°. It is claimed that a 1°C increase in temperature raises the metabolic activity in the tissue by approximately 10%.47 Thus, the temperature increase among those with non‐PIV response is not negligible because it may worsen the effect of ischemia and put these patients at even higher risk for developing pressure ulcers.50, 51, 52
This study shows that the BF response in a given situation is specific to the individual and not easy to predict, which is according to previous findings.53 Likewise, no common trend in BF responses emerges among those patients who were considered to be at risk for pressure ulcer development according to RAPS. For instance, only four of the ten “at‐risk patients” had a non‐PIV response at 1 mm depth in the supine position 0° and only two of them had in addition lack of a reactive hyperemic response in this position and depth. However, early detection of patients at risk for pressure ulcer development is an important clinical issue, and patients with disturbed microcirculation might be particularly important to identify.54 Although immobility is regarded as the primary factor for pressure ulcer development, a lack of PIV might explain why some immobile patients develop pressure ulcers while others do not. Furthermore, if a non‐PIV response is a contributing factor for pressure ulcer development the conventional risk assessment scales are not comprehensive enough to identify patients at risk. Thus, clinically adapted PIV measurements in addition to risk assessment scales might increase the ability to identify persons at risk of pressure ulcer development.
4.1. Study limitations
The measurements in each position were not carried out on the same day. Any impact this may have had on the results was minimized by carrying out measurements at the same time on both measurement days and by following a standardized measurement procedure. The residents’ health statuses were stable and the nondifference in body temperature, pulse, and blood pressure between the measurement sessions supports this. Furthermore, the fact that the majority of the participants BF response were repeated at both occasions, either with PIV or non‐PIV, strengthens the reliability of this study.
The study design resulted in some data loss. As the aim was to explore the PIV response during long‐term measurements, four participants who had incomplete data were excluded from the analysis.
The interface pressure was registered and analyzed at the beginning of the pressure‐loading period but not throughout the measurement period. This was due to the fact that pressure measurement devices have the disadvantage of drifting during longer measuring periods and thus are not fully reliable.
The patients in this study had several medications, comorbidities, and various pressure ulcer risk, which is in congruence with an elderly patient population in general. The sample in this study is therefore considered to be representative of an elderly patient population and might thus, although not generalizable, be transferable to similar population in nursing homes and hospital wards.
5. Conclusion
The cutaneous BF responses among the nursing home residents were distinct, appeared early, and remained during the one hour of loading among both the participants with PIV response and those with non‐PIV response.
Perspectives
The participants with absent PIV responses had an insufficient BF almost immediately and that continued as long as pressure was sustained, a finding and pattern linked to pressure ulcer development. Early detection of patients at risk for pressure ulcer development is an important clinical issue, and patients with disturbed microcirculation might be particularly important to identify. Clinically adapted PIV measurements in addition to risk assessment scales might increase the sensitivity and specificity of pressure ulcer risk assessments.
Funding Information
This study was funded by the Research Council Södra Älvsborg Borås Sweden, the Research Council Östergötland Linköping Sweden, the Dermatology Department Research Foundation at Södra Älvsborg Hospital Borås Sweden, the SwedBank Sjuhärad Foundation for Research at the Södra Älvsborg Hospital Borås Sweden, the Södra Älvsborgs Hospital Borås Sweden, the King Gustaf V and Queen Victoria's Freemason Foundation, the NovaMedTech and European Union‐European Regional Development Fund, and the Swedish Medical Research Council and Faculty of Medicine and Health Science Linköping University, Linköping, Sweden.
Conflict of interests
No conflict of interest has been declared by the authors.
Acknowledgments
The study participants are acknowledged for their patience and cooperation, the nursing home staff members for all help during the research project, and Photomedia service, Södra Älvsborg Hospital, Borås, Sweden, for help with photos.
Källman, U. , Bergstrand, S. , Ek, A.‐C. , Engström, M. and Lindgren, M. .(2016), Blood flow responses over sacrum in nursing home residents during one hour bed rest, Microcirculation, 23: 530–539. doi: 10.1111/micc.12303
References
- 1. Spilsbury K, Nelson A, Cullum N, Iglesias C, Nixon J, Mason S. Pressure ulcers and their treatment and effects on quality of life: hospital inpatient perspectives. J Adv Nurs. 2007;57:494–504. [DOI] [PubMed] [Google Scholar]
- 2. Theisen S, Drabik A, Stock S. Pressure ulcers in older hospitalised patients and its impact on length of stay: a retrospective observational study. J Clin Nurs. 2012;21(3–4):380–387. [DOI] [PubMed] [Google Scholar]
- 3. NPUAP, EPUAP and PPPIA . Prevention and treatment of pressure ulcers: clinical practice guideline. In: Haesler E, eds. Perth, Western Australia: Cambridge Media; 2014: 292. [Google Scholar]
- 4. Kosiak M. Etiology and pathology of ischemic ulcers. Arch Phys Med Rehabil. 1959;40:62–68. [PubMed] [Google Scholar]
- 5. Bridel J. The aetiology of pressure sores. J Wound Care. 1993;2:230–238. [DOI] [PubMed] [Google Scholar]
- 6. Shilo M, Gefen A. Identification of capillary blood pressure levels at which capillary collapse is likely in a tissue subjected to large compressive and shear deformations. Comput Methods Biomech Biomed Engin. 2012;15:59–71. [DOI] [PubMed] [Google Scholar]
- 7. Ceelen KK, Oomens CWJ, Stekelenburg A, Bader DL, Baaijens FPT. Changes in intracellular calcium during compression of C2C12 myotubes. Exp Mechanics. 2009;49:25–33. [Google Scholar]
- 8. Leopold E, Gefen A. Changes in permeability of the plasma membrane of myoblasts to fluorescent dyes with different molecular masses under sustained uniaxial stretching. Med Eng Phys. 2013;35:601–607. [DOI] [PubMed] [Google Scholar]
- 9. Miller GE, Seale J. Lymphatic clearance during compressive loading. Lymphology. 1981;14:161–166. [PubMed] [Google Scholar]
- 10. Reddy NP, Cochran GVB, Krouskop TA. Interstitial fluid flow as a factor in decubitus ulcer formation. J Biomech. 1981;14:879–881. [DOI] [PubMed] [Google Scholar]
- 11. Peirce SM, Skalak TC, Rodeheaver GT. Ischemia‐reperfusion injury in chronic pressure ulcer formation: a skin model in the rat. Wound Rep Regen. 2000;8:68–76. [DOI] [PubMed] [Google Scholar]
- 12. Stekelenburg A, Gawlitta D, Bader DL, Oomens CW. Deep tissue injury: how deep is our understanding? Arch Phys Med Rehabil. 2008;89:1410–1413. [DOI] [PubMed] [Google Scholar]
- 13. Kallman U, Bergstrand S, Ek AC, Engstrom M, Lindgren M. Nursing staff induced repositionings and immobile patients’ spontaneous movements in nursing care. Int Wound J. 2015. doi: 10.1111/iwj.12435. [epub ahead of print] [DOI] [PMC free article] [PubMed] [Google Scholar]
- 14. Dinsdale S. Decubitus ulcers: role of pressure and friction in causation. Arch Phys Med Rehabil. 1974;55:147–152. [PubMed] [Google Scholar]
- 15. Nola GT, Vistnes LM. Differential response of skin and muscle in the experimental production of pressure sores. Plast Reconstr Surg. 1980;66:728–733. [DOI] [PubMed] [Google Scholar]
- 16. Bliss MR. Aetiology of pressure sores. Rev Clin Geront. 1993;3:379–397. [Google Scholar]
- 17. Witkowski JA, Parish L. Histopathology of the decubitus ulcer. J Am Acad Dermatol. 1982;6:1014–1021. [DOI] [PubMed] [Google Scholar]
- 18. Bouten C, Oomens C, Colin D, B D. The aetiopathology of pressure ulcers: a hierarchial approach In: Der Schrö G, eds. Pressure ulcer research ‐ current and future perspectives. Berlin‐Heidelberg: Springer; 2005: 219. [Google Scholar]
- 19. Abraham P, Fromy B, Merzeau S, Jardel A, Saumet JL. Dynamics of local pressure‐induced cutaneous vasodilation in the human hand. Microvasc Res. 2001;61:122–129. [DOI] [PubMed] [Google Scholar]
- 20. Fromy B, Abraham P, Saumet JL. Non‐nociceptive capsaicin‐sensitive nerve terminal stimulation allows for an original vasodilatory reflex in the human skin. Brain Res. 1998;811(1–2):166–168. [DOI] [PubMed] [Google Scholar]
- 21. Fromy B, Lingueglia E, Sigaudo‐Roussel D, Saumet JL, Lazdunski M. Asic3 is a neuronal mechanosensor for pressure‐induced vasodilation that protects against pressure ulcers. Nat Med. 2012;18:1205–1207. [DOI] [PubMed] [Google Scholar]
- 22. Fromy B, Sigaudo‐Roussel D, Gaubert‐Dahan ML et al. Aging‐associated sensory neuropathy alters pressure‐induced vasodilation in humans. J Inv Dermatol. 2010;130:849–855. [DOI] [PubMed] [Google Scholar]
- 23. Koïtka A, Abraham P, Bouhanick B, Sigaudo‐Roussel D, Demiot C, Saumet JL. Impaired pressure‐induced vasodilation at the foot in young adults with type 1 diabetes. Diabetes. 2004;53:721–725. [DOI] [PubMed] [Google Scholar]
- 24. Sae‐Sia W, Wipke‐Tevis DD, Williams DA. The effect of clinically relevant pressure duration on sacral skin blood flow and temperature in patients after acute spinal cord injury. Arch Phys Med Rehabil. 2007;88:1673–1680. [DOI] [PubMed] [Google Scholar]
- 25. Sanada H, Nagakawa T, Yamamoto M, Higashidani K, Tsuru H, Sugama J. The role of skin blood flow in pressure ulcer development during surgery. Adv Wound Care. 1997;10:29–34. [PubMed] [Google Scholar]
- 26. Bergstrand S, Kallman U, Ek AC et al. Pressure‐induced vasodilatation and reactive hyperemia at different depths in sacral tissue under clinically relevant conditions. Microcirculation. 2014;21:761–771. [DOI] [PubMed] [Google Scholar]
- 27. Popcock G, Richards CD. Human physiology ‐ the basis of medicine, 3rd edn New York: Oxford University Press; 2006. [Google Scholar]
- 28. McLellan K, Petrofsky JS, Zimmerman G et al. The influence of environmental temperature on the response of the skin to local pressure: the impact of aging and diabetes. Diab Technol Thera. 2009;11:791–798. [DOI] [PubMed] [Google Scholar]
- 29. Stephen‐Haynes J. Pressure ulceration and palliative care: prevention, treatment, policy and outcomes. Int J Palliat Nurs. 2012;18:9–16. [DOI] [PubMed] [Google Scholar]
- 30. Ek AC, Gustavsson G, Lewis DH. Skin blood flow in relation to external pressure and temperature in the supine position on a standard hospital mattress. Scand J Rehabil Med. 1987;19:121–126. [PubMed] [Google Scholar]
- 31. Källman U, Engstrom M, Bergstrand S et al. The effects of different lying positions on interface pressure, skin temperature, and tissue blood flow in nursing home residents. Biol Res Nurs. 2015;17:142–151. [DOI] [PubMed] [Google Scholar]
- 32. Fredriksson I, Larsson M, Strömberg T. Measurement depth and volume in laser Doppler flowmetry. Microvasc Res. 2009;78:4–13. [DOI] [PubMed] [Google Scholar]
- 33. Nilsson GE, Salerud G, Strömberg T, Wårdell K. Laser Doppler perfusion monitoring and imaging in: Vo‐Dinh T, ed. Biomedical photonics handbook. Boca Raton, Florida: CRC Press LLC; 2003. [Google Scholar]
- 34. Humeau A, Steenbergen W, Nilsson H, Strömberg T. Laser Doppler perfusion monitoring and imaging: novel approaches. Med Biol Eng Comput. 2007;45:421–435. [DOI] [PubMed] [Google Scholar]
- 35. Liao F, Burns S, Jan YK. Skin blood flow dynamics and its role in pressure ulcers. J Tissue Viability 2013;22:25–36. [DOI] [PMC free article] [PubMed] [Google Scholar]
- 36. Hagblad J, Lindberg LG, Andersson AK et al. A technique based on laser Doppler flowmetry and photoplethysmography for simultaneously monitoring blood flow at different tissue depths. Med Biol Eng Comput. 2010;48:415–422. [DOI] [PubMed] [Google Scholar]
- 37. Bergstrand S, Lindberg LG, Ek AC, Linden M, Lindgren M. Blood flow measurements at different depths using photoplethysmography and laser Doppler techniques. Skin Res Tech. 2009;15:139–147. [DOI] [PubMed] [Google Scholar]
- 38. Bergstrand S, Lanne T, Ek AC, Lindberg LG, Linden M, Lindgren M. Existence of tissue blood flow in response to external pressure in the sacral region of elderly individuals–using an optical probe prototype. Microcirculation. 2010;17:311–319. [DOI] [PubMed] [Google Scholar]
- 39. Hagblad J, Folke M, Lindberg LG, Lindén M. Technical issues related to the long‐term monitoring of blood flow at different depths using LDF and PPG. Physiol Meas. 2012;33:985–996. [DOI] [PubMed] [Google Scholar]
- 40. Lindgren M, Unosson M, Krantz AM, Ek AC. A risk assessment scale for the prediction of pressure sore development: Reliability and validity. J Adv Nurs. 2002;38:190–199. [DOI] [PubMed] [Google Scholar]
- 41. Källman U, Lindgren M. Predictive validity of 4 risk assessment scales for prediction of pressure ulcer development in a hospital setting. Adv Skin Wound Care. 2014;27:70–76. [DOI] [PubMed] [Google Scholar]
- 42. Poole D. Linear algebra a modern introduction. Pacific Grove, California: Brooks/Cole corp; 2003. 762 p. [Google Scholar]
- 43. Roustit M, Cracowski JL. Assessment of endothelial and neurovascular function in human skin microcirculation. Trends Pharmacol Sci. 2013;34:373–384. [DOI] [PubMed] [Google Scholar]
- 44. Bouten CV, Oomens CW, Baaijens FP, Bader DL. The etiology of pressure ulcers: Skin deep or muscle bound? Arch Phys Med Rehab. 2003;84:616–619. [DOI] [PubMed] [Google Scholar]
- 45. Oomens CWJ, Loerakker S, Bader DL. The importance of internal strain as opposed to interface pressure in the prevention of pressure related deep tissue injury. J Tissue Viability. 2010;19:35–42. [DOI] [PubMed] [Google Scholar]
- 46. Shoham N, Gefen A. Deformations, mechanical strains and stresses across the different hierarchical scales in weight‐bearing soft tissues. J Tissue Viability. 2012;21:39–46. [DOI] [PubMed] [Google Scholar]
- 47. Guyton AC, Hall JE. Guyton and Hall: textbook of medical physiology [Ebok]. Philadelphia: Saunders & Elsevier; 2011. [Google Scholar]
- 48. Jan YK, Struck BD, Foreman RD, Robinson C. Wavelet analysis of sacral skin blood flow oscillations to assess soft tissue viability in older adults. Microvasc Res. 2009;78:162–168. [DOI] [PubMed] [Google Scholar]
- 49. Ek AC, Lewis DH, Zetterqvist H, Svensson PG. Skin blood flow in an area at risk for pressure sore. Scand J Rehab Med. 1984;16:85–89. [PubMed] [Google Scholar]
- 50. Lee B, Benyajati S, Woods JA, Jan YK. Effect of local cooling on pro‐inflammatory cytokines and blood flow of the skin under surface pressure in rats: feasibility study. J Tissue Viability. 2014;23:69–77. [DOI] [PubMed] [Google Scholar]
- 51. Lachenbruch C. Skin cooling surfaces: estimating the importance of limiting skin temperature. Ostomy Wound Manage. 2005;51:70–79. [PubMed] [Google Scholar]
- 52. Lachenbruch C, Tzen YT, Brienza D, Karg PE, Lachenbruch PA. Relative contributions of interface pressure, shear stress, and temperature on ischemic‐induced, skin‐reactive hyperemia in healthy volunteers: a repeated measures laboratory study. Ostomy Wound Manage. 2015;61:16–25. [PubMed] [Google Scholar]
- 53. Frantz R, Xakellis GC, Arteaga M. The effects of prolonged pressure on skin blood flow in elderly patients at risk for pressure ulcers. Decubitus. 1993;6:16–20. [PubMed] [Google Scholar]
- 54. Coleman S, Gorecki C, Nelson EA et al. Patient risk factors for pressure ulcer development: systematic review. Int J Nurs Stud. 2013;50:974–1003. [DOI] [PubMed] [Google Scholar]