Abstract
Oxygen-to-sulfur substitutions in DNA phosphate often enhance affinity for DNA-binding proteins. Our previous studies have suggested that this effect of sulfur substitution of both OP1 and OP2 atoms is due to an entropic gain associated with enhanced ion-pair dynamics. In this work, we studied stereospecific effects of single sulfur substitution of either the OP1 or OP2 atom in DNA phosphate at the Lys57 interaction site of the Antennapedia homeodomain-DNA complex. By crystallography, we obtained the structural information on the RP and SP diastereomers of the phosphoromonothioate and their interaction with Lys57. By fluorescence-based assays, we found significant affinity enhancement upon sulfur substitution of the OP2 atom. By NMR spectroscopy, we found significant mobilization of the Lys57 side-chain NH3+ group upon sulfur substitution of the OP2 atom. These data provide further mechanistic insight into the affinity enhancement by oxygen-to-sulfur substitution in DNA phosphate.
Keywords: Dynamics, Ion pair, NMR spectroscopy, Phosphorothioate, Protein-DNA interaction
Graphical Abstract
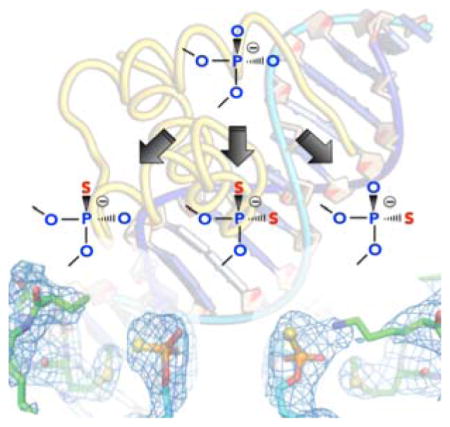
Oxygen-to-sulfur substitution in DNA phosphate can enhance protein-DNA binding affinity. To gain mechanistic insight into this phenomenon, we compared the impacts of 3 different types of phosphorothioation on binding affinity, ion-pair dynamics, and structure.
Introduction
Monothioate and dithioate-derivatives of phosphate are commonly used in oligonucleotides designed for potential therapeutic applications.[1] These derivatives, in which non-bridging oxygen is replaced with sulfur, retain the overall charge and similar tetrahedral covalent geometry of DNA phosphate, but increase resistance to nucleases and improve cell penetration properties.[2] Phosphoromonothioate is also naturally present in some bacterial genomes.[3] The role of phosphoromonothioate in vivo remains to be elucidated, though a potential role as an antioxidant was suggested.[4]
Interestingly, the oxygen-to-sulfur substitution of DNA phosphate is known to increase binding affinity for some proteins and some positions.[1c–e,5] Reduction in the binding free energy for the affinity enhancement by dithioation was ~0.6–0.8 kcal/mol for each phosphate that forms an ion pair with a protein side chain.[5a,5d] Therefore, >100-fold enhancement of binding affinity is theoretically possible by dithioation of several phosphate groups interacting with protein. Such enhancement will be helpful in designing oligonucleotides that target particular proteins for therapeutic purposes.[1b–f] However, from a physicochemical standpoint, the affinity enhancement by thioation may appear counterintuitive because sulfur atoms tend to serve as relatively poor hydrogen-bond acceptors and the electronegativity of sulfur is weaker than that of oxygen (2.58 vs. 3.44 by the Pauling scale).[6] It is not thoroughly understood why the thioation of phosphate can enhance protein-DNA binding affinity.
To better understand this phenomenon, we previously studied at the molecular and atomic levels how the association of the Antennapedia (Antp) homeodomain with DNA was impacted by the dithioation of the DNA phosphate at the Lys57 interaction site.[5d] Using fluorescence-based assays and isothermal titration calorimetry (ITC), we found that the affinity enhancement by this dithioation was entirely entropy-driven. Using NMR spectroscopy and X-ray crystallography, we found that the intermolecular ion pair of the Lys57 NH3+ and DNA phosphate groups became more dynamic upon dithioation, while maintaining their hydrogen bond. These data led us to the hypothesis that the affinity enhancement by the oxygen-to-sulfur substitution in DNA phosphate is largely due to an entropic gain arising from the mobilization of the ion pair at the protein-DNA interface.
In the current work, we extend the investigation of the same system to further test the hypothesis on the affinity enhancement by oxygen-to-sulfur substitution. To gain more mechanistic insight, we investigate the impacts of stereospecific sulfur substitutions for single non-bridging oxygen atoms in the phosphate group at the Lys57 interaction site of the Antp homeodomain-DNA complex. Although the monothioation involves RP and SP diastereomers, they can readily be isolated by chromatography. For each diastereomer, we examine the impacts of the oxygen-to-sulfur substitution on binding affinity, structure and dynamics using fluorescence-based assays, NMR spectroscopy, and X-ray crystallography. The results from these investigations further support the relationship between the ion-pair dynamics and binding affinity.
Experimental Section
Preparation of RP and SP diastereomers of monothioated DNA
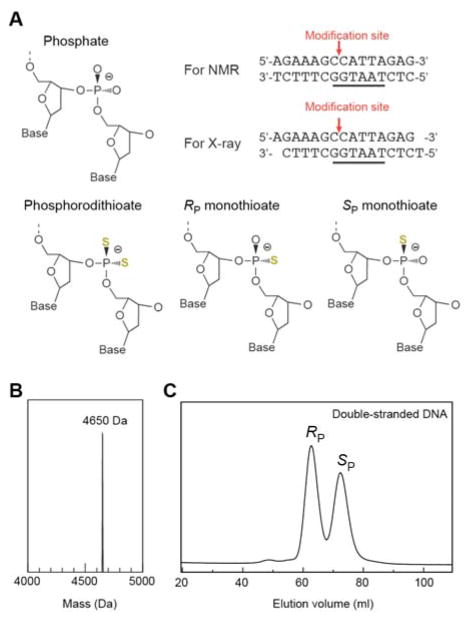
The DNA strands used in this study are shown in Figure 1A. Unmodified DNA strands were purchased from Integrated DNA Technologies. DNA strands containing a phosphoromonothioate group at the Lys57 interaction site were purchased from Sigma Aldrich. The incorporation of the phosphoromonothioate group, which is chiral at the phosphorous atom, was not stereospecific in the chemical synthesis and produced a mixture of the RP and SP diastereomers. Single-stranded DNA was purified via Mono-Q anion-exchange chromatography. Electrospray mass spectrometry measurement for the monothioated DNA strand was conducted by the Integrated DNA Technologies. Double-stranded DNA was formed by mixing equimolar amounts of the complementary stands followed by annealing from ~85 °C to room temperature over 1–2 hours. The DNA duplexes of the RP and SP diastereomers were isolated through the following two runs of Mono-Q anion-exchange chromatography. In the first run, minor amounts of excess single stranded DNA due to uncertainties in the concentrations of individual strands were removed using a buffer of 50 mM Tris•HCl (pH 7.5) and 1 mM EDTA in a gradient of 0–675 mM NaCl. Elution fractions containing the DNA duplexes of RP and SP species were separately collected and subjected to the second run for further isolation via a gentler gradient of 480–510 mM NaCl over 100 ml.
Figure 1.
Oxygen-to-sulfur substitution in the DNA phosphate at the Lys57 interaction site in the Antp homeodomain-DNA complex. (A) Two diastereomers (Rp and Sp) of monothioate were used in the current study, whereas a phosphorodithioate was used in our previous study. In Rp and Sp monothioations, a sulfur atom substitutes for OP2 and OP1, respectively. (B) Mass spectrometry data for the monothioated DNA strand. (C) Chromatogram in Mono-Q anion-exchange chromatography for 15-bp DNA duplexes containing a phosphoromonothioate at the Lys57 site. A diastereomeric mixture of the phosphoromonothioate of the DNA duplex gives two major peaks corresponding to the Rp and Sp diastereomers, which were confirmed by crystallography (see Figure 2).
Preparation of Protein
A 60 amino-acid construct of the fruit fly Antp homeodomain with the C39S mutation was expressed in E. coli cultured in minimal media containing 15NH4Cl as the sole nitrogen source. The amino-acid sequence of this protein is MRKRGRQTYTRYQTLELEKEFHFNRYLTRRRRIEIAH ALSLTERQIKIWFQNRRMKWKKEN. The protein was purified with SP-FF cation-exchange, S100 size-exclusion, and Resource-S cation-exchange columns (GE Healthcare), as previously described.[5d]
Crystallography
The Antp homeodomain bound to either the RP or SP-monothioated DNA was crystalized using the sitting-drop vapor diffusion method under the same conditions as previously used for the native and dithioated DNA complexes.[5d] For each of the two protein-DNA complexes, a solution containing ~1.8 mM DNA and 0.8 mM protein in a buffer of 5mM bis-Tris propane was made. For the reservoir buffers, 20 mM bis-Tris propane (pH 6.0–7.5), 10 mM NiCl2, and 4–6% 2-methyl-2,4-pentanediol (MPD) were used. The concentrations of the complexes and MPD and the pH were varied to optimize the crystallization. For each well, 1 μl of sample was mixed with 1 μl of reservoir buffer. Crystals were grown at 19°C over several days. For the RP-monothioated DNA complex, X-ray diffraction data were collected on a Bruker TXS Cu source with a D8 goniometer and Photon 100 detector. Twelve hundred and twenty five ¼°-wide frames were collected from a single crystal, in two omega sweeps with different crystal orientations. The diffraction images were processed and scaled using Proteum/SAINT, with an I/sigma of 1.8 resolution cutoff criteria. The data for the SP monothioated DNA complex were collected at the APS beamline 21-ID-F at a wavelength of 0.97921 Å using a Rayonix MX225 detector. A full hemisphere of data was collected with ½°-frames from a single crystal. Images were processed and scaled using HKL2000 to 2.75 Å, using the CC*>0.5 criteria for resolution cutoff. The crystallographic phase was determined by the molecular replacement method using PDB model 4XID[5d] in Phaser[7]. Refinement was performed using Phenix[8], with TLSMD[9] determined TLS parameters, weight optimization, and DNA restraints. Model building and validation were performed in Coot[10]. The covalent parameters from the quantum chemical calculations by Florián et al.[11] were used for the phosphoromonothioate. The atomic coordinates of the crystal structures of the RP and SP-monothioated complexes were deposited to the Protein Data Bank (PDB accession codes 5JLW and 5JLX, respectively).
Fluorescence-based competitive binding assays
The affinities of the Antp homeodomain for the RP and SP diastereomers were determined with competitive binding assays using fluorescence anisotropy as a function of unlabeled competitor DNA. Fluorescence arising from tetramethylrhodamine (TAMRA) label on the 3’-terminus of the DNA was measured with an ISS PC-1 spectrofluorometer. The competitive binding assays were employed rather than direct measurements via protein titration assays because this method is more precise when the dissociation constant Kd is close to or smaller than the probe concentration.[5d] The excitation and emission wavelengths were 533 nm and 580 nm, respectively. This assay used solutions of 10 nM 3’-TAMRA-labeled target DNA, 50 nM Antp homeodomain, and varied concentrations (0.5–6400 nM) of unlabeled competitor DNA. The buffer conditions were 10 mM sodium phosphate (pH 5.8) and 150 mM NaCl. Fluorescence anisotropy was measured for each solution at 25 °C as a function of the competitor concentration. The Kd constants were calculated from the fluorescence anisotropy data via non-linear least squares fitting using the MATLAB software (Mathworks), as previously described.[5d] The measurements were carried out four times for each monothioated DNA.
NMR spectroscopy
All NMR experiments for the Antp homeodomain-DNA complexes were performed with Bruker Avance III spectrometers operated at a 1H frequency of either 600 or 800 MHz. Each experiment was performed at 25 °C using a cryogenic probe. A 280 μl solution of 0.8 mM 15N-Antp homeodomain and 1.2 mM monothioated DNA in a buffer of 10 mM sodium phosphate (pH 5.8) and 20 mM NaCl was sealed into the inner tube (outer diameter 4.1 mm) of a 5-mm co-axial NMR tube (Shigemi). D2O for the NMR lock was separately sealed in the outer layer of the coaxial tube to avoid deuteration of NH3+ groups (i.e., NDH2+ and ND2H+ species). Protein backbone and side-chain 1H, 13C, and 15N resonances of the complex were previously assigned.[5d,12] Backbone 15N longitudinal and transverse relaxation rates (R1 and R2, respectively) were measured at 25 °C, from which the molecular rotational diffusion parameters for each complex were determined. 15N R1 and heteronuclear NOE for the Lys side-chain NH3+ groups of the complexes were measured at the 1H frequencies of 600 and 800 MHz, as described.[13] 15N R2 rates for the Lys side-chain NH3+ groups of the complexes were measured at the 1H frequency of 800 MHz, as described.[13] All NMR data were processed with NMRPipe program[14] and analyzed with NMRView program[15]. For each Lys NH3+ group, the generalized order parameter S2axis, the rotational correlation time for the symmetry axis τi, and the Cε-Nξ bond-rotation correlation time τf were determined using Mathematica, as previously described.[13] The NMR pulse programs and analysis scripts for investigating the dynamics of Lys side-chain NH3+ groups are available at www.scsb.utmb.edu/labgroups/iwahara/software.
Results
We conducted comparative investigations for the Antp homeodomain-DNA complexes that were identical in primary sequences, but differed in the DNA phosphate at the Lys57 interaction site (Figure 1A). In our previous study, we used dithioated (i.e., two sulfur atoms at the positions of the OP1 and OP2 atoms) and unmodified phosphate at this site.[5d] In the current study, we use two diastereomers (RP and SP) of the monothioated phosphate. In the RP phosphoromonothioate, the OP2 atom is replaced with sulfur, whereas in the SP phosphoromonothioate, the OP1 atom is replaced. The Lys57 side-chain NH3+ group is more proximal to the OP2 atom.
Isolation of Rp and Sp diastereomers of monothioated DNA
The DNA strand containing a phosphoromonothioate at the Lys57 interaction site was initially purified by Mono-Q anion-exchange chromatography. Though the RP and SP diastereomers could not be isolated at this stage, the expected mass (4,650 Da) of the monothioated strand (Figure 1B) was confirmed. By annealing an equimolar mixture of this and complementary strands, we prepared the double-stranded DNA. We further purified the double-stranded DNA by Mono-Q anion-exchange chromatography and obtained two major peaks of nearly the same magnitude (Figure 1C). We attributed these peaks to the Rp and Sp diastereomers because Frederiksen and Piccirilli reported such a separation for double-stranded RNA containing a phosphoromonothioate for which suitable resolution of the diastereomers could not be achieved for individual strands.[16] Their empirical rule suggested that the first and second peaks correspond to RP and SP diastereomers, respectively. Our crystallographic data confirmed that this was correct, as described below. The isolation of the Rp and Sp-monothioated DNA duplexes allowed us to characterize the stereospecific impacts of the oxygen-to-sulfur substitutions on the ion pair with the Lys57 side chain in the Antp homeodomain-DNA complex.
Crystal structures of the Rp and Sp-monothioated DNA complexes
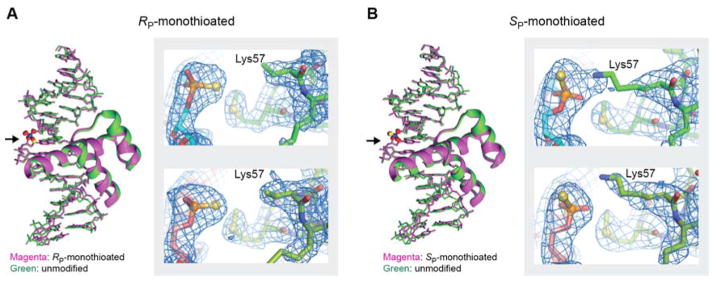
For each diastereomer of the monothioated DNA, we determined the crystal structure of the DNA complex with the Antp homeodomain. The crystal structure of the RP-monothioated DNA complex was solved at a 2.09 Å resolution (Figure 2A), whereas that of the SP-monothioated DNA complex was solved at a 2.75 Å resolution (Figure 2B). Table I provides a summary of the crystallographic data and structure refinement. Due to the different numbers of electrons in oxygen (8 electrons) and sulfur (16 electrons), the RP and SP diastereomers of the phosphoromonothioate group at the Lys57 site were readily distinguishable in the electron density maps, especially at a 2.09 Å resolution. The crystallographic results directly confirmed the stereochemical assignment of the two major peaks in the Mono-Q chromatogram (Figure 1C).
Figure 2.
Crystal structures of the Antp homeodomain-DNA complexes containing RP phosphoromonothioate (Panel A) or SP phosphoromonothioate (Panel B) at the Lys57 interaction site. The crystal structures of the RP and SP-monothioated DNA complexes were determined at 2.09 and 2.75 Å resolutions, respectively. For each panel, superposition of the crystal structures of the modified (green) and unmodified (purple) complexes is shown. The modification sites are shown in ball-stick representation. (indicated by arrows). For each modified complex, the electectron density map, of the phosphoromonothioate at Lys57 interaction site, for two structures in the asymmetric unit is shown. For the RP-monothioated DNA complex, the tip (i.e., Nξ, Cε, and Cδ groups) of the Lys57 side chain was not resolved in the crystallographic electron density map.
Table 1.
Crystallographic data collection and refinement statistics.
| RP-monothioated DNA complex (PDB ID: 5JLW) | SP-monothioated DNA complex (PDB ID: 5JLX) | |
|---|---|---|
| Crystallographic data collection | ||
|
| ||
| X-ray source | Bruker TXS | APS 21-ID-F |
| Wavelength (Å) | 1.54 | 0.97921 |
| Space group | P2221 | P2221 |
| Unit cell parameters (Å,°) | a = 61.27, b = 75.89, c = 93.70, | a = 60.86, b = 75.58, c = 91.88, |
| α = 90, β = 90, γ = 90 | α = 90, β = 90, γ = 90 | |
| Sample temperature (K) | 100 | 100 |
| Resolution range (Å) | 19.30 – 2.09 | 36.67 – 2.75 |
| Total reflections | 48110 | 9098 |
| Non-anomalous reflections | 25940 | 9098 |
| Completeness (%) | 97.5 (92.1) a) | 99.4 (99.1) a) |
| Multiplicity | 5.7 (4.2) a) | 6.4 (6.2) a) |
| Rmerge | 0.0791 (0.50) a) | 0.152 (1.2) a) |
| Rpim | 0.0499 (0.35) a) | 0.064 (0.513) a) |
|
| ||
| Refinement | ||
|
| ||
| Rwork (%) | 21.81 | 19.26 |
| Rfree (%) | 24.24 | 24.64 |
| Bond RMSD from ideal values (Å) | 0.009 | 0.007 |
| Angle RMSD from ideal values (°) | 1.1 | 0.8 |
| Ramachandran plot: | ||
| Favored (%) | 114 | 115 |
| Allowed (%) | 0 | 0 |
| Outliers (%) | 0 | 0 |
| No. non-H atoms [avg B-factor]: | ||
| Protein | 1067 [39] | 1048 [53] |
| DNA | 1218 [52] | 1218 [67] |
| Water | 212 [48] | 25 [48] |
Numbers in parentheses are for the last shell (2.19 2.09 Å for 5JLW and 3.15 2.75 Å for 5JLX).
Not surprisingly, the monothioation of a single phosphate group did not cause any drastic changes in the overall structures. Compared with our previous crystal structures of the unmodified and dithioated DNA complexes at a 2.7 Å resolution,[5d] the root-mean-square differences (r.m.s.d.) for the protein and DNA backbone atoms were less than 0.4 Å for both monothioated DNA complexes. Interestingly, the tip (i.e., the Nξ, Cε, and Cδ groups) of the Lys57 side chain, which should interact with the RP phosphoromonothioate, was disordered in the crystallographic electron density map. This was consistent with the finding that the Lys57 NH3+ group of the RP-monothioated complex showed the smallest NMR order parameter among the four complexes, as shown below.
Impact of Rp and Sp monothioation on protein-DNA binding affinity
Using fluorescence anisotropy-based competitive binding assays, we measured the binding affinities of the RP and SP-monothioated DNA duplexes for the Antp homeodomain (Figure 3A). The dissociation constants Kd at 150 mM NaCl were determined to be 3.0 ± 0.7 nM for the RP-monothioated DNA and 7.3 ± 0.8 nM for the SP-monothioated DNA. The uncertainties in the measured Kd values were calculated as the standard errors of the means for four independent measurements. In our previous work, the dissociation constants for the unmodified and dithioated DNA duplexes were determined to be 15.3 ± 0.8 and 4.0 ± 0.5 nM, respectively, by the same method under the same conditions.[5d] Thus, the RP-monothioated DNA duplex showed significantly stronger affinity than that of the unmodified DNA and virtually the same as that of the dithioated DNA. Figure 3B shows the thermodynamic impact of the modifications of the DNA phosphate at the Lys57 sites in terms of the free energies of the protein-DNA association. These data show that the sulfur substitution of the OP2 atom, which is closer to the Lys57 NH3+ group, yields a stronger impact on the affinity enhancement.
Figure 3.
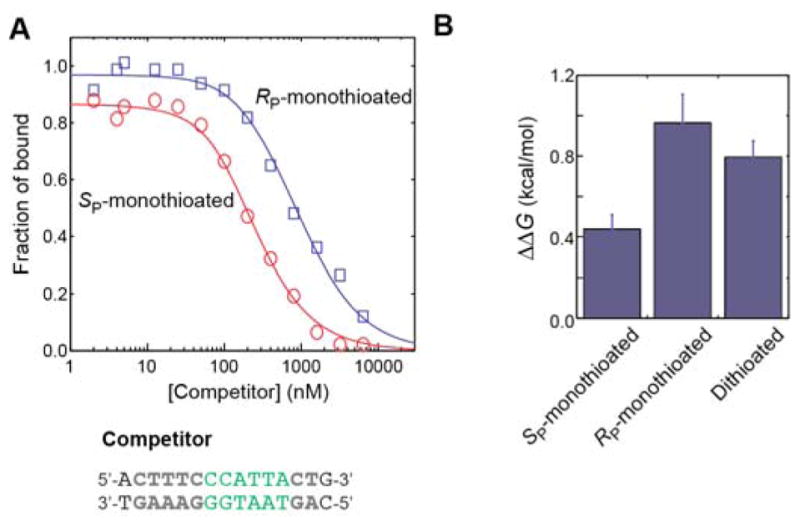
Impact of oxygen-to-sulfur substitution at Lys57 interaction site on binding affinity for the Antp homeodomain-DNA complex. (A) Competition assay data used to determine Kd constants for RP and SP-monothioated DNA duplexes. The total concentrations of the probe DNA and the protein were 10 and 50 nM, respectively in this experiment. The measurement was repeated four times. The solid lines represent best-fit curves. (B) Change in the binding free energy upon modifications of the DNA phosphate group at the Lys57 interaction site. In this case, ΔΔG is defined as ΔG (unmodified) – ΔG (modified). Data for the dithioated DNA duplexes are from our previous study.[5d]
Impact of Rp and Sp monothioation on ion-pair dynamics
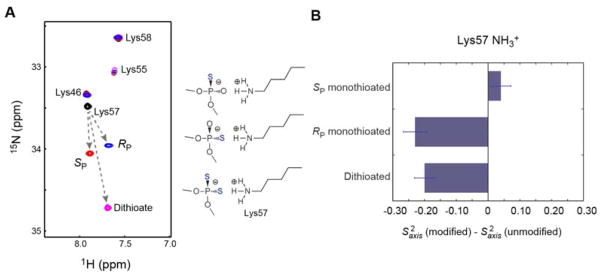
To investigate the impact of monothioation on the dynamics of the intermolecular ion pair with Lys57, we used the NMR methods for the Lys side-chain NH3+ groups. Figure 4A shows an overlay of the NH3+-selective 1H-15N heteronuclear in-phase single-quantum coherence (HISQC)[17] spectra recorded for Lys side chains of the Antp homeodomain in the complexes with the unmodified and modified DNA complexes. As reported previously,[5d,18] the dithioation of DNA phosphate significantly increased the 15N chemical shift of the interacting Lys NH3+ group. The monothioation of the interacting phosphate also significantly increased the 15N chemical shift of the Lys57 NH3+ group but to a lesser degree. The 1H-15N correlation signals from the Lys57 NH3+ group of the complexes with the Rp and Sp-monothioated DNA were observed at different positions.
Figure 4.
Impact of the oxygen-to-sulfur substitutions on the intermolecular ion pair with Lys57. (A) Overlaid Lys side-chain NH3+-selective 1H-15N HISQC spectra[17] recorded for the four complexes of the Antp homeodomain and DNA. These complexes chemically differ only in the DNA phosphate at the Lys57 interaction site (black, unmodified; blue, RP-monothioated; red, SP-monothioated; and magenta, dithioated). (B) Change in NMR-derived order parameters S2axis for Lys NH3+ groups upon oxygen-to-sulfur substitution in DNA phosphate at the Lys57 interaction site. The data for the unmodified and dithioated DNA complexes are from our previous study.[5d] These data show that sulfur substitution of the proximal phosphate oxygen (i.e., OP2) atom significantly mobilizes the Lys side-chain NH3+ group.
To analyze the internal motions of the interfacial Lys NH3+ groups, we collected 15N relaxation data at the 1H frequencies of 600 and 800 MHz. Using the 15N relaxation data, we determined the order parameters S2axis, bond-rotation correlation times τf, and reorientation correlation times τi for the Lys side-chain NH3+ groups of the Rp and Sp-monothioated DNA complexes, as described in our previous papers.[5a,5d,12–13,19] The values of these relaxation and dynamic parameters are shown in Table 2. Only Lys57 exhibited significant changes in the NH3+ order parameters upon Rp monothioation and dithioation of the phosphate. This is reasonable because only this Lys side chain is located at the modification site. We examined the changes in the order parameters upon the oxygen-to-sulfur substitution in the phosphate group at the Lys57 site (Figure 4B). The sulfur substitution of the OP2 atom, which is more proximal to the Lys 57 NH3+ group, via Rp monothioation or dithioation caused a significant increase in the mobility of the Lys57 NH3+ group, whereas the sulfur substitution of the OP1 atom via Sp monothioation did not. Importantly, the increase in the mobility of the intermolecular ion pair was associated with the increase in the protein-DNA affinity.
Table 2.
NMR data for Lys side-chain NH3+ groups in the complexes of the Antp homeodomain with RP and SP-monothioated DNA.a)
| Lys46 NH3+ | Lys55 NH3+ | Lys57 NH3+ | Lys58 NH3+ | |
|---|---|---|---|---|
| RP-monothioated DNA complex | ||||
| -800 MHz- | ||||
| 15N R1 (s−1) | 1.02 ± 0.01 | 0.50 ± 0.01 | 0.35 ± 0.01 | 0.31 ± 0.01 |
| 15N R2,ini (s−1) b) | 2.74 ± 0.07 | 1.83 ± 0.17 | 1.38 ± 0.08 | 1.10 ± 0.03 |
| 1H-15N NOE | −2.49 ± 0.05 | −2.75 ± 0.09 | −2.53 ± 0.06 | −2.60 ± 0.03 |
| -600MHz- | ||||
| 15N R1 (s−1) | 1.16 ± 0.02 | 0.53 ± 0.02 | 0.40 ± 0.01 | 0.32 ± 0.01 |
| 1H-15N NOE | −2.88 ± 0.07 | −3.00 ± 0.12 | −2.87 ± 0.09 | −2.93 ± 0.03 |
| -Dynamics- | ||||
| S2axis | 0.51 ± 0.01 | 0.41 ± 0.05 | 0.31 ± 0.02 | 0.25 ± 0.01 |
| τf (ps) | 240 ± 8 | 26 ± 11 | 12 ± 1 | 7.5 ± 0.3 |
| τi (ps) | 0.26 ± 0.93 | 243 ± 57 | 265 ± 19 | 214 ± 8 |
|
| ||||
| SP-monothioated DNA complex | ||||
| -800 MHz- | ||||
| 15N R1 (s−1) | 1.01 ± 0.01 | 0.51 ± 0.01 | 0.74 ± 0.01 | 0.29 ± 0.01 |
| 15N R2,ini (s−1) b) | 2.67 ± 0.06 | 1.60 ± 0.18 | 2.60 ± 0.02 | 1.41 ± 0.04 |
| 1H-15N NOE | −2.49 ± 0.04 | −2.74 ± 0.08 | −2.89 ± 0.02 | −2.53 ± 0.02 |
| -600MHz- | ||||
| 15N R1 (s−1) | 1.21 ± 0.02 | 0.56 ± 0.03 | 0.85 ± 0.01 | 0.32 ± 0.01 |
| 1H-15N NOE | −2.80 ± 0.05 | −2.92 ± 0.08 | −2.97 ± 0.02 | −2.98 ± 0.03 |
| -Dynamics- | ||||
| S2axis | 0.51 ± 0.01 | 0.34 ± 0.05 | 0.58 ± 0.01 | 0.31 ± 0.01 |
| τf (ps) | 249 ± 7 | 40 ± 53 | 49 ± 1 | 8.5 ± 0.3 |
| τi (ps) | 0.07 ± 0.29 | 285 ± 89 | 348 ± 14 | 130 ± 10 |
Measured at 25 °C and pH 5.8. Under these conditions, the Signals from the Lys2 and Lys18 NH3+ groups were not observed due to rapid hydrogen exchange with water.
The initial rate for intrinsically bi-exponential 15N transverse relaxation of NH3+.[13a]
Discussion
Mobilization of ion pair by oxygen-to-sulfur substitution in DNA phosphate
Our NMR and crystallographic data indicate that the sulfur substitution of the proximal non-bridging oxygen of the DNA phosphate mobilizes the interacting Lys side chain. The mobilization could be related to the relatively flat energy surface of H•••S hydrogen bonds and a larger effective radius of sulfur (1.84 Å for sulfur vs. 1.40 Å for oxygen)[6]. Theoretical quantum chemical studies have shown that when compared with H•••O hydrogen bonds, the enthalpy for H•••S hydrogen bonds is slightly smaller and has a flatter energy surface.[20] Due to the flatter energy surface for sulfur, a slight deviation from an ideal hydrogen bond geometry causes only a marginal increase in enthalpy and may allow for a wider spatial distribution of a Lys side-chain NH3+ group interacting with sulfur (Figure 5). This effect might make the Lys NH3+ group more dynamic. Oxygen-to-sulfur substitutions might also perturb the dynamic equilibrium of the contact ion-pair (CIP) and solvent-separated ion-pair (SIP) states.[21] As we recently demonstrated, the intermolecular ion pairs of Lys side-chain and DNA phosphate groups undergoes dynamic transitions between the CIP and SIP states on a sub-nanosecond timescale.[12] Oxygen-to-sulfur substitution in DNA phosphate might shift the CIP-SIP equilibrium of the intermolecular ion pair toward the SIP state, mobilizing the Lys NH3+ group. Weaker interactions of the sulfur atoms with water molecules [1f] might also contribute to mobilization of the intermolecular ion pair.
Figure 5.
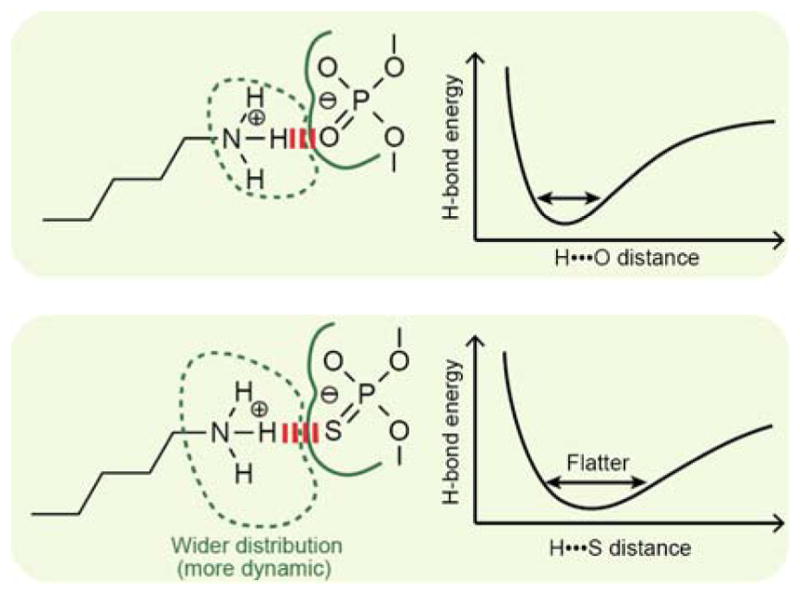
Possible reason for the mobilization of Lys57 side chain due to oxygen-to-sulfur substitution in DNA phosphate forming an intermolecular ion pair.
Role of ion-pair dynamics in protein-DNA association
Although three-dimensional structures of macromolecular complexes provide insights into the enthalpic terms of the binding free energy for each complex, the entropic aspects of binding free energy are not immediately clear from the structures alone unless the dynamic aspects are studied. Our current work presents such examples. The structural data alone would not predict higher affinities for the RP-monothioated and dithioated DNA complexes. Due to the absence of static interactions between Lys57 and DNA, one may even predict weaker affinities for these complexes. However, their affinities are actually stronger due to the entropic gain. As discussed in our previous paper,[5d] the enhanced dynamics of the intermolecular ion pair can at least partly account for the affinity enhancement. Our current study suggests that the ion-pair dynamics plays a role in protein-DNA association.
Implication on transcription factor decoys for therapeutic applications
Since Morishita et al. used short DNA duplexes as decoys to inhibit the transcription factor E2F for therapeutic applications in 1995,[22] the synthetic decoy DNA strategy has been examined for various transcription factors (reviewed in Refs.[23]). Typically, to increase stability against nucleases, all phosphate groups in the decoy DNA are replaced with phosphoromonothioate groups, each of which involves RP and SP diastereomers. Our data suggest that for monothioation of each phosphate that forms an intermolecular ion pair, only one of the two diastereomers of the DNA phosphoromonothioate can significantly enhance binding affinity. For a system involving a total of 6 intermolecular ion pairs, only 1 in 64 DNA molecules exhibits the strongest affinity. The use of dithioate at these positions should resolve this problem. However, dithioation of all phosphates in DNA is known to significantly shift DNA conformation from the canonical B-form to the A-form-like conformation.[24] A practical strategy to design high-affinity synthetic decoy DNA could be the selective use of dithioate only at the ion-pair sites and monothioate at the other sites.
Acknowledgments
This work was supported by Grant R01-GM105931 from the National Institutes of Health and Grant CHE-1307344 from the National Science Foundation (to. J.I.). We thank and Dr. Tianzhi Wang for the maintenance of the NMR spectrometers and Drs. Montgomery Pettitt, Chuanying Chen, David Volk, and David Gorenstein for useful discussions.
References
- 1.a) Eckstein F. Nucleic Acid Ther. 2014;24:374–387. doi: 10.1089/nat.2014.0506. [DOI] [PubMed] [Google Scholar]; b) King DJ, Bassett SE, Li X, Fennewald SA, Herzog NK, Luxon BA, Shope R, Gorenstein DG. Biochemistry. 2002;41:9696–9706. doi: 10.1021/bi020220k. [DOI] [PubMed] [Google Scholar]; c) Marshall WS, Beaton G, Stein CA, Matsukura M, Caruthers MH. Proc Natl Acad Sci U S A. 1992;89:6265–6269. doi: 10.1073/pnas.89.14.6265. [DOI] [PMC free article] [PubMed] [Google Scholar]; d) Marshall WS, Caruthers MH. Science. 1993;259:1564–1570. doi: 10.1126/science.7681216. [DOI] [PubMed] [Google Scholar]; e) Yang X, Bassett SE, Li X, Luxon BA, Herzog NK, Shope RE, Aronson J, Prow TW, Leary JF, Kirby R, Ellington AD, Gorenstein DG. Nucleic Acids Res. 2002;30:e132. doi: 10.1093/nar/gnf132. [DOI] [PMC free article] [PubMed] [Google Scholar]; f) Pallan PS, Yang XB, Sierant M, Abeydeera ND, Hassell T, Martinez C, Janicka M, Nawrot B, Egli M. Rsc Advances. 2014;4:64901–64904. [Google Scholar]; g) Yang XB, Mierzejewski E. New J Chem. 2010;34:805–819. [Google Scholar]
- 2.a) Wagner RW, Flanagan WM. Mol Med Today. 1997;3:31–38. doi: 10.1016/S1357-4310(96)10053-8. [DOI] [PubMed] [Google Scholar]; b) Wang S, Lee RJ, Cauchon G, Gorenstein DG, Low PS. Proc Natl Acad Sci U S A. 1995;92:3318–3322. doi: 10.1073/pnas.92.8.3318. [DOI] [PMC free article] [PubMed] [Google Scholar]; c) Cummins L, Graff D, Beaton G, Marshall WS, Caruthers MH. Biochemistry. 1996;35:8734–8741. doi: 10.1021/bi960318x. [DOI] [PubMed] [Google Scholar]
- 3.a) Wang L, Chen S, Vergin KL, Giovannoni SJ, Chan SW, DeMott MS, Taghizadeh K, Cordero OX, Cutler M, Timberlake S, Alm EJ, Polz MF, Pinhassi J, Deng Z, Dedon PC. Proc Natl Acad Sci U S A. 2011;108:2963–2968. doi: 10.1073/pnas.1017261108. [DOI] [PMC free article] [PubMed] [Google Scholar]; b) Wang L, Chen S, Xu T, Taghizadeh K, Wishnok JS, Zhou X, You D, Deng Z, Dedon PC. Nat Chem Biol. 2007;3:709–710. doi: 10.1038/nchembio.2007.39. [DOI] [PubMed] [Google Scholar]
- 4.Xie X, Liang J, Pu T, Xu F, Yao F, Yang Y, Zhao YL, You D, Zhou X, Deng Z, Wang Z. Nucleic Acids Res. 2012;40:9115–9124. doi: 10.1093/nar/gks650. [DOI] [PMC free article] [PubMed] [Google Scholar]
- 5.a) Anderson KM, Esadze A, Manoharan M, Bruschweiler R, Gorenstein DG, Iwahara J. J Am Chem Soc. 2013;135:3613–3619. doi: 10.1021/ja312314b. [DOI] [PMC free article] [PubMed] [Google Scholar]; b) Liang XH, Sun H, Shen W, Crooke ST. Nucleic Acids Res. 2015;43:2927–2945. doi: 10.1093/nar/gkv143. [DOI] [PMC free article] [PubMed] [Google Scholar]; c) Yang X, Fennewald S, Luxon BA, Aronson J, Herzog NK, Gorenstein DG. Bioorg Med Chem Lett. 1999;9:3357–3362. doi: 10.1016/s0960-894x(99)00600-9. [DOI] [PubMed] [Google Scholar]; d) Zandarashvili L, Nguyen D, Anderson KM, White MA, Gorenstein DG, Iwahara J. Biophys J. 2015;109:1026–1037. doi: 10.1016/j.bpj.2015.07.032. [DOI] [PMC free article] [PubMed] [Google Scholar]
- 6.Lide DR. CRC handbook of chemistry and physics. 84. CRC Press; Boca Raton, FL: 2003. [Google Scholar]
- 7.McCoy AJ, Grosse-Kunstleve RW, Adams PD, Winn MD, Storoni LC, Read RJ. J Appl Crystallogr. 2007;40:658–674. doi: 10.1107/S0021889807021206. [DOI] [PMC free article] [PubMed] [Google Scholar]
- 8.Headd JJ, Echols N, Afonine PV, Grosse-Kunstleve RW, Chen VB, Moriarty NW, Richardson DC, Richardson JS, Adams PD. Acta Crystallogr D Biol Crystallogr. 2012;68:381–390. doi: 10.1107/S0907444911047834. [DOI] [PMC free article] [PubMed] [Google Scholar]
- 9.Painter J, Merritt EA. Acta Crystallogr D Biol Crystallogr. 2006;62:439–450. doi: 10.1107/S0907444906005270. [DOI] [PubMed] [Google Scholar]
- 10.Emsley P, Lohkamp B, Scott WG, Cowtan K. Acta Crystallogr D Biol Crystallogr. 2010;66:486–501. doi: 10.1107/S0907444910007493. [DOI] [PMC free article] [PubMed] [Google Scholar]
- 11.Florián J, Strajbl M, Warshel A. J Am Chem Soc. 1998;120:7959–7966. [Google Scholar]
- 12.Chen C, Esadze A, Zandarashvili L, Nguyen D, Montgomery Pettitt B, Iwahara J. J Phys Chem Lett. 2015;6:2733–2737. doi: 10.1021/acs.jpclett.5b01134. [DOI] [PMC free article] [PubMed] [Google Scholar]
- 13.a) Esadze A, Li DW, Wang T, Brüschweiler R, Iwahara J. J Am Chem Soc. 2011;133:909–919. doi: 10.1021/ja107847d. [DOI] [PubMed] [Google Scholar]; b) Zandarashvili L, Esadze A, Iwahara J. Adv Protein Chem Struct Biol. 2013;93:37–80. doi: 10.1016/B978-0-12-416596-0.00002-6. [DOI] [PubMed] [Google Scholar]
- 14.Delaglio F, Grzesiek S, Vuister GW, Zhu G, Pfeifer J, Bax A. J Biomol NMR. 1995;6:277–293. doi: 10.1007/BF00197809. [DOI] [PubMed] [Google Scholar]
- 15.Johnson BA, Blevins RA. J Biomol NMR. 1994;4:603–614. doi: 10.1007/BF00404272. [DOI] [PubMed] [Google Scholar]
- 16.Frederiksen JK, Piccirilli JA. Methods Enzymol. 2009;468:289–309. doi: 10.1016/S0076-6879(09)68014-9. [DOI] [PubMed] [Google Scholar]
- 17.Iwahara J, Jung YS, Clore GM. J Am Chem Soc. 2007;129:2971–2980. doi: 10.1021/ja0683436. [DOI] [PubMed] [Google Scholar]
- 18.Anderson KM, Nguyen D, Esadze A, Zandrashvili L, Gorenstein DG, Iwahara J. J Biomol NMR. 2015;62:1–5. doi: 10.1007/s10858-015-9909-8. [DOI] [PMC free article] [PubMed] [Google Scholar]
- 19.Zandarashvili L, Iwahara J. Biochemistry. 2015;54:538–545. doi: 10.1021/bi5012749. [DOI] [PubMed] [Google Scholar]
- 20.a) Howard DL, Kjaergaard HG. Phys Chem Chem Phys. 2008;10:4113–4118. doi: 10.1039/b806165c. [DOI] [PubMed] [Google Scholar]; b) Wennmohs F, Staemmler V, Schindler M. J Chem Phys. 2003;119:3208–3218. [Google Scholar]
- 21.Iwahara J, Esadze A, Zandarashvili L. Biomolecules. 2015;5:2435–2463. doi: 10.3390/biom5042435. [DOI] [PMC free article] [PubMed] [Google Scholar]
- 22.Morishita R, Gibbons GH, Horiuchi M, Ellison KE, Nakajima M, Zhang L, Kaneda Y, Ogihara T, Dzau VJ. Proc Natl Acad Sci U S A. 1995;92:5855–5859. doi: 10.1073/pnas.92.13.5855. [DOI] [PMC free article] [PubMed] [Google Scholar]
- 23.a) Mann MJ, Dzau VJ. J Clin Invest. 2000;106:1071–1075. doi: 10.1172/JCI11459. [DOI] [PMC free article] [PubMed] [Google Scholar]; b) Morishita R, Higaki J, Tomita N, Ogihara T. Circ Res. 1998;82:1023–1028. doi: 10.1161/01.res.82.10.1023. [DOI] [PubMed] [Google Scholar]
- 24.a) Cho Y, Zhu FC, Luxon BA, Gorenstein DG. J Biomol Struct Dyn. 1993;11:685–702. doi: 10.1080/07391102.1993.10508023. [DOI] [PubMed] [Google Scholar]; b) Volk DE, Yang X, Fennewald SM, King DJ, Bassett SE, Venkitachalam S, Herzog N, Luxon BA, Gorenstein DG. Bioorg Chem. 2002;30:396–419. doi: 10.1016/s0045-2068(02)00510-2. [DOI] [PubMed] [Google Scholar]


