

Abstract
Chronic myelomonocytic leukemia (CMML) is a hematologic malignancy nearly confined to the elderly. Previous studies to determine incidence and prognostic significance of somatic mutations in CMML have relied on candidate gene sequencing, although an unbiased mutational search has not been conducted. As many of the genes commonly mutated in CMML were recently associated with age-related clonal hematopoiesis (ARCH) and aged hematopoiesis is characterized by a myelomonocytic differentiation bias, we hypothesized that CMML and aged hematopoiesis may be closely related. We initially established the somatic mutation landscape of CMML by whole exome sequencing followed by gene-targeted validation. Genes mutated in ⩾ 10% of patients were SRSF2, TET2, ASXL1, RUNX1, SETBP1, KRAS, EZH2, CBL and NRAS, as well as the novel CMML genes FAT4, ARIH1, DNAH2 and CSMD1. Most CMML patients (71%) had mutations in ⩾ 2 ARCH genes and 52% had ⩾ 7 mutations overall. Higher mutation burden was associated with shorter survival. Age-adjusted population incidence and reported ARCH mutation rates are consistent with a model in which clinical CMML ensues when a sufficient number of stochastically acquired age-related mutations has accumulated, suggesting that CMML represents the leukemic conversion of the myelomonocytic-lineage-biased aged hematopoietic system.
INTRODUCTION
Chronic myelomonocytic leukemia (CMML) is a myeloproliferative neoplasm that combines proliferative with dysplastic features and has a poor prognosis.1 Although the frequency of many hematologic malignancies increases with age, the bias toward older age is particularly striking in CMML, which is extremely rare in individuals below the age of 50 years, with a very steep rise in incidence in patients over 70 years.2,3 Previous studies have identified a set of recurrent somatic CMML mutations, some of which are associated with prognosis (Supplementary Table S1).4–15 The emerging picture is complex, but likely to be incomplete, owing to the fact that previous work has focused on genes with a known myeloid leukemia or myelodysplastic syndrome association, although an unbiased screen has not been reported. Several recent studies have described low-level somatic mutations in blood samples from hematologically normal healthy individuals, a phenomenon termed age-related clonal hematopoiesis (ARCH).16–19 Some of the ARCH mutations involve genes with a high mutation prevalence in CMML, such as TET2 and ASXL1.5,14 Given the steep increase of CMML incidence with age and the observation that a myelomonocytic differentiation bias characterizes aged hematopoiesis,20 we decided to investigate the relationship between CMML and ARCH from an epidemiological and genetic perspective. To this end, we first established the somatic mutation spectrum of CMML, using an unbiased whole exome sequencing (WES) screen to identify candidate CMML genes, followed by targeted sequencing of a larger validation cohort to determine frequency. CMML mutation rates and spectrum match remarkably well with age-specific CMML population incidence and reported ARCH mutations, suggesting CMML arises through acquisition of successive mutations that eventually convert a myelomonocytic bias into overt leukemia.
MATERIALS AND METHODS
Patients/controls
Patients with a diagnosis of CMML according to the 2008 World Health Organization criteria were recruited at the Huntsman Cancer Institute (University of Utah), Knight Cancer Institute (Oregon Health and Science University) or Stanford University Cancer Institute after consenting to local Institutional Review Board (IRB)-approved protocols. Chart review was performed to confirm the diagnosis of CMML. Controls included 28 samples from younger individuals (age <45 years).
Samples/purification of cells
For the discovery cohort (N = 21), leukemia cells (CD33+ (N = 14) or CD14+ (N = 7)) and T cells (CD3+, constitutional control) were fluorescence-activated cell sorted from fresh or cryopreserved blood, or bone marrow mononuclear cells (MNCs), to >90% purity. In some cases, CD3+ cells were expanded from frozen MNCs to generate sufficient DNA for WES, as described.21,22 In one case, a skin biopsy was used. DNA quality before sequencing was evaluated using a 2200 Tapestation (Agilent Technologies, Inc., Santa Clara, CA, USA). For the validation cohort (N = 69 patients different from the discovery cohort), CD14+ cells, MNC or the paraffin-embedded clot section of bone marrow biopsies were used. DNA was extracted from CD3+ and CD14+ cells or MNCs using DNeasy Blood & Tissue kit (Qiagen, Germantown, MD, USA) and from clot sections (N = 35) using RecoverAll Total Nucleic Acid Isolation kit (Ambion, Foster City, CA, USA). DNA concentration was measured with Qubit dsDNA HS Assay (Invitrogen, Carlsbad, CA, USA). Total white blood cells or paraffin-embedded clot sections of morphologically normal bone marrow biopsies from controls was processed in the same way. For analysis of candidate gene mRNA expression, CD34+ and CD14+ cells were fluorescence-activated cell sorted using CD34-PE and CD14-FITC antibodies (Miltenyi Biotec, Bergisch Gladbach, Germany) from fresh or cryopreserved MNC of an additional cohort of 12 CMML patients.
Discovery cohort samples enrichment/sequencing/analysis
Discovery cohort samples consisting of paired tumor-constitutional DNA were subjected to WES. Exome enrichment from DNA was performed with TruSeq (Illumina, San Diego, CA, USA) with subsequent WES performed on an Illumina HiSeq 2000 sequencer, and multiplexing at four samples per lane. Fastq files were aligned to hg19 by Novoalign (http://novocraft.com), with default settings to create initial bam files followed by standard GATK pipeline procedures.23 The VarScan 2 program24 was used for variant calling on mpileup files created by SAMtools25 and variants were annotated using ANNOVAR,26 OMIM and additional publicly available databases with internal coding. A threshold of 20% variant allele frequency (VAF) in the tumor sample was required for somatic single nucleotide variant (SNV)/indel calls with corresponding VAF in normal samples being <3% if >20 reads. Likelihood of resulting amino acid substitutions to be deleterious was also assessed by using the deleterious matrix of the VAAST program,27 to assess the prevalence of the given mutation in the 1000 genomes (http://www.1000genomes.org/) to the presence in the HGMD database (http://www.hgmd.org/). These values correspond to a likelihood ratio of such prevalence, giving an empirical indication that such changes could be associated with disease.
Gene selection for validation cohort
Genes with a high likelihood of yielding false-positive mutation calls were eliminated from further investigation, based on reports by others28 and our previous experience with sequencing of such genes. Many of these genes contain highly repetitive or variable elements that make accurate mapping difficult, including the Mucin and human leukocyte antigen gene families. Filtering: synonymous mutations, SNVs listed in 1000 Genomes (as annotated by ANNOVAR) and variants/indels not occurring in exonic or splicing regions were excluded. The actual number of variant reads in both the tumor and normal sample was also used in filtering probable sequencing/mapping artifacts. Any variant also found present in the constitutional DNA sample could have no more than 1 read if normal variant frequency <5%, 2 reads if normal variant frequency <3%, and 3+ reads if normal variant frequency <1%. Recurrence: we hypothesized that somatic variants found to occur in multiple samples would have a greater likelihood of being disease associated. Hence, we assessed recurrence of genes with nonsynonymous variants/frameshift indels in multiple samples. We also assessed recurrence of hotspot mutations (such as occurs for SRSF2). Controls were used to eliminate potential false-positives due to sequencing/alignment artifacts in this analysis. Prioritization: in order to prioritize genes for further assessment, candidates were grouped into four priority groups for selection. Priority Group 1: genes with recurrence, that is, a filtered SNV/indel in the same gene in ⩾ 2 of 21 samples. Priority Group 2: genes with a filtered SNV/indel in only one single CMML patient, yet with the SNV/gene meeting 2 or more of the following criteria: (i) presence in COSMIC database;29 (ii) VAAST LRT score ⩾ 2; (iii) presence in OMIM database; (iv) somatic P-value <10−5. Priority Group 3: genes meeting only a single priority group 2 criterion, but with prior cancer or CMML association, or suggestive biology. Priority Group 4: genes without SNV/indels, but reported association with myeloid malignancies.
Validation cohort samples enrichment/sequencing/analysis
For validation cohort and younger control samples, targeted exonic sequencing of the selected genes was performed on enriched DNA using the HaloPlex system (Agilent Technologies, Inc.) with probes designed in SureDesign (Agilent Technologies, Inc.), to achieve a median capture of >99% of targeted exons. Orthogonal validation (re-assessment of mutations from original DNA using an alternative enrichment followed by sequencing) was performed on a random selection of CMML samples having sufficient remaining original DNA using the SureSelect XT2 (Agilent Technologies, Inc.) custom enrichment kit (design identical to Haloplex experiments). DNA from both alternative enrichment methods were sequenced independently on a HiSeq 2000, each multiplexed with the aim of achieving >300× coverage. Sequence alignment and variant calling/annotation were performed as in the discovery cohort, with the exception of duplicate reads being left in analyses of data coming from HaloPlex primers. This was necessary, as only a maximum of six unique targets are created to cover each base with that platform. All CMML variant calls were required to be detected at a threshold of 10% and with 20+ total reads in Haloplex and confirmation with identical thresholds by SureSelect. In addition, all variants were required to be present in the design region submitted for targeted sequencing. Detection of any variant reported at >0.1% population frequency in any of 1000 genomes, NHLBI Exome Sequencing Project (ESP6500 (all) http://evs.gs.washington.edu/EVS/) or the UCSC database (http://genome.ucsc.edu) when the allele count was available and reported to be ⩾ 400 was excluded from all analyses.
Fidelity of enrichment/sequencing/Sanger validation
Enrichment or sequencing failure is a potential risk that can result in inaccurate prevalence estimates of mutations observed. To detect such, we assessed the frequency of wild-type calls at 25 rare SNPs in the exonic targeted regions that have <5% population frequency in several ethnic cohorts. Determination of samples which performed well from those with many no-calls due to no or low coverage at these SNPs was clear from the data (Supplementary Figure S1). All samples considered passing had at least 44/50 reference alleles called. Fifty-two of the mutations called orthogonally present in CMML samples by both Haloplex and SureSelect XT2 enrichment were randomly selected and DNA sent for external validation (Genewiz, South Plainfield, NJ, USA). All mutations (100%) were confirmed.
Comparison of CMML and control variants
Young controls were used to initially identify and filter out genes with mutation calls likely to be a result of sequencing or mapping artifacts. Variants observed in any young control at >3% VAF were automatically removed. The CMML and young control samples were randomized and simultaneously sequenced on the Haloplex platform.
Comparison of ARCH rates in CMML and other cohorts
Two other studies have published age incidence data in their reports of ARCH gene mutations.16,17 McKerrell et al.17 investigated only a few hotspot mutations, but at high depth, whereas the data of Xie et al.16 were derived from WES at lower depth. Comparison of hotspot mutation rates between these two data sets showed considerable differences, indicating the benefit of higher depth for assessing ARCH rates. Our targeted probe of entire genes (as opposed to just hotspot locations) at higher depth is more akin to a combination of these two approaches. Hence, for comparison we estimated the proportion of hotspot mutations reported by McKerrell et al.17 as a proportion of all mutations detected by Xie et al.16 and then used that to estimate the overall ARCH rate McKerrell et al.17 may have detected if probing the entire gene at high depth (Supplementary Table S2).
mRNA expression
Total RNA isolated from CD14+ and CD34+ cells using RNA Easy Kit (Qiagen) from 12 newly diagnosed untreated CMML patients was converted to single-stranded cDNA using High Capacity cDNA Reverse Transcription Kit (Life Technologies, Carlsbad, CA, USA) as recommended by the manufacturer. Multiplex pre-amplification of 38 specific cDNA targets (Supplementary Table S3) was performed to increase the quantity of the desired targets for gene expression analysis using TaqMan PreAmp Master Mix (Life Technologies) as recommended by the manufacturer. The product of the pre-amplified reaction was diluted fivefold before gene expression analysis. Quantitative PCR analysis was performed with duplicates using Taqman fast Advanced Master Mix (Life Technologies) in 384-well plates using QuantStudio 12K Flex Real-Time PCR System (Life Technologies). Gene expression of GUSB, ABL1 and GAPDH was compared in all samples and found to be highly correlated; GUSB was selected as the control gene for all experiments. Data were analyzed using QuantStudio 12K Flex software. mRNA expression for each gene was normalized relative to GUSB expression and expressed as 2ΔCt.
CMML incidence rates
CMML incidence rates stratified by age of diagnosis and gender were obtained from the Cancer in North America (CINA) Surveillance, Epidemiology and End Results Program (www.seer.cancer.gov) SEER*Stat Database: NAACCR Incidence—CiNA Analytic File, 1995–2011, for Expanded Races, Standard File, North American Association of Central Cancer Registries. The database was queried for all CMML diagnoses entered between 2005 and 2011 in the United States and Canada. Rates were standardized to the US 2000 population. Confidence intervals were computed on data falling within 10-year age brackets using the methods published by Tiwari et al.30
Multi-hit mutation modeling
Computational models were used to estimate the predicted incidence rate versus age for a constant mutation accrual hypothesis (Supplementary Table S4). Such models assumed that all individuals in a population acquire somatic alterations at an average rate over the course of their life; those acquiring mutations in the required number of genes progress to the disease. Hence, we assumed the stochastic model:
where α represents the average mutation rate, N represents the initial population size, S(i,j) represents the number of persons in year i not having had a total of j mutations and I(i,j) represents the number of persons in year i having their jth mutation in that year.
By calculating the relative incidence rate to that of a particular age (in our case 80 years), these rates become approximately independent of the actual mutation rate for assessing age-incidence patterns and proportions (hence, we did not need to estimate the average mutation rate of crucial CMML genes, which could be different from the overall genome-wide mutation rate in humans). Combined US and Canadian CMML incidence rates from 2005 to 2011 (CINA) were similarly adjusted to their observed rate at 80 years for comparison.
Survival analyses
Survival data were available for 48 patients for whom sequencing was also performed and was successful. An expanded cohort for univariate survival analyses of clinical variables only consisted of 91 persons and incorporated all of the aforementioned individuals. Correlation of clinical variables/mutations with survival were established using log-rank tests and Cox proportional hazards regression. Several clinical/mutational presence variables were moderately to highly correlated with each other (Supplementary Table S5).
Order of mutation estimation
Estimation of the order of mutation was based on SureSelect XT2 VAF with frequencies >0.5 assumed to come from regions of loss of heterozygosity (similar overall results obtained with threshold of 0.6). The highest final frequency was used when multiple tumor mutations for a gene occurred. Normalized order of mutation appearance in each person was calculated as , allowing all multiple hits for genes in a person to count toward that total.
Statistical analyses and plots
Coverage estimates of each platform/cohort are the median of the average read depth of the targeted exonic regions for the respective samples. Estimated logit models were used for odds ratio calculations with 0.5 added to all cells containing no observations. Distribution comparisons were made with an exact two-sided Wilcoxon’s test. Logistic regression was used for testing age association with gene mutation status. Multiple comparison tests on mutation differences by gene were adjusted for by the method of Bonferroni. All statistical analyses were performed in SAS version 9.3 (SAS Institute, Cary, NC, USA). Survival plots were generated in Prism version 6.04 (GraphPad Software, La Jolla, CA, USA).
RESULTS
WES was performed on leukemia (78× coverage) and constitutional (85× coverage) DNA from 21 CMML patients (discovery cohort, Supplementary Table S6), to identify potential CMML-related genes for high-depth sequencing in a validation cohort. To minimize false negatives we used liberal criteria to call potential somatic variants (Supplementary Table S7). For validation we selected 215 discovery cohort genes, using recurrence in ⩾ 2 samples as the key criterion (see Materials and Methods). An additional 61 genes were selected based on associations with myeloid malignancies reported in COSMIC, HGMD or OMIM (Supplementary Table S8). Samples from a validation cohort of 80 CMML patients and 28 non-leukemic younger controls (<45 years) were sequenced at high depth for the exons of these 276 genes. Initial sequencing was performed using Haloplex enrichment (1134× average coverage, which for this enrichment technology only uses duplicate reads). Secondary, orthogonal validation sequencing of CMML samples was performed with SureSelect XT2 enrichment (368× average coverage) again targeting all 276 genes. For quality assessment, calling fidelity was determined for known polymorphic alleles and only high-quality samples (69 out of the initial 80 CMML (median age 69 years, outlier with age 36 years, range of remainder 52–93 years) and 22 out of the initial 28 normal controls (median age 34 years, range 22–43 years)) were included in subsequent analyses (Supplementary Figure S1). High stringency was applied to mutation calling in the validation cohort. Positive calls were required to have orthogonal confirmation across platforms and high sequencing depth (20× mandatory minimum depth on both platforms for variant calls), and the absence from simultaneously run young controls and three population databases (1000 Genomes (all), ESP6500 and UCSC database) at >0.1% frequency. Ninety-eight percent of the 507 total variants orthogonally called had ⩾ 10 variant reads. Synonymous and non-exonic mutations were excluded, except splice site mutations. Variants meeting these criteria were detected in 166 genes (Supplementary Tables S9 and S10). Fifty-two representative mutations (10.3%) were sequenced a third time (Sanger), with 100% confirmation rate (Supplementary Table S11), demonstrating the high confidence achievable using the orthogonal sequencing approach.
We identified 13 genes with mutations in ⩾ 10% of CMML patients (SRSF2, TET2, ASXL1, RUNX1, SETBP1, KRAS, EZH2, CBL, FAT4, ARIH1, DNAH2, CSMD1 and NRAS) and 30 genes with mutations in ⩾ 5% (Figure 1a and Supplementary Table S9). SRSF2 (52%), TET2 (52%) and ASXL1 (36%) were most frequently mutated. Of the 69 patients represented in this analysis, 67 (97%) had ⩾ 1 mutation in the 13 genes mutated at ⩾ 10% prevalence. Mutations in FAT4, ARIH1, DNAH2 and CSMD1 have not previously been reported in CMML. Of the genes with 5–10% mutation prevalence, PTCH1, CDH23, BCR, CBFA2T3, TRPM1, DNAH7, VCAN, IRS1, PCDHB1, MAML2 and WNK2 have not previously been associated with CMML. As a first step in functionally implicating candidates in CMML pathogenesis, we measured mRNA expression for the 30 most prevalently mutated genes in 12 additional CMML samples. FAT4, ARIH1, CDH23, BCR, CBFA2T3, VCAN, IRS1, PCDHB1, WNK2 and MAML2 were expressed in CD34+ or CD14+ cells, or both, whereas expression of DNAH2, CSMD1, PTCH1, TRPM1 and DNAH7 was very low or absent from both cell types (Figures 1b and c), suggesting that mutations in these genes are less likely to be involved in CMML pathogenesis or exert their effects at the level of more primitive cells.
Figure 1.
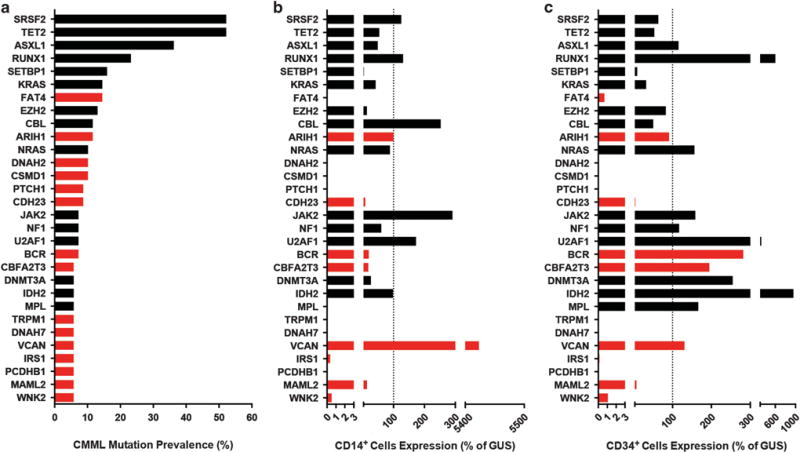
Most prevalent genes mutated in CMML. (a) Genes ordered by prevalence of mutation in CMML (N = 69). (b) Median relative expression (% of GUSB) in CD14+ cells from 12 unrelated CMML patients. (c) Median relative expression (% of GUSB) in CD34+ cells from 12 unrelated CMML patients. Red bars indicate genes not previously associated with CMML.
Several clinical variables have been previously associated with overall survival (OS) in CMML, although specific variables and cutoff values differ between studies1,8,31,32 (Supplementary Table S1). In univariate analysis of an expanded cohort, low hemoglobin and high white blood cell count were associated with shorter OS, whereas therapy with the hypomethylating agents 5-azacytidine or decitabine increased OS by 2.5 years (P = 0.0057; Supplementary Table S12). ASXL1, EZH2 and NRAS mutations were associated with shorter OS (Supplementary Figure S2). Many patients (52%) had ⩾ 7 mutations (Figures 2a and c), which correlated with shorter OS (0.6 versus 2.9 years, P = 0.0001; Figure 2b and Supplementary Table S12). Exploratory multivariate analysis identified two predictive models: (1) mutation count (total mutations ⩾ 7) (hazard ratio = 4.36, P = 0.0006) plus hypomethylating agent treatment (hazard ratio = 0.43, P = 0.0380; no significant interaction) and (2) NRAS mutation (hazard ratio = 4.53, P = 0.0046) plus hypomethylating agent therapy (hazard ratio = 0.39, P = 0.0220; no significant interaction; Supplementary Figure S2 and Supplementary Tables S5 and S13).
Figure 2.
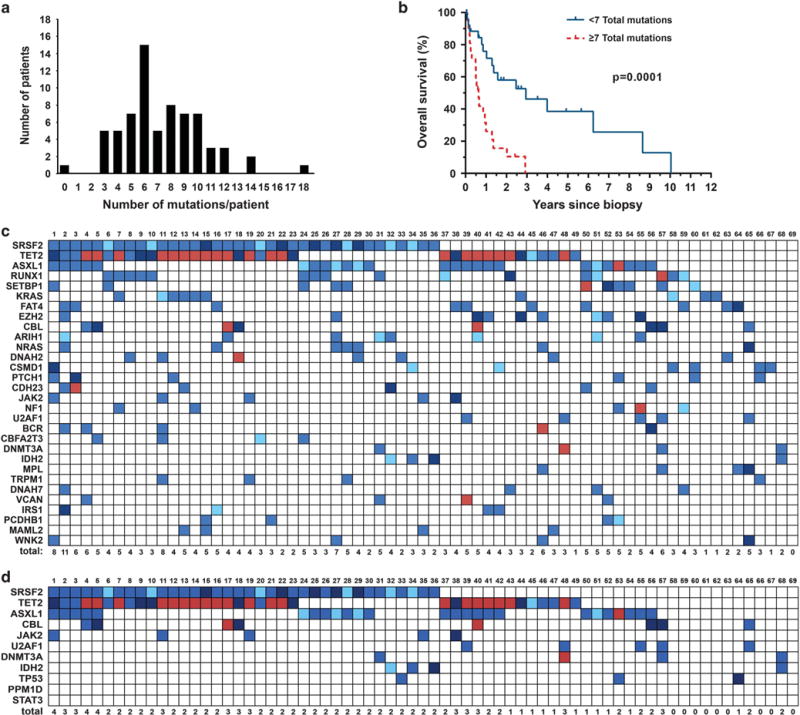
CMML mutation characteristics and survival. (a) Distribution of number of mutations observed in each CMML patient (N = 69). (b) OS by total mutational burden in CMML patients (N = 48). (c) Concomitance of frequently mutated genes in CMML (N = 69). Light blue indicates tumor variant frequency (TVF) <30%, blue indicates 30% <TVF< 60%, dark blue indicates TVF ⩾60% and red indicates multiple mutations. (d) Concomitance of mutations in 11 recently reported ARCH genes assessed in CMML patients (N = 69).
Many ARCH genes identified in recent studies are identical to those previously associated with CMML, including SRSF2, TET2, ASXL1, TP53, JAK2, CBL and DNMT3A,16–19 suggesting a relationship between ARCH and clinical CMML. Using published data16,17 we compared the age-adjusted prevalence of ARCH mutations with their prevalence in our CMML cohort. DNMT3A mutation frequency in CMML patients (5.8%) was almost identical to that in non-leukemic individuals of a similar age (5.1%), arguing that DNMT3A mutations are permissive to CMML. In contrast, mutations in JAK2, SRSF2, TET2, ASXL1 and TP53 were much higher in CMML compared with other cohorts. For instance, the frequency of JAK2V617F was 7.25% in our CMML cohort compared with 0.47–1.04% in non-leukemic cohorts (Supplementary Tables S2 and S9), suggesting mutations in these genes can support clonal expansion and lead to clinical CMML, but require a conducive genetic context. In agreement with this, 71% of CMML patients had mutations in ⩾ 2 of 11 reported ARCH genes (DNMT3A, ASXL1, TET2, JAK2, SRSF2, TP53, CBL, U2AF1, IDH2, PPM1D and STAT3; Figure 2d), whereas only 4.9% of 11 845 individuals unselected for cancer (and <15% of those aged >65 years) reported by Genovese et al.18 had mutations in ⩾ 2 ARCH genes. This suggests that realization of the CMML phenotype requires successive acquisition of multiple mutations, many of which are ARCH mutations.
We next modeled CMML onset, assuming that the clinical CMML phenotype requires a sufficient number of somatic mutations. We performed computational simulations to determine expected disease incidence rates by age under various models,33 for total average stochastic mutations necessary for CMML onset, and compared these predictions with observed incidence by age in the United States and Canada (CINA data 2005–2011). We assumed a simple average de novo mutation rate over time, and that individuals with the necessary number of mutations progress to CMML. We found remarkable similarity between reported relative incidence rates and our multi-hit stochastic models predicting that 6–10 somatic alterations are necessary for CMML onset (Figures 3a and b and Supplementary Table S4). Although CMML is twofold more common in men than in women, the incidence over age groups increased at nearly the same rate across genders. Jaiswal et al.19 reported a significantly higher ARCH mutation rate in men compared with women from age 60 years onward. Similarly, we found on average 0.85 more mutations in men, although this difference did not reach statistical significance (P = 0.29), possibly reflecting insufficient power. Two recent studies reported that the incidence of multiple ARCH mutations increases with age.16,18 In contrast, total mutation count at CMML diagnosis was not age-associated in our cohort (Figure 3c), suggesting that although CMML incidence increases with age, the number of mutations required for onset does not.
Figure 3.
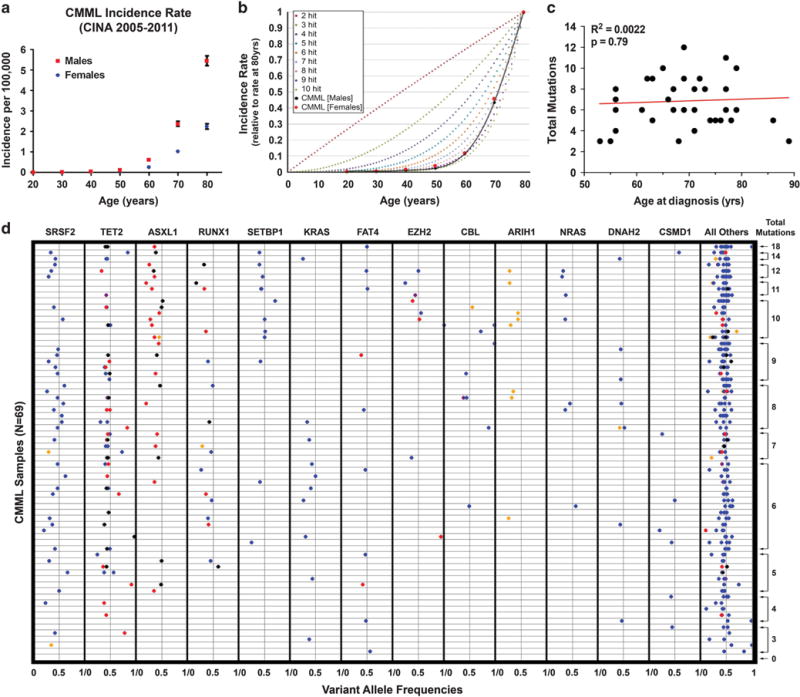
Multi-hit mutation modeling. (a) CMML incidence rate in the United States and Canada (2005–2011, CINA). (b) Multi-hit mutation modeling under a constant accrual model compared with observed CMML incidence rate. (c) Total CMML mutations versus age at diagnosis (N = 35 having biopsy and diagnosis within 1 year, similar results not shown if within 1 month). Single outlier (only patient recorded with SM-CMML diagnosed at age 36 years) with no mutations not shown. (d) Variant allele frequencies by gene and sample (N = 69). Black, nonsense mutation; red, frameshift indel; blue, nonsynonymous mutation; purple, splice-site mutation; orange, nonframeshift indel.
We next assessed total mutation count according to the presence or absence of mutations in a given gene. Patients with a mutation in ASXL1, EZH2 or SETBP1 had on average three additional mutations compared with patients without a mutation in the respective gene (Supplementary Table S14). This may be explained if mutations in any of these genes increased genomic instability, promoting acquisition of additional mutations. Alternatively, there could be a requirement for a cooperating mutation to achieve a functional result. Consistent with this, ASXL1 mutations were associated with SETBP1 or EZH2 mutations (P<0.05; Figure 4a). As both ASXL1 and EZH2 are members of the polycomb repressive complex 2, mutations in both may cooperate to inactivate polycomb repressive complex 2.34,35 Similarly, ASXL1 and SETBP1 mutations cooperate to suppress myeloid differentiation.36 On the basis of this cooperativity assumption we reasoned that mutations in ASXL1, SETBP1 and EZH2 should on average occur relatively late during CMML pathogenesis. To model this we ranked the mutations in each patient based on mutant allele proportion as a surrogate for chronological order of acquisition similar to estimation methods used by others.37–39 Consistent with cooperativity, mutations in EZH2, ASXL1 and SETBP1 tended to be acquired later than the majority of other mutations in a given patient based on VAF modeling (Figure 4b and Supplementary Table S15). As copy number aberrations and VAF imprecisions could alter the sequential ordering, more work through single-cell analysis and/or serial samples will be needed to definitively state the sequence of mutation acquisition in CMML.
Figure 4.
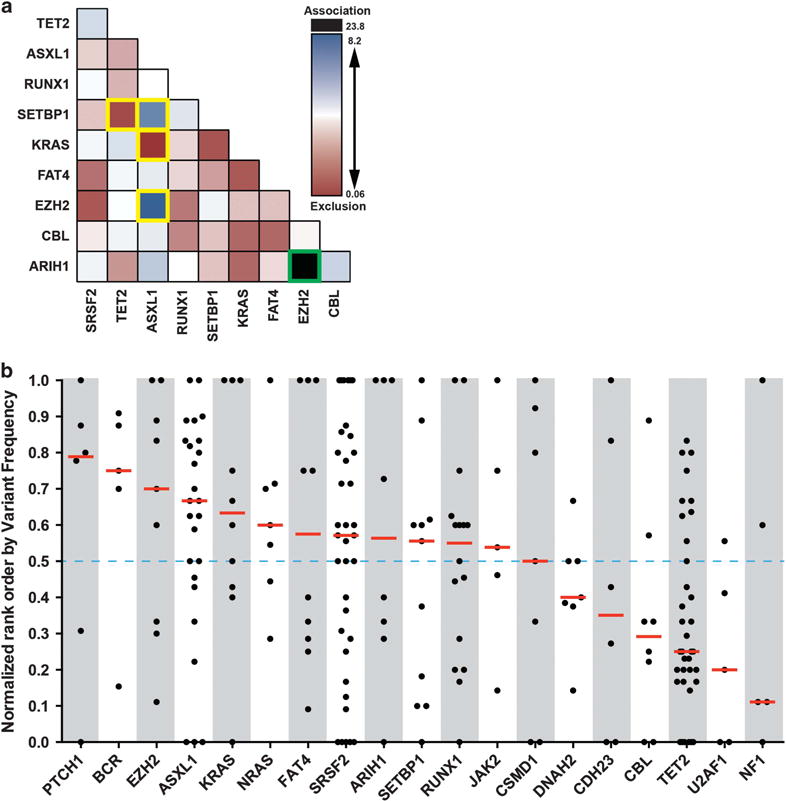
Gene mutation concomittance and estimated order of appearance. (a) Concomittance of gene mutations in CMML patients (N = 69). Color shading represents estimated logit odds ratio (black and blue indicate mutations are mutually inclusive, red if mutually exclusive). Unadjusted associations with P<0.05 by Fisher’s exact test are boxed in yellow, Bonferroni adjusted association with P<0.05 boxed in green. (b) Normalized rank order of gene mutations (using first gene mutation when multiple, higher rank order values indicate later occurring mutations) in relation to total genes mutated per patient estimated from tumor variant frequencies (N = 69).
DISCUSSION
The hematopoietic system in older individuals is characterized by reduced overall marrow cellularity, but a relative increase in hematopoietic stem cells (HSC), which are more likely to be cycling and biased toward myelomonocytic at the expense of lymphoid differentiation.20 Gene expression profiling of HSCs from normal controls revealed an age-related increase in expression of genes associated with granulocyte–macrophage colony-stimulating factor signaling and myeloid leukemia.20 Murine studies suggest that the myelomonocytic bias of aged hematopoiesis may reflect selection of clones with innate myeloid lineage bias rather than population-wide skewing.40–42 Aging-associated changes in extrinsic factors such as increased inflammatory cytokines and altered bone marrow stroma function may expose HSCs to selective pressures favoring clonal selection.43,44 In this frame of thinking, ARCH mutations are adaptive events that endow a subset of aged HSCs with a growth advantage over their age-compromised competitors, whereas ARCH-mutant clones would not be competitive against young HSCs. Our data suggest that random stochastic events occurring with aging are crucial to CMML pathogenesis and explain its age bias. Although cooperative effects are possible, as demonstrated by ASXL1 and EZH2 or SETBP1 mutations, they are not the main process.
Notably, neither the number (Figure 3c) nor the types of CMML mutations (Supplementary Table S16) are age dependent, suggesting that age has an impact on CMML incidence, but not on biology. Assessment of ARCH genes to date has been restricted to COSMIC mutations, with limited read depth, except for a few genes, suggesting that additional ARCH genes may be discovered that may overlap with other genes mutated in our CMML cohort. As multi-hit mutation modeling matches remarkably well with observed total mutation counts and age-specific incidence, we propose that CMML arises through successive acquisition of mostly age-related somatic mutations that ultimately convert a myelomonocytic bias into overt leukemia.
Supplementary Material
Acknowledgments
We thank Jonathan Schumacher (ARUP Laboratories) for assisting with the pyrosequencing confirmation, Anthony J Iovino for help with experiments, Jenny Ottley for administrative assistance and James Marvin (University of Utah) for help with fluorescence-activated cell sorting. We are grateful to Dr Nicholas Cross (Southampton, UK) and Dr Tim Ley (Washington University, Saint Louis) for helpful discussions. We also thank Agilent Technologies, Inc. for providing Sure Select XT2 targeted primers. This study was supported by grants from V Foundation for Cancer Research (JWT), The Leukemia & Lymphoma Society (MWD, JWT, BJD), Gabrielle’s Angel Foundation for Cancer Research (JWT), Charles and Ann Johnson Foundation (JG), the National Institutes of Health (5R00CA151457-04, 1R01CA183974-01, CA04963920, 1R01CA178397-01, P01CA049639 and P30 CA042014), the PPHC Human DNA Sequencing Grant, and the Utah Genome Project (MWD). The support and resources from the Center for High Performance Computing at the University of Utah are also gratefully acknowledged. JSK and AME are Fellows of the Leukemia & Lymphoma Society and SKT is a recipient of a fellowship award of the American Society of Hematology.
Footnotes
CONFLICT OF INTEREST
CCM and MWD report a potential related conflict of interest of research funding from Agilent Technologies, Inc. MWD also reports a potential related conflict of interest of research funding from Celgene, Inc. All other authors declare no conflict of interests.
AUTHOR CONTRIBUTIONS
CCM and JSK conceived and designed the study, collected and assembled the data, analyzed and interpreted the data, and wrote the manuscript. SKT, MSZ, DY, ADP, KRR, AME, BKD collected and assembled the data. TWK, JWT, K-HD, BJD, JG provided study material. ZK, MY analyzed and interpreted the data. RLS collected and assembled the data, and analyzed and interpreted the data. TO collected and assembled the data, and wrote the manuscript. MWD conceived and designed the study, provided study material, analyzed and interpreted the data, and wrote the manuscript.
Supplementary Information accompanies this paper on the Leukemia website (http://www.nature.com/leu)
References
- 1.Patnaik MM, Padron E, LaBorde RR, Lasho TL, Finke CM, Hanson CA, et al. Mayo prognostic model for WHO-defined chronic myelomonocytic leukemia: ASXL1 and spliceosome component mutations and outcomes. Leukemia. 2013;27:1504–1510. doi: 10.1038/leu.2013.88. [DOI] [PubMed] [Google Scholar]
- 2.Williamson PJ, Kruger AR, Reynolds PJ, Hamblin TJ, Oscier DG. Establishing the incidence of myelodysplastic syndrome. Br J Haematol. 1994;87:743–745. doi: 10.1111/j.1365-2141.1994.tb06733.x. [DOI] [PubMed] [Google Scholar]
- 3.Aul C, Gattermann N, Schneider W. Age-related incidence and other epidemiological aspects of myelodysplastic syndromes. Br J Haematol. 1992;82:358–367. doi: 10.1111/j.1365-2141.1992.tb06430.x. [DOI] [PubMed] [Google Scholar]
- 4.Tyner JW, Loriaux MM, Erickson H, Eide CA, Deininger J, MacPartlin M, et al. High-throughput mutational screen of the tyrosine kinome in chronic myelomonocytic leukemia. Leukemia. 2009;23:406–409. doi: 10.1038/leu.2008.187. [DOI] [PubMed] [Google Scholar]
- 5.Gelsi-Boyer V, Trouplin V, Roquain J, Adélaïde J, Carbuccia N, Esterni B, et al. ASXL1 mutation is associated with poor prognosis and acute transformation in chronic myelomonocytic leukaemia. Br J Haematol. 2010;151:365–375. doi: 10.1111/j.1365-2141.2010.08381.x. [DOI] [PubMed] [Google Scholar]
- 6.Smith AE, Mohamedali AM, Kulasekararaj A, Lim Z, Gäken J, Lea NC, et al. Next-generation sequencing of the TET2 gene in 355 MDS and CMML patients reveals low-abundance mutant clones with early origins, but indicates no definite prognostic value. Blood. 2010;116:3923–3932. doi: 10.1182/blood-2010-03-274704. [DOI] [PubMed] [Google Scholar]
- 7.Jankowska AM, Makishima H, Tiu RV, Szpurka H, Huang Y, Traina F, et al. Mutational spectrum analysis of chronic myelomonocytic leukemia includes genes associated with epigenetic regulation: UTX, EZH2, and DNMT3A. Blood. 2011;118:3932–3941. doi: 10.1182/blood-2010-10-311019. [DOI] [PMC free article] [PubMed] [Google Scholar]
- 8.Itzykson R, Kosmider O, Renneville A, Gelsi-Boyer V, Meggendorfer M, Morabito M, et al. Prognostic score including gene mutations in chronic myelomonocytic leukemia. J Clin Oncol. 2013;31:2428–2436. doi: 10.1200/JCO.2012.47.3314. [DOI] [PubMed] [Google Scholar]
- 9.Patnaik MM, Itzykson R, Lasho TL, Kosmider O, Finke CM, Hanson CA, et al. ASXL1 and SETBP1 mutations and their prognostic contribution in chronic myelomonocytic leukemia: a two-center study of 466 patients. Leukemia. 2014;28:2206–2212. doi: 10.1038/leu.2014.125. [DOI] [PubMed] [Google Scholar]
- 10.Meggendorfer M, Roller A, Haferlach T, Eder C, Dicker F, Grossmann V, et al. SRSF2 mutations in 275 cases with chronic myelomonocytic leukemia (CMML) Blood. 2012;120:3080–3088. doi: 10.1182/blood-2012-01-404863. [DOI] [PMC free article] [PubMed] [Google Scholar]
- 11.Laborde RR, Patnaik MM, Lasho TL, Finke CM, Hanson CA, Knudson RA, et al. SETBP1 mutations in 415 patients with primary myelofibrosis or chronic myelomonocytic leukemia: independent prognostic impact in CMML. Leukemia. 2013;27:2100–2102. doi: 10.1038/leu.2013.97. [DOI] [PMC free article] [PubMed] [Google Scholar]
- 12.Grossmann V, Kohlmann A, Eder C, Haferlach C, Kern W, Cross NC, et al. Molecular profiling of chronic myelomonocytic leukemia reveals diverse mutations in >80% of patients with TET2 and EZH2 being of high prognostic relevance. Leukemia. 2011;25:877–879. doi: 10.1038/leu.2011.10. [DOI] [PubMed] [Google Scholar]
- 13.Kuo MC, Liang DC, Huang CF, Shih YS, Wu JH, Lin TL, et al. RUNX1 mutations are frequent in chronic myelomonocytic leukemia and mutations at the C-terminal region might predict acute myeloid leukemia transformation. Leukemia. 2009;23:1426–1431. doi: 10.1038/leu.2009.48. [DOI] [PubMed] [Google Scholar]
- 14.Kosmider O, Gelsi-Boyer V, Ciudad M, Racoeur C, Jooste V, Vey N, et al. TET2 gene mutation is a frequent and adverse event in chronic myelomonocytic leukemia. Haematologica. 2009;94:1676–1681. doi: 10.3324/haematol.2009.011205. [DOI] [PMC free article] [PubMed] [Google Scholar]
- 15.Kohlmann A, Grossmann V, Klein HU, Schindela S, Weiss T, Kazak B, et al. Next-generation sequencing technology reveals a characteristic pattern of molecular mutations in 72.8% of chronic myelomonocytic leukemia by detecting frequent alterations in TET2, CBL, RAS, and RUNX1. J Clin Oncol. 2010;28:3858–3865. doi: 10.1200/JCO.2009.27.1361. [DOI] [PubMed] [Google Scholar]
- 16.Xie M, Lu C, Wang J, McLellan MD, Johnson KJ, Wendl MC, et al. Age-related mutations associated with clonal hematopoietic expansion and malignancies. Nat Med. 2014;20:1472–1478. doi: 10.1038/nm.3733. [DOI] [PMC free article] [PubMed] [Google Scholar]
- 17.McKerrell T, Park N, Moreno T, Grove CS, Ponstingl H, Stephens J, et al. Leukemia-associated somatic mutations drive distinct patterns of age-related clonal hemopoiesis. Cell Rep. 2015;10:1239–1245. doi: 10.1016/j.celrep.2015.02.005. [DOI] [PMC free article] [PubMed] [Google Scholar]
- 18.Genovese G, Kahler AK, Handsaker RE, Lindberg J, Rose SA, Bakhoum SF, et al. Clonal hematopoiesis and blood-cancer risk inferred from blood DNA sequence. N Engl J Med. 2014;371:2477–2487. doi: 10.1056/NEJMoa1409405. [DOI] [PMC free article] [PubMed] [Google Scholar]
- 19.Jaiswal S, Fontanillas P, Flannick J, Manning A, Grauman PV, Mar BG, et al. Age-related clonal hematopoiesis associated with adverse outcomes. N Engl J Med. 2014;371:2488–2498. doi: 10.1056/NEJMoa1408617. [DOI] [PMC free article] [PubMed] [Google Scholar]
- 20.Pang WW, Price EA, Sahoo D, Beerman I, Maloney WJ, Rossi DJ, et al. Human bone marrow hematopoietic stem cells are increased in frequency and myeloid-biased with age. Proc Natl Acad Sci USA. 2011;108:20012–20017. doi: 10.1073/pnas.1116110108. [DOI] [PMC free article] [PubMed] [Google Scholar]
- 21.Gondek LP, Tiu R, O’Keefe CL, Sekeres MA, Theil KS, Maciejewski JP. Chromosomal lesions and uniparental disomy detected by SNP arrays in MDS, MDS/MPD, and MDS-derived AML. Blood. 2008;111:1534–1542. doi: 10.1182/blood-2007-05-092304. [DOI] [PMC free article] [PubMed] [Google Scholar]
- 22.Shlush LI, Zandi S, Mitchell A, Chen WC, Brandwein JM, Gupta V, et al. Identification of pre-leukaemic haematopoietic stem cells in acute leukaemia. Nature. 2014;506:328–333. doi: 10.1038/nature13038. [DOI] [PMC free article] [PubMed] [Google Scholar]
- 23.McKenna A, Hanna M, Banks E, Sivachenko A, Cibulskis K, Kernytsky A, et al. The Genome Analysis Toolkit: a MapReduce framework for analyzing next-generation DNA sequencing data. Genome Res. 2010;20:1297–1303. doi: 10.1101/gr.107524.110. [DOI] [PMC free article] [PubMed] [Google Scholar]
- 24.Koboldt DC, Zhang Q, Larson DE, Shen D, McLellan MD, Lin L, et al. VarScan 2: somatic mutation and copy number alteration discovery in cancer by exome sequencing. Genome Res. 2012;22:568–576. doi: 10.1101/gr.129684.111. [DOI] [PMC free article] [PubMed] [Google Scholar]
- 25.Li H, Handsaker B, Wysoker A, Fennell T, Ruan J, Homer N, et al. The Sequence Alignment/Map format and SAMtools. Bioinformatics. 2009;25:2078–2079. doi: 10.1093/bioinformatics/btp352. [DOI] [PMC free article] [PubMed] [Google Scholar]
- 26.Wang K, Li M, Hakonarson H. ANNOVAR: functional annotation of genetic variants from high-throughput sequencing data. Nucleic Acids Res. 2010;38:e164. doi: 10.1093/nar/gkq603. [DOI] [PMC free article] [PubMed] [Google Scholar]
- 27.Yandell M, Huff C, Hu H, Singleton M, Moore B, Xing J, et al. A probabilistic disease-gene finder for personal genomes. Genome Res. 2011;21:1529–1542. doi: 10.1101/gr.123158.111. [DOI] [PMC free article] [PubMed] [Google Scholar]
- 28.Kohane IS, Hsing M, Kong SW. Taxonomizing, sizing, and overcoming the incidentalome. Genet Med. 2012;14:399–404. doi: 10.1038/gim.2011.68. [DOI] [PMC free article] [PubMed] [Google Scholar]
- 29.Bamford S, Dawson E, Forbes S, Clements J, Pettett R, Dogan A, et al. The COSMIC (Catalogue of Somatic Mutations in Cancer) database and website. Br J Cancer. 2004;91:355–358. doi: 10.1038/sj.bjc.6601894. [DOI] [PMC free article] [PubMed] [Google Scholar]
- 30.Tiwari RC, Clegg LX, Zou Z. Efficient interval estimation for age-adjusted cancer rates. Stat Methods Med Res. 2006;15:547–569. doi: 10.1177/0962280206070621. [DOI] [PubMed] [Google Scholar]
- 31.Onida F, Kantarjian HM, Smith TL, Ball G, Keating MJ, Estey EH, et al. Prognostic factors and scoring systems in chronic myelomonocytic leukemia: a retrospective analysis of 213 patients. Blood. 2002;99:840–849. doi: 10.1182/blood.v99.3.840. [DOI] [PubMed] [Google Scholar]
- 32.Germing U, Kundgen A, Gattermann N. Risk assessment in chronic myelomonocytic leukemia (CMML) Leuk Lymphoma. 2004;45:1311–1318. doi: 10.1080/1042819042000207271. [DOI] [PubMed] [Google Scholar]
- 33.Allen LJS. An Introduction to Stochastic Processes with Applications to Biology. Pearson Education Inc; Upper Saddle River, NJ: 2003. [Google Scholar]
- 34.Abdel-Wahab O, Adli M, LaFave LM, Gao J, Hricik T, Shih AH, et al. ASXL1 mutations promote myeloid transformation through loss of PRC2-mediated gene repression. Cancer Cell. 2012;22:180–193. doi: 10.1016/j.ccr.2012.06.032. [DOI] [PMC free article] [PubMed] [Google Scholar]
- 35.Ernst T, Chase AJ, Score J, Hidalgo-Curtis CE, Bryant C, Jones AV, et al. Inactivating mutations of the histone methyltransferase gene EZH2 in myeloid disorders. Nat Genet. 2010;42:722–726. doi: 10.1038/ng.621. [DOI] [PubMed] [Google Scholar]
- 36.Inoue D, Kitaura J, Matsui H, Hou HA, Chou WC, Nagamachi A, et al. SETBP1 mutations drive leukemic transformation in ASXL1-mutated MDS. Leukemia. 2015;29:847–857. doi: 10.1038/leu.2014.301. [DOI] [PMC free article] [PubMed] [Google Scholar]
- 37.Walter MJ, Shen D, Ding L, Shao J, Koboldt DC, Chen K, et al. Clonal architecture of Secondary Acute Myeloid Leukemia. N Engl J Med. 2012;366:1090–1098. doi: 10.1056/NEJMoa1106968. [DOI] [PMC free article] [PubMed] [Google Scholar]
- 38.Durinck S, Ho C, Wanj NJ, Liao W, Jakkula LR, Collisson EA, et al. Temporal dissection of tumorigenesis in primary cancers. Cancer Discov. 2011;1:137–143. doi: 10.1158/2159-8290.CD-11-0028. [DOI] [PMC free article] [PubMed] [Google Scholar]
- 39.Youn A, Simon R. Estimating the order of mutations during tumorigenesis from tumor genome sequencing data. Bioinformatics. 2012;28:1555–1561. doi: 10.1093/bioinformatics/bts168. [DOI] [PMC free article] [PubMed] [Google Scholar]
- 40.Challen GA, Boles NC, Chambers SM, Goodell MA. Distinct hematopoietic stem cell subtypes are differentially regulated by TGF-beta1. Cell Stem Cell. 2010;6:265–278. doi: 10.1016/j.stem.2010.02.002. [DOI] [PMC free article] [PubMed] [Google Scholar]
- 41.Cho RH, Sieburg HB, Muller-Sieburg CE. A new mechanism for the aging of hematopoietic stem cells: aging changes the clonal composition of the stem cell compartment but not individual stem cells. Blood. 2008;111:5553–5561. doi: 10.1182/blood-2007-11-123547. [DOI] [PMC free article] [PubMed] [Google Scholar]
- 42.Beerman I, Bhattacharya D, Zandi S, Sigvardsson M, Weissman IL, Bryder D, et al. Functionally distinct hematopoietic stem cells modulate hematopoietic lineage potential during aging by a mechanism of clonal expansion. Proc Natl Acad Sci USA. 2010;107:5465–5470. doi: 10.1073/pnas.1000834107. [DOI] [PMC free article] [PubMed] [Google Scholar]
- 43.Chambers SM, Shaw CA, Gatza C, Fisk CJ, Donehower LA, Goodell MA. Aging hematopoietic stem cells decline in function and exhibit epigenetic dysregulation. PLoS Biol. 2007;5:e201. doi: 10.1371/journal.pbio.0050201. [DOI] [PMC free article] [PubMed] [Google Scholar]
- 44.King KY, Goodell MA. Inflammatory modulation of HSCs: viewing the HSC as a foundation for the immune response. Nat Rev Immunol. 2011;11:685–692. doi: 10.1038/nri3062. [DOI] [PMC free article] [PubMed] [Google Scholar]
Associated Data
This section collects any data citations, data availability statements, or supplementary materials included in this article.