Abstract
Nonalcoholic fatty liver disease (NAFLD) is a risk factor for type 2 diabetes (T2D), but whether NAFLD plays a causal role in the pathogenesis of T2D is uncertain. One proposed mechanism linking NAFLD to hepatic insulin resistance involves diacylglycerol-mediated (DAG-mediated) activation of protein kinase C-ε (PKCε) and the consequent inhibition of insulin receptor (INSR) kinase activity. However, the molecular mechanism underlying PKCε inhibition of INSR kinase activity is unknown. Here, we used mass spectrometry to identify the phosphorylation site Thr1160 as a PKCε substrate in the functionally critical INSR kinase activation loop. We hypothesized that Thr1160 phosphorylation impairs INSR kinase activity by destabilizing the active configuration of the INSR kinase, and our results confirmed this prediction by demonstrating severely impaired INSR kinase activity in phosphomimetic T1160E mutants. Conversely, the INSR T1160A mutant was not inhibited by PKCε in vitro. Furthermore, mice with a threonine-to-alanine mutation at the homologous residue Thr1150 (InsrT1150A mice) were protected from high fat diet–induced hepatic insulin resistance. InsrT1150A mice also displayed increased insulin signaling, suppression of hepatic glucose production, and increased hepatic glycogen synthesis compared with WT controls during hyperinsulinemic clamp studies. These data reveal a critical pathophysiological role for INSR Thr1160 phosphorylation and provide further mechanistic links between PKCε and INSR in mediating NAFLD-induced hepatic insulin resistance.
Introduction
Nonalcoholic fatty liver disease (NAFLD) is the most common liver disease in industrialized nations (1). NAFLD is observed in nearly 100% of obese people with type 2 diabetes (T2D) (2) and is an exceptionally strong predictor of hepatic insulin resistance (3, 4). Hepatic insulin resistance, characterized by unrestrained glucose production, is a major driver of the fasting hyperglycemia that defines T2D (5). Consequently, understanding the mechanistic basis for the association between NAFLD and hepatic insulin resistance is essential.
Whether NAFLD causes hepatic insulin resistance is controversial (5, 6). Several rodent models with preserved hepatic insulin sensitivity despite hepatic steatosis raise the possibility that NAFLD does not cause hepatic insulin resistance (6–10). Hepatic insulin resistance has even been proposed to drive hepatic steatosis, though a plausible mechanism for this direction of causality is lacking (6, 11).
Alternatively, one putative mechanism by which NAFLD may cause hepatic insulin resistance proposes that diacylglycerol (DAG) accumulation promotes translocation and activation of protein kinase C-ε (PKCε), which in turn inhibits insulin receptor (INSR) kinase (IRK) activity (12, 13). As the penultimate intermediate in triglyceride synthesis, DAG levels track closely with triglyceride levels in human liver and strongly predict insulin resistance (14). DAG activates PKC isoforms, and the isoform most strongly associated with lipid-induced hepatic insulin resistance is PKCε (14, 15). Knockdown of hepatic PKCε with a specific antisense oligonucleotide (PKCε ASO) prevents lipid-induced hepatic insulin resistance in rats (12), and Prkce–/– mice are protected from high-fat diet–induced (HFD-induced) glucose intolerance (16). Protection from lipid-induced hepatic insulin resistance in PKCε ASO-treated rats was associated with preserved IRK activity, and PKCε was found to inhibit IRK activity in vitro (12). However, the molecular mechanism for PKCε inhibition of IRK activity has not been identified. Here, we identify INSR Thr1160 as a PKCε target and demonstrate that INSR Thr1160 phosphorylation is necessary for lipid-induced hepatic insulin resistance in vivo. Our data thus reveal a direct mechanism by which hepatic lipid accumulation causes hepatic insulin resistance.
Results
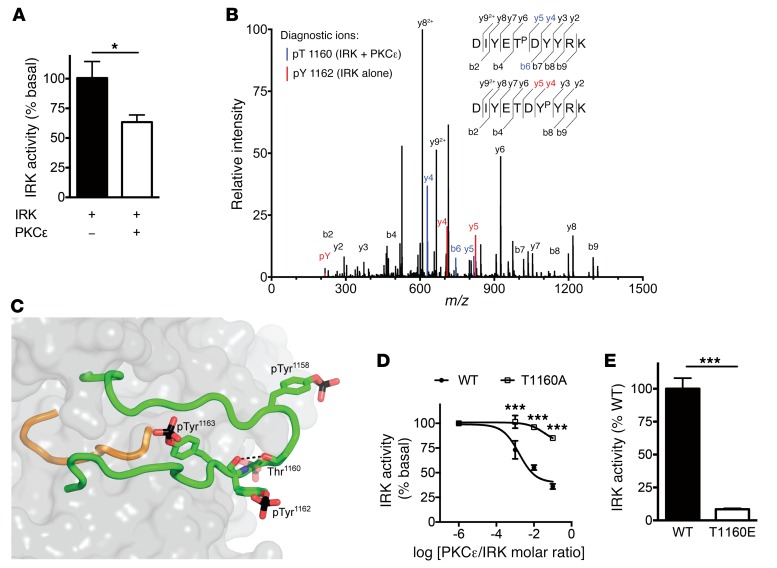
To determine the molecular mechanism by which PKCε inhibits IRK activity, we began by performing in vitro kinase assays with recombinant proteins, which revealed decreased IRK activity in the presence of active PKCε (Figure 1A). Other PKC isoforms, including α, β1, β2, δ, θ, and ζ, were unable to inhibit IRK activity in this assay (Supplemental Figure 1; supplemental material available online with this article; doi:10.1172/JCI86013DS1). To identify the site of phosphorylation, we incubated recombinant IRK with and without recombinant PKCε and performed liquid chromatography-tandem mass spectrometry (LC-MS/MS) analysis of digested phosphopeptides. This revealed an intriguing phosphopeptide in the IRK activation loop, DIYETPDYYRK, which was present only in IRK samples incubated with PKCε (Figure 1B). IRK samples incubated without PKCε yielded only the phosphopeptide DIYETDYPYRK, reflecting normal autophosphorylation (Figure 1B). The activation loop peptide contains 4 potential phosphorylation sites: 1 threonine residue (Thr1160) and 3 tyrosine residues (Tyr1158, Tyr1162, and Tyr1163), the latter of which are autophosphorylated (in trans) during INSR activation (17). Despite the complexity of the phosphopeptide with respect to potential phosphorylation sites, analysis of the fragmentation pattern revealed that IRK Thr1160 phosphorylation was present after PKCε incubation.
Figure 1. PKCε phosphorylates the INSR at Thr1160.
(A) IRK activity with and without equimolar PKCε preincubation in vitro. (B) Overlaid MS/MS spectra of the T1160-phosphorylated peptide DIYETPDYYRK (identified only in IRK + PKCε samples; unique peaks are shown in blue) and the Y1162-phosphorylated peptide DIYETDYPYRK (identified in samples with IRK alone; unique peaks are shown in red). An Andromeda score of 167.67, a localization probability of 68%, and a 4.3 Delta score between pT1160 assignment and pY1162 assignment supported assignment of phosphorylation to T1160. pT, phosphothreonine. pY, phosphotyrosine. Y and B series MS/MS fragment ions are defined with respect to primary amino acid sequence at upper right. (C) Mechanism by which Thr1160 phosphorylation inhibits IRK activity. The crystal structure of phosphorylated, activated IRK (19) is shown, with the activation loop in green, the catalytic loop in orange, and the rest of IRK in gray (surface representation). The 3 phosphotyrosines in the activation loop are shown as sticks, as is Thr1160 (carbon atoms in green, oxygen atoms in red, nitrogen atoms in blue, and phosphorus atoms in black). The side chain of (unphosphorylated) Thr1160 is hydrogen bonded (black dashed line) to the backbone carbonyl oxygen of phosphorylated Tyr1162 (pTyr1162). If Thr1160 were phosphorylated (hypothetical phosphate group shown semitransparently), the activation loop could not adopt this configuration because of steric clashes and electrostatic repulsion with pTyr1162. (D) In vitro kinase activity of recombinant WT or T1160A IRK at several PKCε concentrations. (E) In vitro kinase activity of recombinant WT or T1160E IRK. Data represent the mean ± SEM. (A) *P < 0.05, by unpaired, 2-tailed Student’s t test for 5 technical replicates per group; (D and E) ***P < 0.0005, by unpaired, 2-tailed Student’s t test for 3 to 4 technical replicates per group.
Thr1160 (numbering of the mature human INSR B isoform; the homologous residue in mouse is Thr1150) is located in the functionally critical IRK activation loop with 100% conservation in distantly related species such as Drosophila, which suggests that phosphorylation at this residue could modulate IRK activity in vivo. In the unphosphorylated, low-activity form of IRK, the activation loop exists in an autoinhibitory configuration that occludes the catalytic pocket (18). Upon trans-autophosphorylation of Tyr1158, Tyr1162, and Tyr1163, the activation loop adopts a configuration that facilitates kinase activity (19). Phosphorylation of INSR Thr1160 is predicted to destabilize this active configuration through steric hindrance and electrostatic repulsion (Figure 1C).
To directly investigate the role of INSR Thr1160 in IRK activity, we generated recombinant WT and mutant IRK and performed in vitro kinase assays with and without recombinant PKCε. PKCε dose-dependently inhibited WT IRK but not IRK T1160A, suggesting that Thr1160 is necessary for PKCε inhibition of IRK (Figure 1D). Conversely, the phosphomimetic IRK T1160E mutant displayed significantly impaired tyrosine kinase activity, suggesting that Thr1160 phosphorylation is sufficient to inhibit IRK activity (Figure 1E).
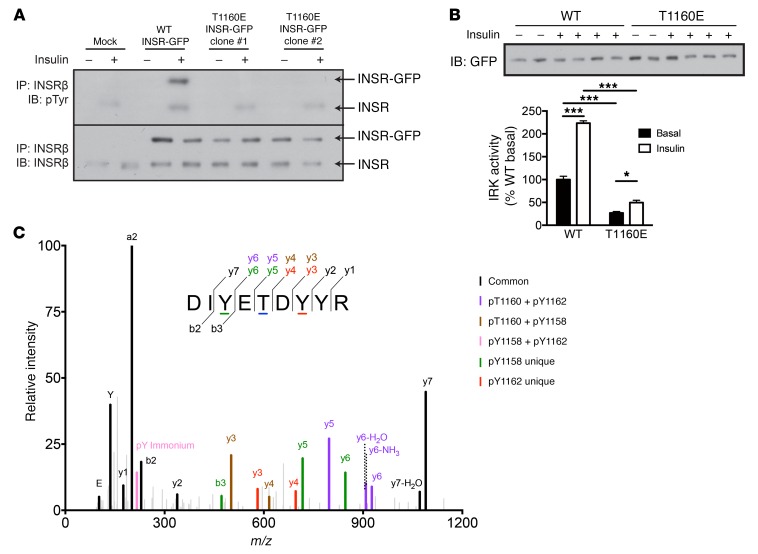
We next investigated the functional consequences of Thr1160 phosphorylation in cells. Consistent with its poor kinase activity in vitro, INSR T1160E displayed markedly defective INSR autophosphorylation compared with WT INSR in transfected HeLa cells (Figure 2A). Immunoprecipitable INSR T1160E tyrosine kinase activity was also markedly diminished compared with that of WT IRK (Figure 2B). We also observed INSR Thr1160 phosphorylation by LC-MS/MS in McArdle rat hepatoma cells transiently transfected with GFP-tagged human INSR, indicating that Thr1160 phosphorylation is not merely an in vitro phenomenon (Figure 2C and Supplemental Figure 2).
Figure 2. INSR T1160 phosphorylation impairs insulin signaling.
(A) Autophosphorylation of WT or T1160E INSR in transfected HeLa cells treated for 15 minutes with 100 nM insulin. (B) In vitro kinase activity of GFP-tagged WT or T1160E INSR immunoprecipitated from transfected HeLa cells treated for 10 minutes with 100 nM insulin. (C) MS/MS fragmentation spectrum identifying Thr1160 phosphorylation in cells. McArdle rat hepatoma cells were transfected with WT GFP-tagged INSR. GFP immunoprecipitates were run on SDS-PAGE gels, and INSR-GFP gel bands were excised, digested with trypsin, enriched for phosphopeptides with TiO2, and analyzed by LC-MS/MS. Peptides were identified using MaxQuant software, and phosphosite assignments are shown by color coding. Localization probabilities for the 3 identified peptides are: DIY(1)ETDYYR; DIYET(.785)DYYR; and DIYETDY(.364)Y(.574)R. The Andromeda scores were as follows: pTyr1158 = 91.867; Thr1160 = 52.571; and pTyr1162 = 105.52. These scores support the coexistence of multiple singly phosphorylated species (i.e., pTyr1158, pThr1160, pTyr1162, and pTyr1163) in the biological sample. Data represent the mean ± SEM. (B) *P < 0.05 and ***P < 0.0005, by 2-way ANOVA. n = 2 (basal) and n = 4 (insulin) biological replicates per group. IB, immunoblot.
To definitively examine the physiological relevance of INSR Thr1160 phosphorylation, we generated C57BL/6J mice harboring a threonine-to-alanine mutation at the homologous residue Thr1150 (InsrT1150A mice) (Supplemental Figure 3). Metabolic cage analyses of male mice fed regular chow diet revealed no significant effect on whole-body oxygen consumption, carbon dioxide production, respiratory quotient, energy expenditure, caloric intake, or locomotor activity in InsrT1150A mice compared with WT littermate controls (Supplemental Figure 4). We also performed hyperinsulinemic-euglycemic clamp studies in regular chow–fed male InsrT1150A mice. Basal and clamp plasma insulin levels were subtly increased in InsrT1150A mice (Supplemental Table 1). Despite this, InsrT1150A mice displayed similar glucose infusion rates, suppression of endogenous glucose production, insulin-stimulated whole-body glucose uptake, and suppression of plasma nonesterified fatty acids (NEFAs) compared with littermate WT controls (Supplemental Figure 5 and Supplemental Table 1). These data indicate that the InsrT1150A mutation does not affect whole-body or hepatic insulin sensitivity in regular chow–fed mice.
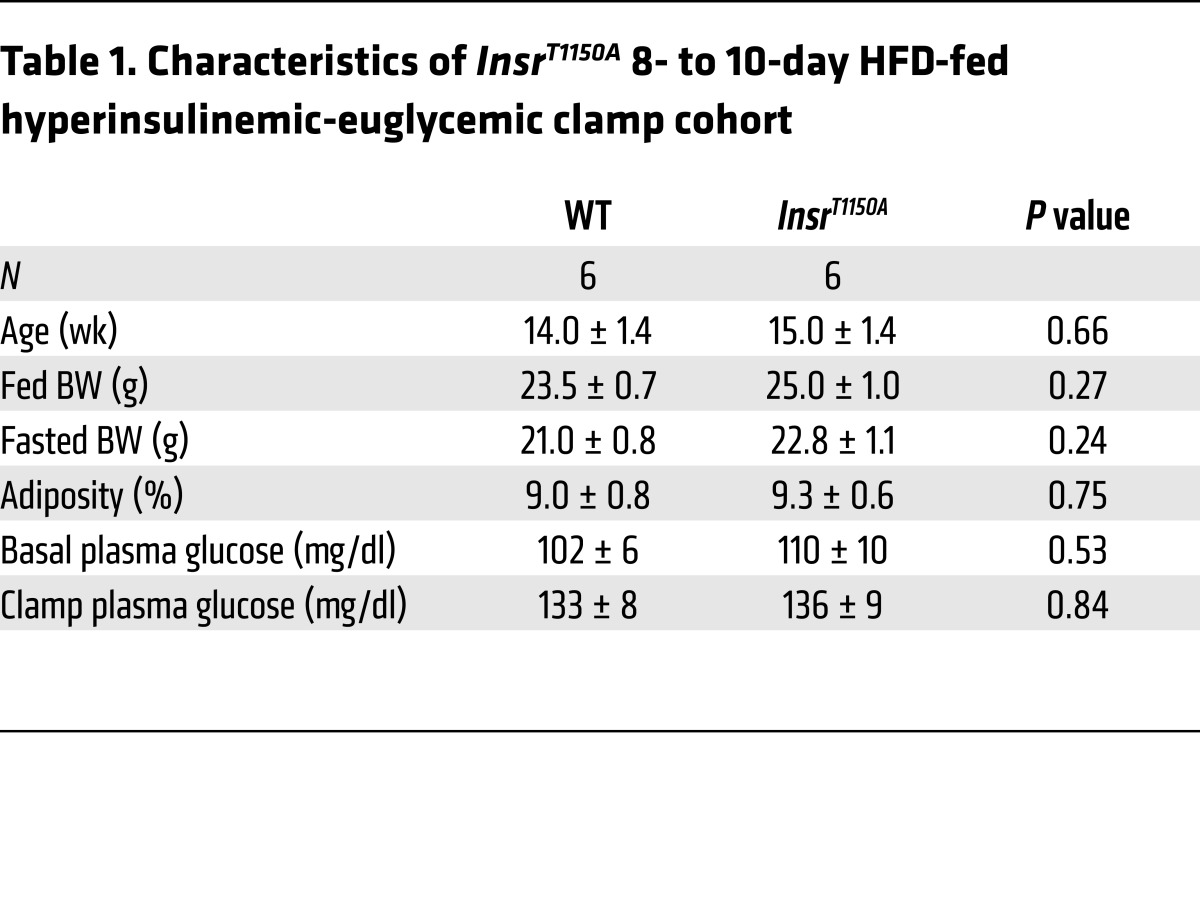
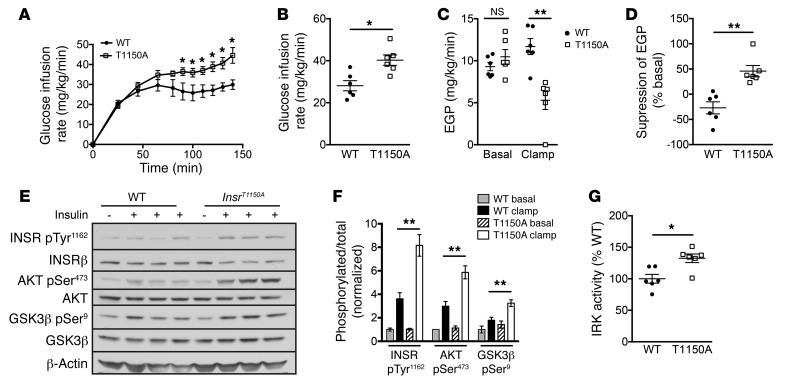
However, because our in vitro studies indicated that recombinant IRK T1160A was protected from inhibition by PKCε, and because PKCε activation has been implicated in lipid-induced hepatic insulin resistance (12, 15), we hypothesized that InsrT1150A mice would display protection from lipid-induced hepatic insulin resistance in vivo. To test this hypothesis, we fed InsrT1150A mice and their WT littermate controls an HFD for 8 to 10 days, a validated rodent model of liver-specific insulin resistance (12, 15, 20). This short-term HFD increased hepatic triglyceride levels, hepatic total DAG levels, hepatic membrane–associated DAG levels, and PKCε activation similarly in both WT and InsrT1150A mice, demonstrating a normal propensity for hepatosteatosis and DAG/PKCε axis activation in InsrT1150A mice (Supplemental Figure 6). InsrT1150A mice did not significantly differ from WT controls in age, BW, adiposity, plasma lipids, or fasting plasma glucose or insulin concentrations (Table 1 and Supplemental Table 2). However, InsrT1150A mice required significantly greater glucose infusion rates during hyperinsulinemic-euglycemic clamp studies (Figure 3, A and B), despite similar plasma insulin and C-peptide levels (Supplemental Figure 7), indicating increased whole-body insulin sensitivity. This increase in whole-body insulin responsiveness was primarily attributable to markedly improved suppression of endogenous glucose production (EGP), reflecting protection from HFD-induced hepatic insulin resistance (Figure 3, C and D). Immunoblot analysis of post-clamp livers revealed enhanced insulin-stimulated phosphorylation of INSR, AKT, and GSK3β in InsrT1150A mice (Figure 3, E and F). Liver IRK activity was also increased in InsrT1150A mice (Figure 3G). These data demonstrate protection from HFD-induced hepatocellular insulin resistance in InsrT1150A mice, suggesting that Thr1150 phosphorylation contributes to lipid-induced hepatic insulin resistance in vivo.
Table 1. Characteristics of InsrT1150A 8- to 10-day HFD-fed hyperinsulinemic-euglycemic clamp cohort.
Figure 3. InsrT1150A mice are protected from HFD-induced hepatic insulin resistance.
Male InsrT1150A and WT littermate mice were fed an HFD for 8 to 10 days and fasted overnight before hyperinsulinemic-euglycemic clamp studies. (A) Glucose infusion rate. (B) Mean steady-state glucose infusion rate. (C) EGP during the basal and the steady-state periods of the clamp. (D) Insulin suppression of EGP during the clamp. (E and F) Phosphorylation of INSR, AKT, and GSK3β in overnight-fasted (– insulin, basal) or post-clamp (+ insulin, clamp) mice. (G) Immunoprecipitable liver IRK activity in post-clamp mice. *P < 0.05 and **P < 0.005, by unpaired, 2-tailed Student’s t test. Data represent the mean ± SEM. n = 6 mice per group.
Although insulin suppression of hepatic gluconeogenesis can be indirectly mediated through suppression of adipose lipolysis (21, 22), adipose insulin signaling and insulin suppression of plasma NEFA concentrations were unaltered in InsrT1150A mice (Supplemental Figure 8). This finding suggests that the improved EGP suppression in InsrT1150A mice was due to direct hepatocellular effects. Although whole-body glucose turnover was slightly increased in InsrT1150A mice in this study, neither immunoblotting of muscle insulin-signaling effectors nor measurements of 2-deoxyglucose uptake in skeletal muscle, brown adipose tissue, and heart revealed differences between WT and InsrT1150A mice (Supplemental Figure 9). Taken together, these data are consistent with liver-specific protection from lipid-induced insulin resistance in InsrT1150A mice fed a short-term HFD.
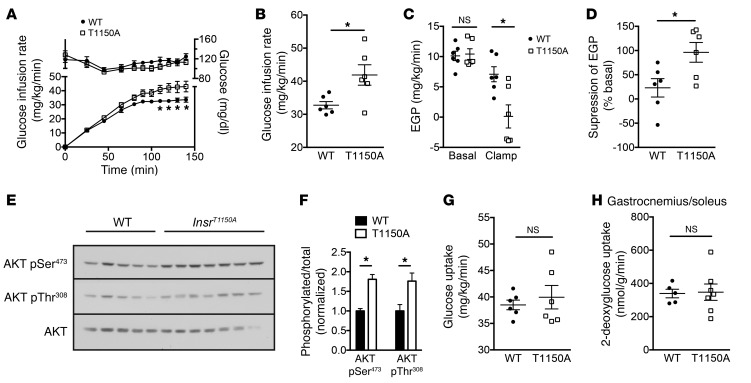
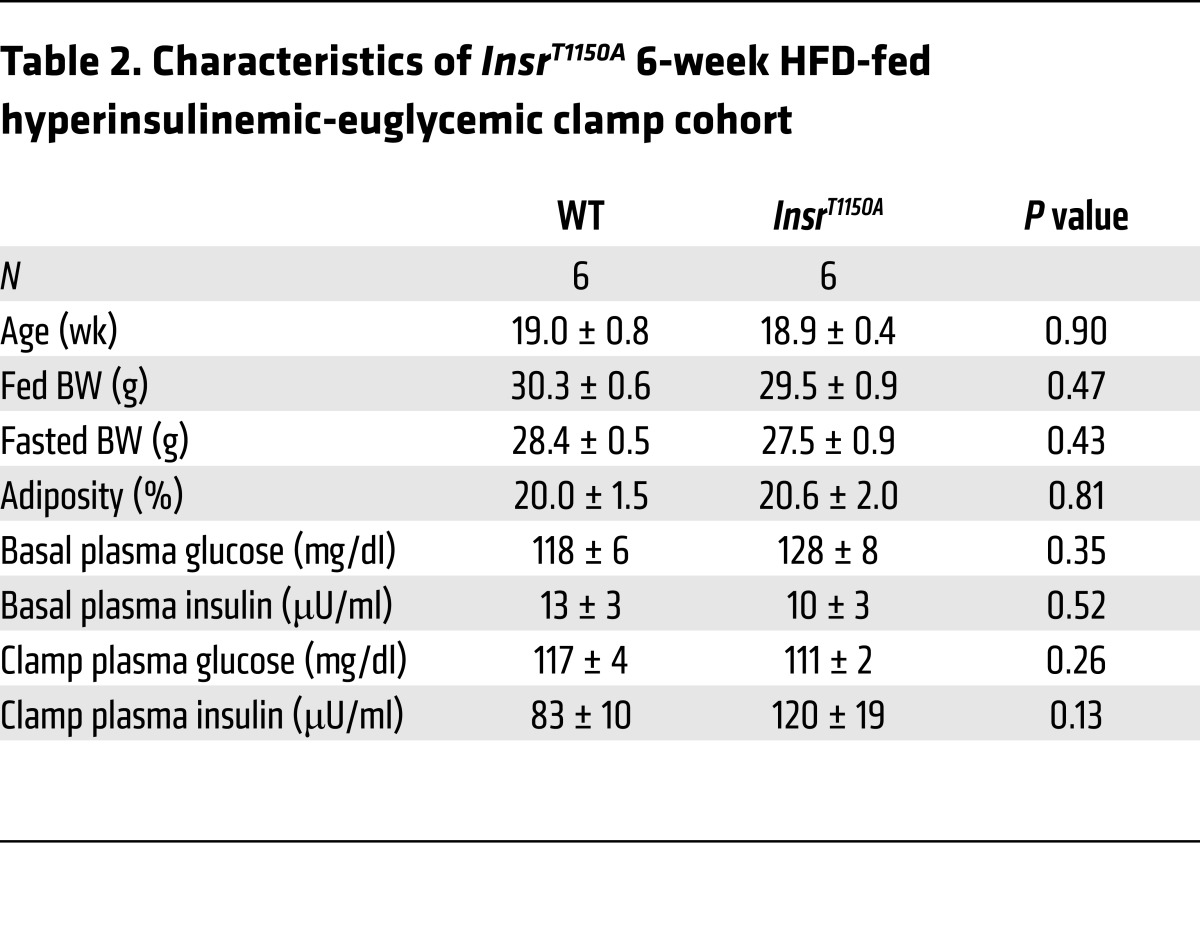
To ascertain whether InsrT1150A mice might also be protected from HFD-induced skeletal muscle insulin resistance (15, 20), we subjected InsrT1150A mice to a longer (6 weeks) HFD. In this setting, hyperinsulinemic-euglycemic clamp studies again revealed liver-specific protection from insulin resistance in InsrT1150A mice, with increased glucose infusion rates, increased EGP suppression, and increased liver AKT phosphorylation compared with WT controls (Figure 4, A–F). However, whole-body glucose uptake, gastrocnemius/soleus 2-deoxyglucose uptake, and gastrocnemius/soleus AKT phosphorylation were not different between the groups (Figure 4, G and H, and Supplemental Figure 10, A and C), indicating that InsrT1150A mice are not protected from HFD-induced skeletal muscle insulin resistance. Additionally, insulin suppression of plasma NEFA levels and white adipose tissue AKT phosphorylation were again unaltered in InsrT1150A mice, suggesting that the improvement in EGP suppression owed to protection from HFD-induced hepatocellular insulin resistance rather than to indirect lipolytic effects (Supplemental Figure 10, B–E). The 6-week HFD was not associated with alterations in BW, body composition, or whole-body energy balance in InsrT1150A mice relative to WT controls (Table 2 and Supplemental Figure 10F and Supplemental Figure 11).
Figure 4. InsrT1150A mice fed a chronic HFD are protected from hepatic, but not skeletal muscle, insulin resistance.
Male InsrT1150A and WT littermate mice were fed an HFD for 6 weeks and fasted overnight before hyperinsulinemic-euglycemic clamp studies. (A) Plasma glucose and glucose infusion rates during the clamp. (B) Mean steady-state glucose infusion rate. (C) EGP during the basal and steady-state periods of the clamp. (D) Suppression of EGP during the clamp, expressed as the percentage of basal EGP. (E and F) Hepatic AKT phosphorylation in post-clamp mice. (G) Whole-body glucose uptake during the steady-state period of the clamp. (H) 14C-2-deoxyglucose uptake during the clamp in gastrocnemius/soleus muscle. (A–H) Data represent the mean ± SEM . n = 5–7 mice per group. *P < 0.05, by unpaired, 2-tailed Student’s t test.
Table 2. Characteristics of InsrT1150A 6-week HFD-fed hyperinsulinemic-euglycemic clamp cohort.
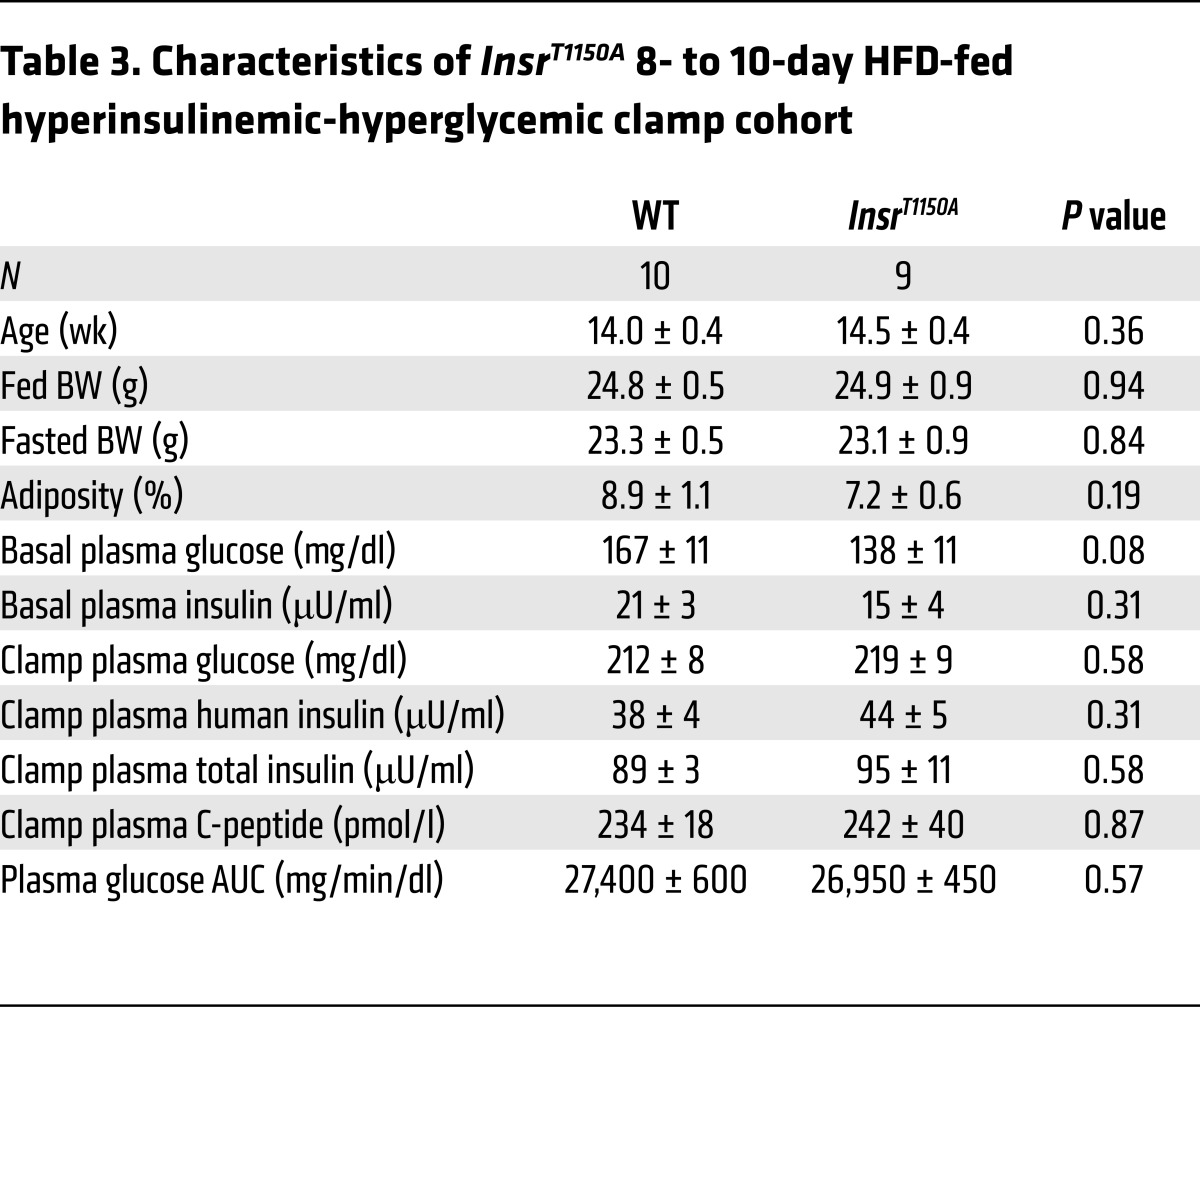
A key component of hepatic insulin action, essential for normal whole-body glucose homeostasis, is the stimulation of net hepatic glycogen synthesis, which requires both hyperinsulinemia and hyperglycemia (23). Thus, to test whether InsrT1150A mice were protected from HFD-induced defects in hepatic glycogen synthesis, we performed hyperinsulinemic-hyperglycemic clamp studies in mice fed an HFD for 8 to 10 days to induce hepatic insulin resistance in WT controls. InsrT1150A mice did not differ from WT controls in terms of age, BW, or adiposity, and plasma glucose, insulin, and C-peptide levels were similar between groups (Table 3). Although post-clamp total hepatic glycogen content was significantly increased in InsrT1150A livers (Figure 5A), the 13-hour fast used in these studies did not totally deplete liver glycogen stores, thus complicating the interpretation of these data. To more accurately assess insulin-stimulated hepatic glycogen synthesis during the clamp, we devised a method for quantifying pathway-specific glycogen synthetic fluxes using [U-13C]-glucose. Glycogen synthetic flux through the direct pathway, calculated from [U-13C]-glucose incorporation into liver glycogen, was approximately 3-fold greater in InsrT1150A mice (Figure 5B and Supplemental Figure 12, A and B). We then calculated the relative pathway contributions (direct and indirect) to hepatic glycogen synthesis from [U-13C]-glucose incorporation into UDP-glucose, which revealed that total hepatic glycogen synthesis was increased by more than 2-fold in InsrT1150A mice (Figure 5C and Supplemental Figures 12, C and D). Insulin induction of glucokinase expression was enhanced in InsrT1150A livers (Figure 5D); because glucokinase expression is a powerful controller of hepatic glycogen synthesis (24), it is likely that this effect accounts for a portion of the increment in glycogen synthetic rate. InsrT1150A mice again displayed increased glucose infusion rates and EGP suppression, but no difference in peripheral glucose uptake, in these studies (Supplemental Figure 13). Protein expression of the gluconeogenic enzymes pyruvate carboxylase, phosphoenolpyruvate carboxykinase, and glucose-6-phosphatase was not different between groups, arguing against the involvement of FoxO-dependent transcriptional effects in the increased EGP suppression observed in InsrT1150A mice (Supplemental Figure 14). Together, these measurements of glycogen synthesis provide further evidence that InsrT1150A mice are protected from lipid-induced hepatic insulin resistance.
Table 3. Characteristics of InsrT1150A 8- to 10-day HFD-fed hyperinsulinemic-hyperglycemic clamp cohort.
Figure 5. Increased insulin-stimulated hepatic glycogen synthesis in HFD-fed InsrT1150A mice.
Male InsrT1150A and WT littermate mice were fed an HFD for 8 to 10 days and fasted for 13 hours before undergoing hyperinsulinemic-hyperglycemic clamp studies. [U-13C]-glucose was infused to assess glycogen synthesis rates. (A) Total liver glycogen content after clamp studies. (B) Glycogen synthesis flux through the direct pathway during the clamp. (C) Total glycogen synthesis flux through both direct and indirect pathways during the clamp. (D) Relative Gck mRNA expression in fasted and post-clamp mice measured by qPCR and normalized to basal WT expression. (A–C) Data represent the mean ± SEM. n = 9 WT and n = 10 InsrT1150A mice per group. *P < 0.05 and **P < 0.005, by unpaired, 2-tailed Student’s t test. (D) Data represent the mean ± SEM. n = 4 (basal) and n = 5–7 (post-clamp) mice per group. *P < 0.05 and ***P < 0.0005, by 2-way ANOVA with Holm-Sidak correction for multiple comparisons.
Discussion
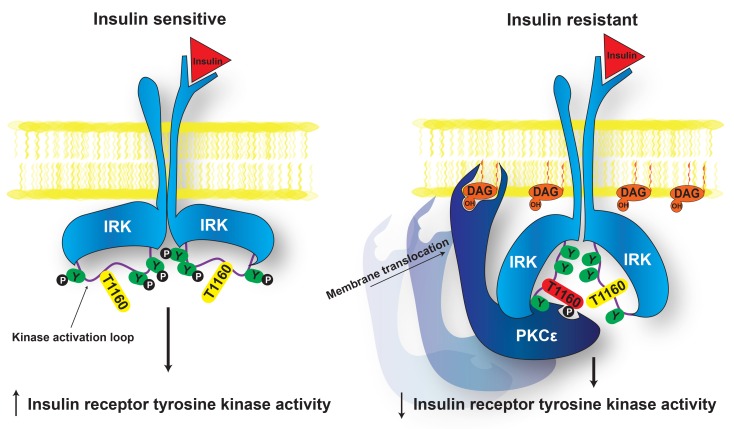
DAG activation of PKCε and PKCε inhibition of IRK activity have been implicated in the pathogenesis of hepatic insulin resistance, but the nature of the PKCε-INSR interaction had been obscure (12, 13). Our results identify this critical missing link by demonstrating that PKCε phosphorylates INSR Thr1160 in the kinase activation loop, destabilizing its active configuration and thereby inhibiting IRK activity (Figure 6). Using in vitro and cell-based systems, we show that INSR Thr1160 phosphorylation is both necessary and sufficient for PKCε inhibition of IRK activity. We confirm the physiological significance of this mechanism by showing in mice that INSR Thr1150 phosphorylation is necessary for acute lipid-induced hepatic insulin resistance. Our study therefore provides mechanistic insight into the controversial association between hepatic lipids and hepatic insulin resistance (5, 6).
Figure 6. Proposed mechanism of lipid-induced hepatic insulin resistance.
In normal, insulin-sensitive liver (left), Thr1160 does not interfere with IRK activation, and downstream signaling proceeds normally upon insulin binding. In NAFLD (right), DAG accumulation promotes membrane translocation of PKCε, which in turn phosphorylates INSR Thr1160 to impair IRK activity and thereby induces hepatic insulin resistance. Y, tyrosine; P, phosphate.
Whether NAFLD plays a causal role in hepatic insulin resistance, is caused by hepatic insulin resistance, or is unrelated to hepatic insulin resistance is actively debated. Many studies have dissociated hepatic triglyceride and DAG accumulation from hepatic insulin resistance (6). For example, mice lacking the adipose triglyceride lipase (ATGL) cofactor CGI-58 develop massive hepatic steatosis and elevated DAG levels, yet retain hepatic insulin sensitivity (9). Similar phenotypes are observed in mice with defective VLDL secretion owing to knockout of microsomal triglyceride transfer protein (Mttp) (8) and mice with liver-specific deletion of histone deacetylase 3 (Hdac3) (7). Though the elevated hepatic lipids of such models are typically measured with low, whole-tissue resolution and do not necessarily recapitulate the subcellular pattern of lipid accumulation observed in diet-induced NAFLD (25), they have nevertheless raised serious challenges for the hypothesis that hepatic lipid accumulation causes hepatic insulin resistance.
Additionally, myriad lipid and nonlipid mediators of hepatic insulin resistance have been posited (13). For example, ceramides have been suggested to interfere with insulin action by AKT inhibition (26), endoplasmic reticulum stress by IRS-1 inhibition (27), and inflammation through several pathways (13, 21). However, these putative mediators all impinge on distal insulin-signaling effectors and therefore do not explain the defect in IRK activity observed in diet-induced obese rodent and human livers (12, 28).
The insulin receptor is a logical locus of control in cellular insulin action and resistance. The discovery of impaired liver IRK activity in obese insulin-resistant humans almost 30 years ago (28, 29) suggested IRK regulation as a pathophysiological mechanism for hepatic insulin resistance, but most studies since have focused on post-receptor defects as being central to insulin resistance (30–33). Distal effectors such as PI3K and AKT have multiple overlapping inputs, so primary defects in PI3K or AKT would blunt many anabolic programs independently of insulin action (34). In addition, insulin signal transduction begins to ramify at the level of the INSR, so insulin resistance targeting any downstream effector is likely to leave some elements of insulin action intact. DAG/PKCε modulation of insulin signaling through INSR is thus a parsimonious biological mechanism for insulin resistance.
These data raise several important questions, including whether other kinases mediate insulin resistance in vivo by Thr1160 phosphorylation. In this regard, the highly promiscuous protein kinase CK2 has been shown to phosphorylate Thr1160 in vitro, although it is unknown whether this occurs in cells or in vivo (35). Unlike PKCε, protein kinase CK2 is not activated by lipid accumulation. Nonetheless, this and other protein kinases may converge on Thr1160 as a common regulatory mechanism for IRK activity. Whether Thr1160 phosphorylation contributes to insulin resistance induced by glucagon, glucocorticoids, catecholamines, or other mediators also remains to be explored. Finally, it is unknown whether Thr1160 phosphorylation serves a physiological role in addition to its pathophysiological role in lipid-induced insulin resistance.
INSR Thr1160 is not in a canonical linear PKCε phosphorylation consensus motif (36), but the 3D structure of the substrate is also critical for determining whether a kinase can phosphorylate a given target in vivo (37). In particular, residues in flexible secondary structures such as loops are markedly overrepresented in unbiased, large phosphoproteomic data sets, suggesting that their conformational flexibility facilitates interaction with kinases (38). The activation loop in the unphosphorylated IRK domain is in equilibrium between a number of different conformational states, one of which is the autoinhibitory conformation observed in the original crystal structure (18). The 3 phosphorylatable tyrosines in the activation loop (Tyr1158, Tyr1162, and Tyr1163) become accessible (through conformational equilibrium) for phosphorylation in trans by the other IRK in the INSR dimer (upon insulin-induced IRK juxtaposition). Likewise, Thr1160 (between Tyr1158 and Tyr1162) would presumably also become accessible for phosphorylation by a kinase, e.g., PKCε. Whether there is a distal (from the IRK active site) recruitment interaction between PKCε and the INSR that facilitates phosphorylation of Thr1160 by PKCε is not known.
Why would the hepatocyte need a mechanism for lipid-induced insulin resistance? It is tempting to speculate that the DAG/PKCε/INSR axis represents a hepatocyte-autonomous response to nutrient oversupply, acting to limit glycogen and lipid storage. Operating in the short term, this mechanism would promote appropriate energy diversion and storage in adipose tissue. Operating in the long term, it is thwarted by continued substrate (fatty acid)-driven lipogenesis, which occurs in an insulin-independent manner (39). This in turn will result in decreased insulin-stimulated net hepatic glycogen synthesis which in turn will promote decreased insulin suppression of hepatic glucose production and postprandial hyperglycemia.
This mechanism has direct clinical implications. Though NAFLD is epidemiologically recognized as a risk factor for more severe clinical entities such as nonalcoholic steatohepatitis (40), hepatocellular carcinoma (40), and T2D (41), most individuals with NAFLD — an estimated 30% of Americans (1) — are undiagnosed (42), and there is ample conflicting evidence regarding a causative role of lipids in hepatic insulin resistance (6). Our identification of a specific molecular mechanism causally linking lipid accumulation to hepatic insulin resistance provides impetus to the clinical effort to improve NAFLD diagnostic screening for the early identification of patients at risk for T2D.
Methods
Animals and diets.
Mice received ad libitum access to food and water and were generated and housed in the Yale Animal Resources Center at 23°C under a 12-hour light/12-hour dark cycles (0700–1900h). Male mice were studied at 14 to 19 weeks of age. The following diets were used: regular chow diet (Harlan Teklad TD2018: 18% fat, 58% carbohydrate, and 24% protein) and a HFD (Research Diets D12492: 60% fat, 20% carbohydrate, and 20% protein). For all animal studies, sample sizes were preselected to yield 90% power (at α = 0.05) to detect 20% differences in metabolic parameters, with an expected SD of 10%. Mice were randomly allocated to experimental groups, and weight matching was ensured before beginning experimental protocols. The investigators were not always blinded to genotype during the studies.
Generation of InsrT1150A mice.
Segments of the mouse Insr gene were amplified with Pfu-Ultra II Fusion HS DNA Polymerase (Agilent Technologies) and a mouse genomic BAC clone, RP23-99G1 (BACPAC Resources Center). A 911-bp segment containing exon 19 and the Thr1160 target codon was inserted into the plasmid pEZ FrtLox DT (a gift of Klaus Rajewsky, Max Delbrück Center [MDC] for Molecular Medicine Berlin, Berlin, Germany; Addgene plasmid 11736) using In-Fusion cloning (Takara Clontech). Mutation of Thr to Ala was carried out using QuikChange II site-directed mutagenesis (Agilent Technologies). A 5′ homology arm of 4,118 bp and a 3′ homology arm of 4,463 bp, representing genomic sequences immediately upstream and downstream of the exon 19 segment, were inserted into the plasmid, which was then linearized and electroporated into C57Bl/6 embryonic stem (ES) cells. C57Bl/6 ES cells were homozygous for an agouti allele (Aw-J) to allow for coat color assessment in chimeras resulting from injection into C57Bl/6 blastocysts. This ES cell line, B6Aw6, was derived from C57BL/6J-Aw-J/J mouse blastocysts (The Jackson Laboratory) using standard techniques (43) in complete ES medium supplemented with 1,500 U/ml LIF (EMD Millipore) and 1 μM PD0325901 (Stemgent). ES cell clones were screened by long-range PCR across the homology arms using Pfu-Ultra II Fusion HS DNA Polymerase, followed by sequencing of the junction fragments. Chimeric mice were obtained following ES cell microinjection into C57Bl/6 blastocysts, and these founders exhibited germline transmission of the knockin gene. Subsequent breeding confirmed transmission of the knockin allele at Mendelian ratios.
Hyperinsulinemic-euglycemic and hyperinsulinemic-hyperglycemic clamp studies.
Clamps and calculations were performed as previously described (44) and were in compliance with the standard operating procedures of the NIH Mouse Metabolic Phenotyping Center (MMPC) consortium (45). Study cohorts consisted of homozygous male InsrT1150A mice and littermate male WT controls. Catheters were placed in the jugular vein 6–9 days before the experiments; only mice that recovered more than 95% of their preoperative BW were studied. Overnight-fasted, awake mice under gentle tail restraint were first infused with [3-3H]-glucose (0.05 μCi/min; PerkinElmer) for 120 minutes to measure basal glucose turnover. Hyperinsulinemia was achieved using a primed-continuous human insulin (Novolin; Novo Nordisk) infusion. For studies of mice fed regular chow or an HFD for 8 to 10 days, the insulin infusion rate was 6.0 mU/kg/min for 3 minutes, followed by 2.5 mU/kg/min for 140 minutes. For studies of mice fed an HFD for 6 weeks, the insulin infusion rate was 7.1 mU/ kg/ min for 3 minutes, followed by 3 mU/kg/min for 140 minutes. In euglycemic clamp studies, 20% dextrose was infused at a variable rate to maintain euglycemia (110–130 mg/dl). In hyperglycemic clamp studies, 40% dextrose (20% cold glucose; 20% [U-13C]-glucose [99% 13C-enriched]) was infused at a variable rate to maintain hyperglycemia (210–230 mg/dl). In all studies, the variable glucose infusion contained [3-3H]-glucose at a target infusion rate of 0.1 μCi/min (hot-GINF). A 10-μCi bolus of 2-deoxy-[1-14C]-glucose (PerkinElmer) was injected at the 85th minute to monitor tissue-specific insulin-stimulated glucose uptake. Blood samples were collected by tail bleeding for determination of plasma glucose, insulin, NEFAs, C-peptide, [U-13C]-glucose enrichment, and 3H-glucose–specific activity.
At the end of the clamp, mice were anesthetized with pentobarbital sodium (150 mg/kg), and tissues were rapidly harvested and snap-frozen with clamps precooled in liquid N2. Tissues were stored at –80°C and plasma at –20°C for subsequent analysis. Plasma glucose–specific activity was measured as previously described (44). Plasma glucose was measured using a YSI Biochemistry Analyzer (Yellow Springs Instruments). Plasma insulin was measured by radioimmunoassay (EMD Millipore) for hyperinsulinemic-euglycemic clamps or ELISA (Mercodia) for hyperinsulinemic-hyperglycemic clamps. Plasma NEFAs were measured enzymatically (NEFA-HR; Wako). Plasma triglycerides, total cholesterol, HDL cholesterol, and LDL cholesterol were measured by Cobas (Roche Diagnostic). Plasma C-peptide levels were measured by ELISA (Alpco). Tissue 2-deoxyglucose uptake was assayed as previously described (44).
Liver glycogen synthesis.
Total liver glycogen was measured after amyloglucosidase digestion of tissue extracts as previously described (46). For measurement of m+6 glucose enrichment in liver glycogen, glycogen was ethanol precipitated from perchloric acid extracts, dialyzed extensively against deionized water to remove free glucose, and digested with amyloglucosidase. Digested liver glycogen and deproteinized plasma glucose were derivatized as the pentaacetate. Gas chromatography–mass spectrometry (GC-MS) determination of the m+6 mole fraction in liver glycogen (Xm+6glycogen) and plasma glucose (Xm+6glucose) was performed as previously described (47), where:

(Equation 1)

(Equation 2)
Absolute rates of direct pathway glycogen synthesis were calculated as:

(Equation 3)
To determine relative pathway contributions to hepatic glycogen synthesis, we measured m+6 enrichment in UDP-glucose, the synthetic precursor to glycogen. Liver uridine diphosphate–glucose (UDP-glucose) was measured from trichloroacetic acid extracts filtered with Nanosep 100K centrifugal devices (Pall Corp.) by LC-MS/MS. Method development and analysis were performed on an Applied Biosystems 6500 QTRAP equipped with a Shimadzu ultrafast liquid chromatography (UFLC) system. Electrospray ionization with a negative mode was used. The UDP-glucose m+0 (565/323) through m+6 (571/323) ion pairs were monitored to determine the m+6 mole fraction (Xm+6UDP – glucose):

(Equation 4)
The optimized collision energy, declustering potential, entrance potential, and collision cell exit potential were –32.5, –100, –10, and –15 V, respectively. The optimized instrument parameters were as follows: curtain gas (20 psi), collision gas (medium), ionization potential (–4,500 V), probe temperature (550°C), ion source gas 1 (65 psi), and ion source gas 2 (65 psi). A C8 HPLC column (100 mm × 3 mm) was used to improve sensitivity and resolution with a mixed solvent of 10 mM aqueous ammonium acetate and acetonitrile.
The fractional direct pathway contribution D was calculated as:

(Equation 5)
The remainder was taken to reflect indirect pathway glycogen synthesis (48). Total glycogen synthetic flux was then calculated as:

(Equation 6)
Body composition measurements and metabolic cage studies.
Body composition was measured by 1H magnetic resonance spectroscopy using a Bruker Minispec analyzer. Energy expenditure and caloric intake were measured in a Comprehensive Laboratory Animal Monitoring System (CLAMS; Columbus Instruments). Mice were allowed to acclimate to the metabolic cages for 24 hours before beginning data collection.
In vitro insulin receptor kinase assays.
Recombinant human IRK domain (INSR [residues 978–1283]; WT, T1160A, and T1160E) was expressed in Sf9 insect cells and purified by ion-exchange chromatography (Source Q; GE Healthcare), followed by size-exclusion chromatography (Superdex 75; GE Healthcare). IRK was preincubated in 50 mM Tris-HCl, pH 7.5, 0.1 mM EGTA, 0.1 mM Na3VO4, 0.1% β-mercaptoethanol, 10 mM MnCl2, 1 mg/ml BSA, 7.5 mM MgCl2, and 0.05 mM ATP for 10 minutes at 30°C with recombinant active human PKCε (EMD Millipore) or recombinant active human PKC isoforms α, β1, β2, δ, θ, or ζ (Abcam) with PKC lipid activator (EMD Millipore) at the various molar ratios indicated in the legends to Figure 1 and Supplemental Figure 1. Reactions with cPKC isoforms (α, β1, β2) contained 10 mM CaCl2. To begin the kinase assay, the synthetic IRK substrate Axltide (0.25 mM; EMD Millipore), Mg-ATP (to 0.1 mM), and [γ-32P]-ATP (2-5 μCi; PerkinElmer) were added. The reaction was incubated at 30°C for 10 minutes and stopped by adding H3PO4 to 1% v/v final concentration. Aliquots were spotted to Whatman P81 phosphocellulose filters, air-dried, washed thrice in 0.75% H3PO4, washed once in acetone, and air-dried. 32P incorporation into Axltide was measured by scintillation counting.
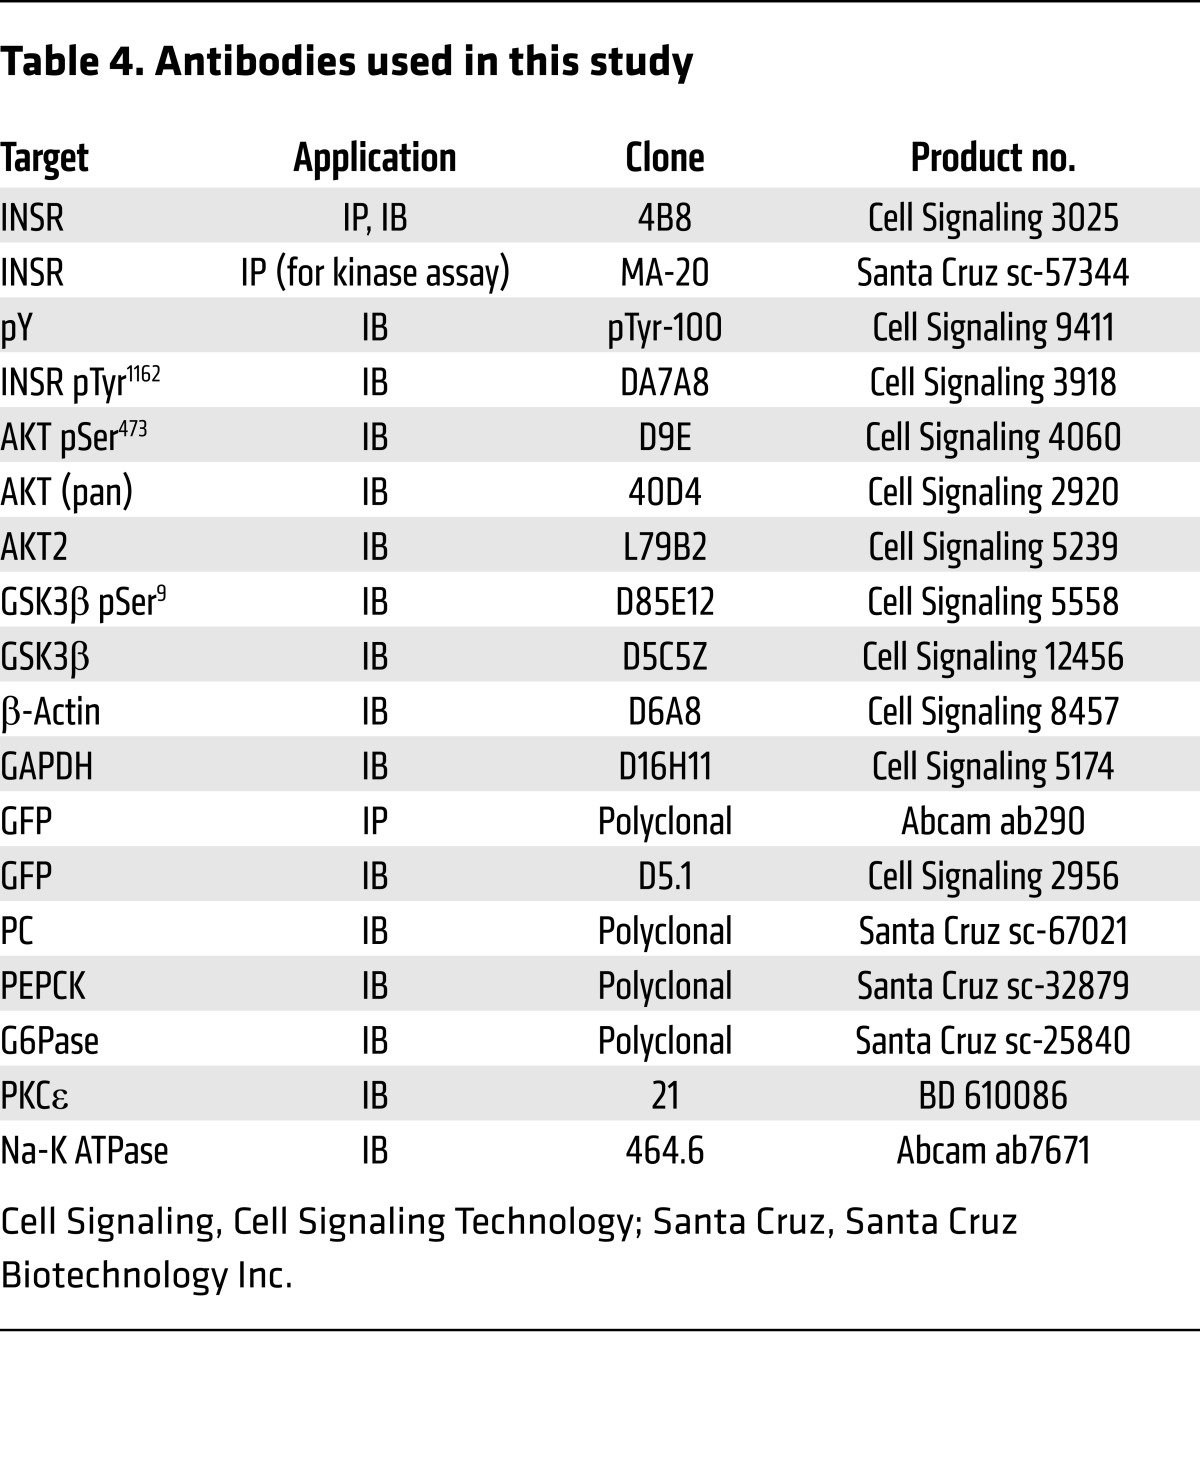
For ex vivo IRK activity assays, immunoprecipitates were prepared as described below, using anti-INSR antibody (49) for mouse liver studies and anti-GFP antibody for transfected HeLa cell studies (Table 4). IRK activity was determined by the method described above but without PKCε preincubation.
Table 4. Antibodies used in this study.
Mass spectrometry of phosphorylated IRK.
Kinase reactions were resolved on SDS-PAGE gels. Coomassie-stained IRK bands were excised, digested with trypsin, and subjected to phosphopeptide enrichment with titanium dioxide. Sample preparation and mass spectrometry of the IRK samples were performed essentially as described previously (50). Briefly, Coomassie R-250–stained bands were excised from the gel, cut into 1-mm cubes, and washed first in 1:1 (v/v) 50% acetonitrile (ACN), 50 mM NH5HCO3, then in 1:1 (v/v) 50% ACN, and 10 mM NH5CO3. A 13.33 ng/μl trypsin (Promega) solution in 9:1 (v/v) 50 mM NH5CO3/50% ACN was added, and samples were incubated overnight at 37°C. Peptides were extracted with 0.5% TFA/50% ACN and dried and then enriched by reconstituting in 20 μl binding buffer (0.5% TFA/50% ACN) and loading onto custom-made stage tips (1 × 0.6-mm punch of Empore C18 Extraction Disks [3M] in a 200-μl pipette tip, loaded with 400 μg Titanshere TiO2 Microspheres [GL Sciences]) (51). Peptides were washed twice with binding buffer and once with 0.1% FA/80% ACN and then eluted with 1% NH4OH, followed by 0.1% FA/80% ACN into 70% FA. Peptides were dried down and reconstituted for LC-MS/MS analysis, then separated on a Thermo Easy nLC 1000 HPLC platform using a 90-minute nonlinear gradient from 2% to 80% ACN 0.1% FA, and analyzed using a Thermo Q Exactive Plus. Individual MS/MS spectra were analyzed by manual inspection (including comparison with stable isotope-labeled synthetic peptides [JPT]), with MaxQuant software, version 1.4.1.2 (52), and with Skyline, version 3.5 (53).
Cell culture.
HeLa cells (ATCC) were maintained in DMEM supplemented with 10% FBS, 1 U/ml penicillin, and 1 μg/ml streptomycin. McArdle RH-7777 rat hepatoma cells (ATCC) were maintained in DMEM supplemented with 10% FBS, 10% horse serum, 1 U/ml penicillin, and 1 μg/ml streptomycin. Cells were transfected using Lipofectamine 3000 (Life Technologies, Thermo Fisher Scientific). The human INSR-GFP plasmid was a gift of Joseph Bass (Northwestern University, Evanston, Illinois, USA; Addgene plasmid 22286) (54). T1160E site-directed mutagenesis was performed with the QuikChange II XL Kit (Agilent Technologies) and confirmed by sequencing. For insulin stimulation, cells were serum starved for 16 hours and treated with insulin (Sigma-Aldrich) as described in the legend to Figure 2.
Immunoblotting and IP.
Tissue lysates were prepared in RIPA buffer with freshly added protease inhibitors (cOmplete MINI; Roche) and phosphatase inhibitors (PhosSTOP; Roche). Protein was measured by the bicinchoninic acid assay (Pierce). Equal amounts of protein were boiled in Laemmli sample buffer containing 2% β-mercaptoethanol and separated on 4% to 12% Tris-glycine gels (Novex). Proteins were electroblotted to PVDF membranes (Immobilon-P; EMD Millipore) by semi-dry transfer. Ponceau S staining was used to confirm transfer homogeneity. Nonspecific binding sites were blocked in 5% nonfat dry milk or 5% BSA according to the manufacturer’s recommendations in Tris-buffered saline containing 0.05% Tween-20 (TBS-T). Membranes were probed overnight at 4°C with primary antibodies (Table 4) diluted in blocking solution. Membranes were then washed in TBS-T and incubated for 1 hour at room temperature with HRP-conjugated secondary antibodies (Cell Signaling Technology) diluted in blocking buffer. After further washing in TBS-T, antibody binding was visualized by enhanced chemiluminescence (Pierce). Films were developed at multiple exposures and images within the linear dynamic range of signal intensity were scanned for digital analysis. Densitometry was performed using ImageJ software (NIH). Immunoblot intensities were normalized for loading as described in the figure legends.
IPs were performed using 1–2 mg protein from lysates prepared as described above, but in 1% Triton X-100 cell lysis buffer (Cell Signaling Technology). Lysates were precleared with protein A/G agarose beads (Santa Cruz Biotechnology Inc.) and incubated with antibody (Table 4) and beads for 16 hours with end-over-end mixing. Immune complexes were washed extensively in lysis buffer and eluted in Laemmli buffer for immunoblot analysis or used in kinase assays after washing in kinase assay buffer.
PKCε translocation assay.
Membrane-associated and cytosolic fractions were prepared as described previously (55), with modifications. Pulverized liver from mice fasted for 6 hours was homogenized in ice-cold buffer A containing 20 mM Tris-HCl, pH 7.4, 1 mM EDTA, 0.25 mM EGTA, 250 mM sucrose, and freshly added protease inhibitors (cOmplete MINI; Roche) and phosphatase inhibitors (PhosSTOP; Roche). Debris was removed by centrifugation (5 min, 280 g, 4°C). Lysate was centrifuged (60 min, 100,000 g, 4°C), and an aliquot of the supernatant was saved as the cytosolic fraction. The pellet was washed once in ice-cold buffer B containing 250 mM Tris-HCl, pH 7.4, 1 mM EDTA, 0.25 mM EGTA, 2% Triton X-100, and freshly added protease and phosphatase inhibitors. The pellet was resuspended in buffer B by sonication, incubated at 4°C for 45 minutes to solubilize membrane proteins, and centrifuged (60 min, 100,000 g, 4°C). An aliquot of the supernatant was saved as the membrane fraction. Equal amounts of protein were subjected to SDS-PAGE, immunoblotting, and densitometry as described above. The ratio of membrane PKCε intensity (normalized to Na-K ATPase intensity) to cytosolic PKCε intensity (normalized to GAPDH intensity) was calculated.
Liver lipid measurements.
Mice were fasted 6 hours before liver collection. Liver triglycerides were extracted by the method of Bligh and Dyer (56) and measured using a colorimetric assay (Sekisui). Liver diacylglycerols were extracted from cytosolic/lipid droplet and membrane-associated fractions and measured by LC-MS/MS essentially as described (25, 57). Total diacylglycerols are reported as the sum of individual species.
Quantitative real-time PCR.
RNA was isolated from livers of overnight-fasted (“basal”) or post-clamp (“clamp”) mice using the QIAGEN RNEasy Mini Kit. cDNA synthesis was performed with oligo-dT primers using the ProtoScript cDNA synthesis kit (New England BioLabs). qPCR was performed using iTaq SYBR Green (Bio-Rad) on an Applied Biosystems 7500 Fast qRT-PCR system. The following primers were used: actin, 5′-CCAGATCATGTTTGAGACCTTC-3′ and 5′-CATGAGGTAGTCTGTCAGGTCC-3′; glucokinase, 5′-TGAGCCGGATGCAGAAGGA-3′ and 5′-GCAACATCTTTACACTGGCCT-3′. Standard curves with pooled cDNA were used to calculate amplification efficiencies and relative gene expression was normalized to actin expression using the Pfaffl method (58).
Statistics.
For comparisons of more than 2 groups, 2-way ANOVA with Holm-Sidak post-hoc testing to adjust for multiple comparisons was performed. For comparisons of two groups with equal variance, unpaired parametric 2-tailed Student’s t test was performed. P values of less than 0.05 were considered significant. All statistical analysis was performed in GraphPad Prism 6 software.
Study approval.
All experimental protocols involving animals were approved by the IACUC of Yale University.
Author contributions
MCP, AKM, MJJ, VTS, JR, and GIS designed the experimental protocols. MCP, AKM, BMG, MM, ARN, GB, MJM, DZ, XMZ, and JR performed experiments. MCP, AKM, BMG, ARN, DZ, XMZ, JR, and GIS analyzed data. SRH performed structural analyses and contributed reagents. WP contributed reagents and engineered the InsrT1150A mice. MCP, JR, and GIS wrote the manuscript with input from all co-authors.
Supplementary Material
Acknowledgments
We thank Tim Nottoli, Xiaoxian Ma, Yanna Kosover, John Stack, Mario Kahn, Irina Smolgovsky, Tom Nuzzo, and Maria Batsu for their invaluable technical assistance and Gary Cline and Fred Gorelick for their helpful discussions. This research was funded by grants from the NIH (R01 DK-40936, U24 DK-059635, P30 DK-45735, and P30 DK-34989) and the Novo Nordisk Foundation Center for Basic Metabolic Research, University of Copenhagen, Copenhagen, Denmark (to GIS). MJJ is supported by NIH grant K01 DK-099402. BMG is supported by the National Science Foundation Graduate Research Fellowship grant DGE1122492. MCP is supported by the NIH Medical Scientist Training Program grant T32 GM-007205 and the NIH National Research Service Award (NRSA) grant F30 DK-104596.
Footnotes
Conflict of interest: The authors have declared that no conflict of interest exists.
Reference information:J Clin Invest. 2016;126(11):4361–4371. doi:10.1172/JCI86013.
Contributor Information
Anila K. Madiraju, Email: anila.madiraju@gmail.com.
Michael Marcel, Email: michael.marcel@yale.edu.
Gina Butrico, Email: gina.butrico@yale.edu.
Dongyan Zhang, Email: dongyan.zhang@yale.edu.
Abudukadier Abulizi, Email: abudukadier.abulizi@yale.edu.
Xian-Man Zhang, Email: xian-man.zhang@yale.edu.
William Philbrick, Email: william.philbrick@yale.edu.
Michael J. Jurczak, Email: jurczakm@pitt.edu.
Jesse Rinehart, Email: jesse.rinehart@yale.edu.
Gerald I. Shulman, Email: gerald.shulman@yale.edu.
References
- 1.Bellentani S, Scaglioni F, Marino M, Bedogni G. Epidemiology of non-alcoholic fatty liver disease. Dig Dis. 2010;28(1):155–161. doi: 10.1159/000282080. [DOI] [PubMed] [Google Scholar]
- 2.Silverman JF, et al. Liver pathology in morbidly obese patients with and without diabetes. Am J Gastroenterol. 1990;85(10):1349–1355. [PubMed] [Google Scholar]
- 3.Korenblat KM, Fabbrini E, Mohammed BS, Klein S. Liver, muscle, and adipose tissue insulin action is directly related to intrahepatic triglyceride content in obese subjects. Gastroenterology. 2008;134(5):1369–1375. doi: 10.1053/j.gastro.2008.01.075. [DOI] [PMC free article] [PubMed] [Google Scholar]
- 4.Marchesini G, et al. Association of nonalcoholic fatty liver disease with insulin resistance. Am J Med. 1999;107(5):450–455. doi: 10.1016/S0002-9343(99)00271-5. [DOI] [PubMed] [Google Scholar]
- 5.Perry RJ, Samuel VT, Petersen KF, Shulman GI. The role of hepatic lipids in hepatic insulin resistance and type 2 diabetes. Nature. 2014;510(7503):84–91. doi: 10.1038/nature13478. [DOI] [PMC free article] [PubMed] [Google Scholar]
- 6.Farese RV, Zechner R, Newgard CB, Walther TC. The problem of establishing relationships between hepatic steatosis and hepatic insulin resistance. Cell Metab. 2012;15(5):570–573. doi: 10.1016/j.cmet.2012.03.004. [DOI] [PMC free article] [PubMed] [Google Scholar]
- 7.Sun Z, et al. Hepatic Hdac3 promotes gluconeogenesis by repressing lipid synthesis and sequestration. Nat Med. 2012;18(6):934–942. doi: 10.1038/nm.2744. [DOI] [PMC free article] [PubMed] [Google Scholar]
- 8.Minehira K, et al. Blocking VLDL secretion causes hepatic steatosis but does not affect peripheral lipid stores or insulin sensitivity in mice. J Lipid Res. 2008;49(9):2038–2044. doi: 10.1194/jlr.M800248-JLR200. [DOI] [PMC free article] [PubMed] [Google Scholar]
- 9.Brown JM, et al. CGI-58 knockdown in mice causes hepatic steatosis but prevents diet-induced obesity and glucose intolerance. J Lipid Res. 2010;51(11):3306–3315. doi: 10.1194/jlr.M010256. [DOI] [PMC free article] [PubMed] [Google Scholar]
- 10.Monetti M, et al. Dissociation of hepatic steatosis and insulin resistance in mice overexpressing DGAT in the liver. Cell Metab. 2007;6(1):69–78. doi: 10.1016/j.cmet.2007.05.005. [DOI] [PubMed] [Google Scholar]
- 11.Bugianesi E, McCullough AJ, Marchesini G. Insulin resistance: a metabolic pathway to chronic liver disease. Hepatology. 2005;42(5):987–1000. doi: 10.1002/hep.20920. [DOI] [PubMed] [Google Scholar]
- 12.Samuel VT, et al. Inhibition of protein kinase Cepsilon prevents hepatic insulin resistance in nonalcoholic fatty liver disease. J Clin Invest. 2007;117(3):739–745. doi: 10.1172/JCI30400. [DOI] [PMC free article] [PubMed] [Google Scholar]
- 13.Samuel VT, Shulman GI. Mechanisms for insulin resistance: common threads and missing links. Cell. 2012;148(5):852–871. doi: 10.1016/j.cell.2012.02.017. [DOI] [PMC free article] [PubMed] [Google Scholar]
- 14.Kumashiro N, et al. Cellular mechanism of insulin resistance in nonalcoholic fatty liver disease. Proc Natl Acad Sci U S A. 2011;108(39):16381–16385. doi: 10.1073/pnas.1113359108. [DOI] [PMC free article] [PubMed] [Google Scholar]
- 15.Samuel VT, et al. Mechanism of hepatic insulin resistance in non-alcoholic fatty liver disease. J Biol Chem. 2004;279(31):32345–32353. doi: 10.1074/jbc.M313478200. [DOI] [PubMed] [Google Scholar]
- 16.Raddatz K, et al. Time-dependent effects of Prkce deletion on glucose homeostasis and hepatic lipid metabolism on dietary lipid oversupply in mice. Diabetologia. 2011;54(6):1447–1456. doi: 10.1007/s00125-011-2073-0. [DOI] [PubMed] [Google Scholar]
- 17.Hubbard SR. The insulin receptor: both a prototypical and atypical receptor tyrosine kinase. Cold Spring Harb Perspect Biol. 2013;5(3): doi: 10.1101/cshperspect.a008946. [DOI] [PMC free article] [PubMed] [Google Scholar]
- 18.Hubbard SR, Wei L, Ellis L, Hendrickson WA. Crystal structure of the tyrosine kinase domain of the human insulin receptor. Nature. 1994;372(6508):746–754. doi: 10.1038/372746a0. [DOI] [PubMed] [Google Scholar]
- 19.Hubbard SR. Crystal structure of the activated insulin receptor tyrosine kinase in complex with peptide substrate and ATP analog. EMBO J. 1997;16(18):5572–5581. doi: 10.1093/emboj/16.18.5572. [DOI] [PMC free article] [PubMed] [Google Scholar]
- 20.Turner N, et al. Distinct patterns of tissue-specific lipid accumulation during the induction of insulin resistance in mice by high-fat feeding. Diabetologia. 2013;56(7):1638–1648. doi: 10.1007/s00125-013-2913-1. [DOI] [PubMed] [Google Scholar]
- 21.Perry RJ, et al. Hepatic acetyl CoA links adipose tissue inflammation to hepatic insulin resistance and type 2 diabetes. Cell. 2015;160(4):745–758. doi: 10.1016/j.cell.2015.01.012. [DOI] [PMC free article] [PubMed] [Google Scholar]
- 22.Rebrin K, Steil GM, Mittelman SD, Bergman RN. Causal linkage between insulin suppression of lipolysis and suppression of liver glucose output in dogs. J Clin Invest. 1996;98(3):741–749. doi: 10.1172/JCI118846. [DOI] [PMC free article] [PubMed] [Google Scholar]
- 23.Petersen KF, Laurent D, Rothman DL, Cline GW, Shulman GI. Mechanism by which glucose and insulin inhibit net hepatic glycogenolysis in humans. J Clin Invest. 1998;101(6):1203–1209. doi: 10.1172/JCI579. [DOI] [PMC free article] [PubMed] [Google Scholar]
- 24.Agius L. Glucokinase and molecular aspects of liver glycogen metabolism. Biochem J. 2008;414(1):1–18. doi: 10.1042/BJ20080595. [DOI] [PubMed] [Google Scholar]
- 25.Cantley JL, et al. CGI-58 knockdown sequesters diacylglycerols in lipid droplets/ER-preventing diacylglycerol-mediated hepatic insulin resistance. Proc Natl Acad Sci U S A. 2013;110(5):1869–1874. doi: 10.1073/pnas.1219456110. [DOI] [PMC free article] [PubMed] [Google Scholar]
- 26.Chaurasia B, Summers SA. Ceramides - lipotoxic inducers of metabolic disorders. Trends Endocrinol Metab. 2015;26(10):538–550. doi: 10.1016/j.tem.2015.07.006. [DOI] [PubMed] [Google Scholar]
- 27.Ozcan U, et al. Endoplasmic reticulum stress links obesity, insulin action, and type 2 diabetes. Science. 2004;306(5695):457–461. doi: 10.1126/science.1103160. [DOI] [PubMed] [Google Scholar]
- 28.Caro JF, et al. Studies on the mechanism of insulin resistance in the liver from humans with noninsulin-dependent diabetes. Insulin action and binding in isolated hepatocytes, insulin receptor structure, and kinase activity. J Clin Invest. 1986;78(1):249–258. doi: 10.1172/JCI112558. [DOI] [PMC free article] [PubMed] [Google Scholar]
- 29.Watarai T, Kobayashi M, Takata Y, Sasaoka T, Iwasaki M, Shigeta Y. Alteration of insulin-receptor kinase activity by high-fat feeding. Diabetes. 1988;37(10):1397–1404. doi: 10.2337/diab.37.10.1397. [DOI] [PubMed] [Google Scholar]
- 30.Kahn BB, Flier JS. Obesity and insulin resistance. J Clin Invest. 2000;106(4):473–481. doi: 10.1172/JCI10842. [DOI] [PMC free article] [PubMed] [Google Scholar]
- 31.Hotamisligil GS. Inflammation and metabolic disorders. Nature. 2006;444(7121):860–867. doi: 10.1038/nature05485. [DOI] [PubMed] [Google Scholar]
- 32.Olefsky JM, Glass CK. Macrophages, inflammation, and insulin resistance. Annu Rev Physiol. 2010;72:219–246. doi: 10.1146/annurev-physiol-021909-135846. [DOI] [PubMed] [Google Scholar]
- 33.Hardy OT, Czech MP, Corvera S. What causes the insulin resistance underlying obesity? Curr Opin Endocrinol Diabetes Obes. 2012;19(2):81–87. doi: 10.1097/MED.0b013e3283514e13. [DOI] [PMC free article] [PubMed] [Google Scholar]
- 34.Manning BD, Cantley LC. AKT/PKB signaling: navigating downstream. Cell. 2007;129(7):1261–1274. doi: 10.1016/j.cell.2007.06.009. [DOI] [PMC free article] [PubMed] [Google Scholar]
- 35.Marin O, Meggio F, Perich JW, Pinna LA. Phosphotyrosine specifies the phosphorylation by protein kinase CK2 of a peptide reproducing the activation loop of the insulin receptor protein tyrosine kinase. Int J Biochem Cell Biol. 1996;28(9):999–1005. doi: 10.1016/1357-2725(96)00049-0. [DOI] [PubMed] [Google Scholar]
- 36.Nishikawa K, Toker A, Johannes FJ, Songyang Z, Cantley LC. Determination of the specific substrate sequence motifs of protein kinase C isozymes. J Biol Chem. 1997;272(2):952–960. doi: 10.1074/jbc.272.2.952. [DOI] [PubMed] [Google Scholar]
- 37.Duarte ML, et al. Protein folding creates structure-based, noncontiguous consensus phosphorylation motifs recognized by kinases. Sci Signal. 2014;7(350): doi: 10.1126/scisignal.2005412. [DOI] [PubMed] [Google Scholar]
- 38.Johnson LN. Substrates of mitotic kinases. Sci Signal. 2011;4(179): doi: 10.1126/scisignal.2002234. [DOI] [PubMed] [Google Scholar]
- 39.Vatner DF, et al. Insulin-independent regulation of hepatic triglyceride synthesis by fatty acids. Proc Natl Acad Sci U S A. 2015;112(4):1143–1148. doi: 10.1073/pnas.1423952112. [DOI] [PMC free article] [PubMed] [Google Scholar]
- 40.Michelotti GA, Machado MV, Diehl AM. NAFLD, NASH and liver cancer. Nat Rev Gastroenterol Hepatol. 2013;10(11):656–665. doi: 10.1038/nrgastro.2013.183. [DOI] [PubMed] [Google Scholar]
- 41.Adams LA, Waters OR, Knuiman MW, Elliott RR, Olynyk JK. NAFLD as a risk factor for the development of diabetes and the metabolic syndrome: an eleven-year follow-up study. Am J Gastroenterol. 2009;104(4):861–867. doi: 10.1038/ajg.2009.67. [DOI] [PubMed] [Google Scholar]
- 42.Dyson JK, Anstee QM, McPherson S. Non-alcoholic fatty liver disease: a practical approach to diagnosis and staging. Frontline Gastroenterol. 2014;5(3):211–218. doi: 10.1136/flgastro-2013-100403. [DOI] [PMC free article] [PubMed] [Google Scholar]
- 43.Plück A, Klasen C. Generation of chimeras by microinjection. Methods Mol Biol. 2009;561:199–217. doi: 10.1007/978-1-60327-019-9_13. [DOI] [PubMed] [Google Scholar]
- 44.Kim JK. Hyperinsulinemic-euglycemic clamp to assess insulin sensitivity in vivo. Methods Mol Biol. 2009;560:221–238. doi: 10.1007/978-1-59745-448-3_15. [DOI] [PubMed] [Google Scholar]
- 45.Ayala JE, et al. Standard operating procedures for describing and performing metabolic tests of glucose homeostasis in mice. Dis Model Mech. 2010;3(9–10):525–534. doi: 10.1242/dmm.006239. [DOI] [PMC free article] [PubMed] [Google Scholar]
- 46.Passonneau JV, Lauderdale VR. A comparison of three methods of glycogen measurement in tissues. Anal Biochem. 1974;60(2):405–412. doi: 10.1016/0003-2697(74)90248-6. [DOI] [PubMed] [Google Scholar]
- 47.Cline GW, Shulman GI. Mass and positional isotopomer analysis of glucose metabolism in periportal and pericentral hepatocytes. J Biol Chem. 1995;270(47):28062–28067. doi: 10.1074/jbc.270.47.28062. [DOI] [PubMed] [Google Scholar]
- 48.Shulman GI, Landau BR. Pathways of glycogen repletion. Physiol Rev. 1992;72(4):1019–1035. doi: 10.1152/physrev.1992.72.4.1019. [DOI] [PubMed] [Google Scholar]
- 49.Youngren JF, Goldfine ID, Pratley RE. Decreased muscle insulin receptor kinase correlates with insulin resistance in normoglycemic Pima Indians. Am J Physiol. 1997;273(2 Pt 1):E276–E283. doi: 10.1152/ajpendo.1997.273.2.E276. [DOI] [PubMed] [Google Scholar]
- 50.Sawyer N, Gassaway BM, Haimovich AD, Isaacs FJ, Rinehart J, Regan L. Designed phosphoprotein recognition in Escherichia coli. ACS Chem Biol. 2014;9(11):2502–2507. doi: 10.1021/cb500658w. [DOI] [PMC free article] [PubMed] [Google Scholar]
- 51.Rappsilber J, Ishihama Y, Mann M. Stop and go extraction tips for matrix-assisted laser desorption/ionization, nanoelectrospray, and LC/MS sample pretreatment in proteomics. Anal Chem. 2003;75(3):663–670. doi: 10.1021/ac026117i. [DOI] [PubMed] [Google Scholar]
- 52.Cox J, Mann M. MaxQuant enables high peptide identification rates, individualized p.p.b.-range mass accuracies and proteome-wide protein quantification. Nat Biotechnol. 2008;26(12):1367–1372. doi: 10.1038/nbt.1511. [DOI] [PubMed] [Google Scholar]
- 53.MacLean B, et al. Skyline: an open source document editor for creating and analyzing targeted proteomics experiments. Bioinformatics. 2010;26(7):966–968. doi: 10.1093/bioinformatics/btq054. [DOI] [PMC free article] [PubMed] [Google Scholar]
- 54.Ramos RR, Swanson AJ, Bass J. Calreticulin and Hsp90 stabilize the human insulin receptor and promote its mobility in the endoplasmic reticulum. Proc Natl Acad Sci U S A. 2007;104(25):10470–10475. doi: 10.1073/pnas.0701114104. [DOI] [PMC free article] [PubMed] [Google Scholar]
- 55.Schmitz-Peiffer C, et al. Alterations in the expression and cellular localization of protein kinase C isozymes epsilon and theta are associated with insulin resistance in skeletal muscle of the high-fat-fed rat. Diabetes. 1997;46(2):169–178. doi: 10.2337/diab.46.2.169. [DOI] [PubMed] [Google Scholar]
- 56.Bligh EG, Dyer WJ. A rapid method of total lipid extraction and purification. Can J Biochem Physiol. 1959;37(8):911–917. doi: 10.1139/o59-099. [DOI] [PubMed] [Google Scholar]
- 57.Yu C, et al. Mechanism by which fatty acids inhibit insulin activation of insulin receptor substrate-1 (IRS-1)-associated phosphatidylinositol 3-kinase activity in muscle. J Biol Chem. 2002;277(52):50230–50236. doi: 10.1074/jbc.M200958200. [DOI] [PubMed] [Google Scholar]
- 58.Pfaffl MW. A new mathematical model for relative quantification in real-time RT-PCR. Nucleic Acids Res. 2001;29(9): doi: 10.1093/nar/29.9.e45. [DOI] [PMC free article] [PubMed] [Google Scholar]
Associated Data
This section collects any data citations, data availability statements, or supplementary materials included in this article.


