Dear Editor
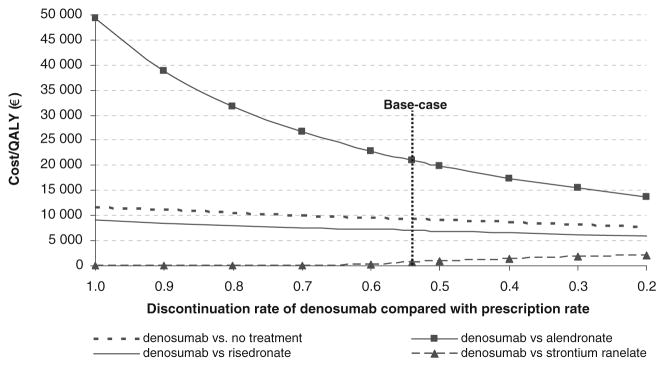
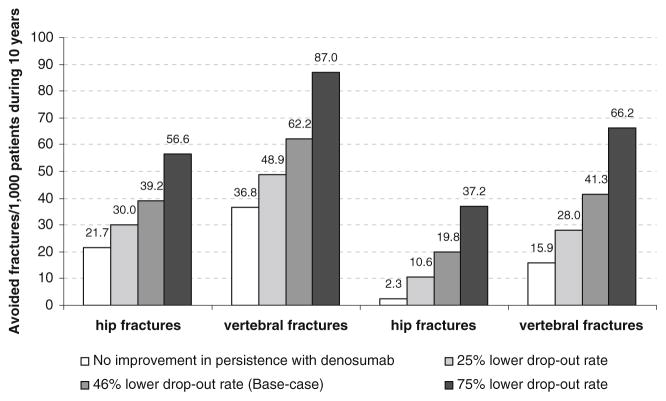
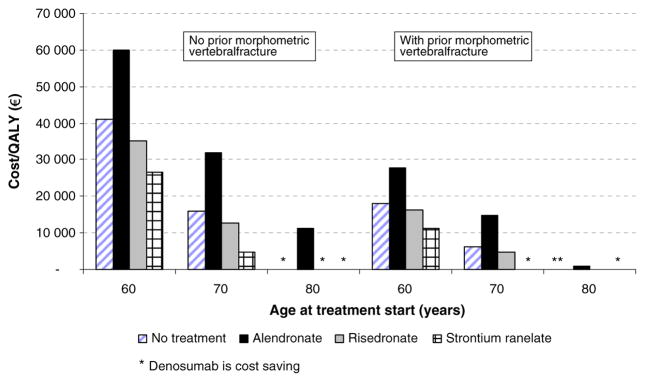
In Jonsson et al. [1], the relative risks (RRs) of fracture in a population with a T-score at or below a given threshold (e.g. ≤2.5 SD) were estimated as the average for all women at or below the threshold. For greater accuracy, the estimate might consider the average RR of fracture in a population with a T-score at or below the threshold and of the same age as the population in the analysed scenario (e.g. 70-year-old women). We have, therefore, revised the estimate of RRs at or below a T-score threshold. RRs of hip, vertebral, wrist and other fractures at model entry were updated from 2.33, 2.66, 1.46, 1.71 to 3.36, 3.19, 1.60 and 1.92, respectively, for the base case scenario. The proportion of 70-year-old women who are below a given BMD threshold will have a lower mean BMD than the corresponding proportion of all women, which increases the estimated RR of fracture. This consequently favours the comparator with the highest antifracture efficacy in each comparison. Note that the RR estimated at a specific T-score is not affected. The re-estimate affects Tables 4 and 5 and Figs. 2, 3, 5, the revised versions of which are shown here. The conclusions of the original manuscript [1] remain unchanged.
Table 4.
Base–case analysis for incremental cost-effectiveness (cost per life year and QALY gained)
| Denosumab vs. no treatment | Denosumab vs. generic alendronate | Denosumab vs. risedronate | Denosumab vs. strontium ranelate | |
|---|---|---|---|---|
| Costs/patient (€) | ||||
| Morbidity cost difference | −2,181 | −1,148 | −1,403 | −1,664 |
| Treatment cost differencea | 1,868 | 1,529 | 1,055 | 939 |
| Cost in added life years | 1,087 | 649 | 745 | 768 |
| Total cost difference | 774 | 1,030 | 397 | 43 |
| Avoided fractures during 10 years/1,000 patients | ||||
| Hip fractures | −39 | −20 | −26 | −32 |
| Vertebral fractures | −62 | −41 | −45 | −43 |
| NNT to avoid one hip fracture | 26 | 50 | 39 | 32 |
| NNT to avoid one vertebral fracture | 17 | 25 | 23 | 24 |
| QALYs and life years/patient | ||||
| Life years gained (undiscounted) | 0.068 | 0.040 | 0.046 | 0.048 |
| Life years gained (discounted) | 0.047 | 0.028 | 0.032 | 0.033 |
| QALYs gained | 0.084 | 0.049 | 0.057 | 0.060 |
| Cost/life year gained | 16,531 | 37,082 | 12,409 | 1,290 |
| Cost per QALY gained (excluding CIALY) | Cost saving | 7,764 | Cost saving | Cost saving |
| Cost per QALY gained | 9,250 | 20,976 | 6,998 | 710 |
Women aged 71 years with a T-score at or below −2.5 SD and 34% prevalence of prior vertebral fracture
NNT number needed to treat
Including monitoring costs
Table 5.
Other sensitivity analyses (€/QALY)
| Scenario | Denosumab vs. no treatment | Denosumab vs. generic alendronate | Denosumab vs. risedronate | Denosumab vs. strontium ranelate |
|---|---|---|---|---|
| Base–casea | 9,250 | 20,976 | 6,998 | 710 |
| Discount rates (5%) | 9,576 | 22,622 | 6,868 | 133 |
| Discount rates (0%) | 9,414 | 19,285 | 7,793 | 2,139 |
| One year DAPS persistence | 10,656 | 28,501 | 8,548 | 214 |
| Perfect persistence for all treatments | 6,902 | 58,449 | 6,817 | Cost saving |
| Denosumab maximum offset time 2 years | 14,157 | 33,103 | 14,254 | 6,278 |
| All treatments maximum offset time 2 years | 14,157 | 27,970 | 11,897 | 5,127 |
| 10-year modelling horizon | 5,484 | 22,422 | 1,454 | Cost saving |
| GIAEsb for alendronate/risedronate | 20,976 | 6,998 | – | |
| Disutility from fractures decreased by 10% | 9,819 | 22,256 | 7,426 | 755 |
| 20% of excess mortality attributable to fractures | 4,886 | 18,231 | 2,267 | Cost saving |
| 10 year treatment duration | 8,758 | 21,455 | 6,457 | Cost saving |
| Mortality after hip and vertebral fractures 3 years | 6,084 | 18,780 | 3,475 | Cost saving |
| Mortality after hip and vertebral fractures 5 years | 8,157 | 20,182 | 5,766 | Cost saving |
The base case assumed discount rates of 3%, improved persistence for 3 years, max offset time of 5 years for all treatments, life-time horizon, no adverse events for any treatment, 5-year maximum treatment duration, 8 years of increased post-fracture mortality after hip and vertebral fractures
Gastrointestinal adverse events
Fig. 2.
Effect of variations in persistence of denosumab on incremental cost-effectiveness of denosumab versus comparators for the base case population
Fig. 3.
Number of avoided fracture/1,000 patients from the base case population according to differences in persistence between denosumab and alendronate
Fig. 5.
The effect of age at start of treatment with or without a prior fracture (T-score at or below −2.5 SD) on the cost-effectiveness of denosumab vs. comparators
Contributor Information
B. Jönsson, Stockholm School of Economics, Box 6501, 11383, Stockholm, SE, Sweden
O. Ström, Geriatrics and Medicine, McMaster University, Main St W, 1280, Hamilton, ON, Canada
J. A. Eisman, Geriatrics and Medicine, McMaster University, Main St W, 1280, Hamilton, ON, Canada
A. Papaioannou, Geriatrics and Medicine, McMaster University, Main St W, 1280, Hamilton, ON, Canada
E. S. Siris, Geriatrics and Medicine, McMaster University, Main St W, 1280, Hamilton, ON, Canada
A. Tosteson, Geriatrics and Medicine, McMaster University, Main St W, 1280, Hamilton, ON, Canada
J. A. Kanis, Geriatrics and Medicine, McMaster University, Main St W, 1280, Hamilton, ON, Canada
References
- 1.Jonsson B, Strom O, Eisman JA, Papaioannou A, Siris ES, Tosteson A, Kanis JA. Cost-effectiveness of denosumab for the treatment of postmenopausal osteoporosis. Osteoporos Int. 2010;22(3):967–982. doi: 10.1007/s00198-010-1424-x. [DOI] [PMC free article] [PubMed] [Google Scholar]


