Abstract
Objectives
Beryllium salts (here, beryllium sulphate) can produce a cytostatic effect in some cell types. The basis for this effect may include increased expression of proliferation inhibitors, reduced expression of proliferation promoters, or both. This study sought to determine the role of p53, the tumour‐suppressing transcription factor, in mediating beryllium‐induced cytostasis.
Materials and methods
Human A172 glioma cells express wild‐type TP53 gene. Activity of p53 was experimentally manipulated using siRNA and related approaches. Key elements of the beryllium‐response were compared in normal and p53‐knockdown A172 cells using RT‐PCR and Western blotting.
Results
In A172 cells, 10 μm BeSO 4 caused 300% increase in CDKN1A (cyclin‐dependent kinase inhibitor p21) mRNA and 90% reduction of CCNE2 (cyclin E2) mRNA. The increased p21 mRNA and reduced cyclin E2 mRNA were each dependent on presence of functional p53. For p21, increased mRNA led to commensurately increased protein levels. In contrast, reduction in cyclin E2 mRNA levels did not lead to corresponding reductions in cyclin E2 protein. The proteasomal inhibitor MG‐132 caused p53 protein to increase, but it had no effect on cyclin E2 protein levels. Cycloheximide time course studies indicated that the cyclin E2 protein half‐life was more than 12 hours in these cells.
Conclusions
Beryllium elicited p53‐dependent changes in mRNA levels of key determinants of cell proliferation such as p21 and cyclin E2. However, cyclin E2 protein appeared to be aberrantly regulated in this cell type, as its turnover was unexpectedly slow.
1. Introduction
When added to mammalian cell culture media, beryllium salt produces a cell cycle arrest in some cell types.1, 2, 3, 4 BeSO4 concentrations in the 10 μm range are effective, even though growth media contains more than 100‐fold molar excess of the competing physiological divalent cations, Mg2+ and Ca2+. After cells are treated with beryllium, there is an increase in the level of the p53 tumour suppressor protein, but it is unknown whether p53 activity is required to produce the Be2+‐induced cytostatic effect. The presence of functional p53 is not sufficient to confer beryllium‐responsiveness, because p53 in human RKO cells can be activated by a variety of DNA‐damaging agents but not by BeSO4 treatment.4 As a transcription factor, p53 coordinates three distinct but partially overlapping physiological states: apoptosis, cellular senescence and the DNA damage response. In cell culture systems, p53 activation is most often achieved by treatment with DNA‐damaging agents. However, Be2+ treatment does not produce DNA damage.4 The state produced by Be2+ treatment resembles senescence, as beryllium‐arrested cells adopt a large flattened morphology and express increased levels of senescence‐associated beta‐galactosidase activity.3
Beryllium causes expression of p21Waf1/Cip1/Sdi1, the cyclin‐dependent kinase inhibitor that is the product of the CDKN1A gene.2, 3, 4 The p21 protein can cause cell cycle arrest by binding to and inhibiting the catalytic activity of various cyclin‐dependent kinases (CDK), including the major cyclin/CDK complexes containing cyclin A, cyclin D or cyclin E.5, 6 Up‐regulated p21 expression is characteristic of cellular senescence, and it also occurs during the DNA damage response.7, 8 The induction of p21 is often driven by the transcriptional activity of p53, especially in DNA damage scenarios.9, 10, 11, 12 However, p21 expression can be elicited by a variety of p53‐independent mechanisms as well.6, 10, 11, 12, 13, 14, 15, 16, 17, 18 In general, p53 is required for p21 induction following DNA damage, but the importance of p53 for p21 induction in other circumstances varies.9, 10, 11, 12 It is unknown whether the p21 expression observed during the senescence‐like response to beryllium is p53 dependent. More generally, it is unknown whether beryllium modulates cell cycle signalling through p53 selectively or whether pleiotropic action in non‐p53 pathways could be driving the response. This study was designed to evaluate the p53 dependence of the response to beryllium salt, one of the few experimental agents capable of inducing a senescence‐like state that is distinct from DNA damage response signalling. A better understanding of cytostatic cell signalling pathways could be helpful in cancer therapy. Traditional chemotherapies act via DNA damage induction to produce a cytotoxic effect. These treatments have serious side effects, and treatment‐provoked mutagenesis can give rise to secondary tumours. A cytostatic, rather than cytotoxic, approach might provide therapeutic benefit with milder side effects; however, cytostasis‐eliciting agents have received relatively little investigation.
Cyclin E forms a complex with CDK2 that is essential for G1/S transition during the cell cycle.19 The binding of p21 to cyclin E‐CDK2 complexes inhibits the kinase activity and thereby blocks S‐phase entry due to hypophosphorylation of Rb.20 Thus, G1/S cell cycle arrest could be achieved via up‐regulation of p21 expression or by down‐regulation of cyclin E expression. During this study, we found that BeSO4 treatment leads to a profound decline in cyclin E2 mRNA. There are two cyclin E isoforms, cyclin E1 and cyclin E2, which are encoded by the CCNE1 and CCNE2 genes, respectively.21, 22, 23 One or both isoforms are frequently overexpressed in a variety of cancer cell types, thereby contributing to misregulated cell proliferation. At least in normal cells, the regulation and biological functions of the two isoforms appear to be quite similar. However, recent studies are beginning to uncover differences in isoform protein stability in cancer cells.24 Using the beryllium‐response system, we observed a clear distinction between regulation of cyclin E1 and cyclin E2 at the mRNA level. The up‐regulation of p21 mRNA and the down‐regulation of cyclin E2 mRNA elicited by BeSO4 were each mediated by p53.
2. Materials and methods
2.1. Cell lines and reagents
A172 (human glioblastoma) cells were from ATCC (Manassas, VA, USA). Cells were grown in RPMI 1640 with Gluta‐MAX and 25 mm HEPES (Invitrogen‐Gibco, Carlsbad, CA, USA) supplemented with 10% FBS (HyClone, Logan, UT, USA) and 1% Antibiotic‐Antimycotic (Invitrogen‐Gibco) at 37°C in a 5% CO2 atmosphere. BeSO4•4H2O used for treating cells was from Fluka (a division of Sigma‐Aldrich, St. Louis, MO, USA). The proteasomal inhibitor MG‐132 and the protein synthesis inhibitor cycloheximide were from Santa Cruz Biotechnology (Santa Cruz, CA, USA).
The A172‐E6 cell line was established by selection of A172 cells transfected with pCMV‐E6 expressing the human papillomavirus 16 E6 gene. A172‐Neo cells are A172 cells transfected with a similar plasmid without E6 (pCMV‐neo) to serve as a transfection control. Both A172‐E6 and A172‐Neo were characterized previously.25 Similar procedures were used to generate U87MG‐E6 and U87MG‐Neo.26
siRNA‐based p53 mRNA knockdown was done by using TP53 Validated Stealth RNAi DuoPak (Invitrogen # 45‐1492), containing chemically modified double‐stranded RNA. Control experiments used Stealth RNAi siRNA Medium GC Negative Control (Invitrogen # 12935‐300), which is not homologous to any known vertebrate transcript. Additional reagents used in the procedure were Lipofectamine 2000 and Opti‐MEM reduced serum medium (Invitrogen). Each of the Stealth RNAi molecules from Stealth RNAiDuoPak (KO 1 and KO 2) were used at a final concentration of 20 nm and Lipofectamine 2000 was used at 0.01 mg/mL. The reagents were diluted from stocks in Opti‐MEM. Each 100‐mm plate received 2.5 mL of the Lipofectamine/oligo mixture for 12 hours. The cells were then trypsinized and reseeded at the required subconfluency prior to treatment with BeSO4. In order to determine the efficiency of siRNA transfection, A172 cells were transfected with BLOCK‐iT™ Fluorescent Oligo (Invitrogen), which is a fluorescein‐labelled dsRNA of similar length, charge and chemical composition as the knockdown oligos employed. Fluorescence microscopy showed that the oligo was delivered with almost 100% efficiency under the transfection conditions employed (Fig. S1).
Small hairpin RNA (shRNA)‐based p53 knockdown was achieved by transducing A172 cells with p53 shRNA (h) Lentiviral Particles (Santa Cruz Biotechnology, # sc‐29435‐V), and transduction control cells were generated by using Control shRNA Lentiviral Particles‐A (Santa Cruz Biotechnology; # sc‐108080). Successfully transfected cells with stably integrated expression vector were selected by growth in RPMI supplemented with puromycin and then isolating single cell clones for expansion.
2.2. Cell count experiment
Initially, 50 000 cells were seeded per 60‐mm plate for each treatment concentration. Every 3 days, the cells were passaged and given a change of media containing BeSO4 at the specified concentration. Cells were trypsinized by adding 0.5 mL of trypsin with EDTA and then resuspended in 2.5 mL of RPMI. A 0.1 mL aliquot of cell suspension was used for cell counts. The remaining cell suspension was used to seed cells into fresh 60‐mm plates at the predetermined split ratio needed to maintain subconfluency. Cell counts were taken using a Beckman Coulter Z1 counter.
2.3. mRNA quantification by RT‐PCR
RNA from treated cells was isolated using RNeasy (Qiagen, Valencia, CA, USA), cDNA was synthesized, and real time‐PCR was performed using QuantiTect SYBR Green PCR reagents and primer pairs from Qiagen. The primer pairs were QT00095431, QT00079247, QT00062090, QT00060235, QT00041986 and QT01012284 for human beta‐actin, human GAPDH, human p21(CDKN1A), human p53, human cyclin E1 and human cyclin E2, respectively. Thermal cycling and data collection were performed on a Bio‐Rad iCycler. The iCycler software was used to calculate the Starting Quantity (SQ) of gene‐specific mRNA in each sample, based on the observed PCR efficiency in standard curves for each gene‐specific primer set. Normalized mRNA values were obtained by dividing the gene‐of‐interest SQ by the actin SQ in the same sample to obtain a ratio, which was then transformed to a log scale for statistical analysis, according to the method described previously.4
2.4. Western blotting
Cells ready for harvest were washed with PBS after RPMI was removed. Cell lysis was performed in plates by addition of 300 μL of M‐PER (Mammalian Protein Extraction Reagent; Pierce, Rockland, IL, USA) supplemented with protease and phosphatase inhibitors. Total protein concentration was determined by using a bicinchoninic acid (BCA) assay (Pierce). Equal amounts of total protein per well were loaded on precast Bis‐Tris Midi Gels, subject to SDS‐PAGE and transferred to a PVDF membrane. Immunoblotting was conducted using anti‐p53 mouse monoclonal (sc‐126, clone DO‐1), anti‐p21 mouse monoclonal (sc‐6246, clone F‐5), anti‐cyclin E1 rabbit polyclonal (sc‐481), anti‐cyclin E2 mouse monoclonal (sc‐28351, clone A‐9) and anti‐actin goat polyclonal (sc‐1615) antibodies from Santa Cruz Biotechnology. The appropriate anti‐mouse, anti‐rabbit or anti‐goat HRP‐conjugated secondary antibodies were used, and blots were developed with ECL Plus (GE Healthcare, Little Chalfont, UK) imaged on a Typhoon Variable Mode Imager set to scan in fluorescence mode with a 457‐nm laser and emission at 520 nm. Some of the blots were developed using the Immun‐Star WesternC Chemiluminescence Kit (Bio‐Rad Laboratories, Hercules, CA, USA), and images were taken using a ChemiDoc XRS+ imager from Bio‐Rad.
2.5. Cell cycle analysis by flow cytometry
The cells were fixed using 70% ethanol, treated with RNase and stained with 50 μg/mL propidium iodide (PI). Cellular DNA content was determined by measuring PI fluorescence intensity using a Becton‐Dickinson FACSCalibur flow cytometer and BD CellQuest Pro Software. Data analysis was done using FlowJo Version 7.6.5 software for cell cycle phase determination.
2.6. Cellular DNA synthesis
Cells were grown in the presence or absence of BeSO4 for a total of 72 hours. After 61 hours in 100‐mm plates, the cells were trypsinized, counted, re‐seeded into 96‐well plates at constant number per well and allowed to re‐attach. At 72 hours, 5‐bromo‐2′‐deoxyuridine (BrdU) label was added and incorporation proceeded for 3.5 hours, and then plates were processed according to the instructions of the BrdU Cell Proliferation Assay (EMD Millipore/CalBiochem, Billerica, MA, USA). Fluorescence was measured using a plate reader set to 340‐nm excitation, 465‐nm emission.
3. Results
3.1. Verification of p53 knockdown
The A172 human glioma cell line possesses wild‐type TP53 and has been previously characterized as being responsive to beryllium salt.4 We wished to examine the response to beryllium by these cells under conditions of diminished p53 activity. Three different strategies were employed to suppress p53 function: transient transfection with anti‐p53 siRNA, stable transfection with anti‐p53 shRNA and stable heterologous expression of HPV E6 protein. By using more than one p53 knockdown strategy, concerns about selectivity (i.e. off‐target effects) could be minimized, thereby improving the overall reliability of the conclusions. Also, knockdown methods do not completely eliminate gene function, so differences can be expected in residual p53 function.
To knock down p53 transcript, two different validated siRNA oligo sequences were used, targeted to human TP53 mRNA (accession number NM_000546.2) at either nucleotides 943‐967 (oligo #1) or 1030‐1054 (oligo #2). The resulting cells are referred to as KO 1 and KO 2, respectively. Cells treated with a non‐targeted negative control siRNA are called KO control. Although transient, siRNA treatment was able to suppress p53 protein levels for at least 48 hours (Fig. 1a). Treatment with 10 μm BeSO4, which is known to increase p53 protein levels in this cell type, produced the expected increase in KO control cells but not in cells with p53 suppression due to KO 1 or KO 2 (Fig. 1a).
Figure 1.
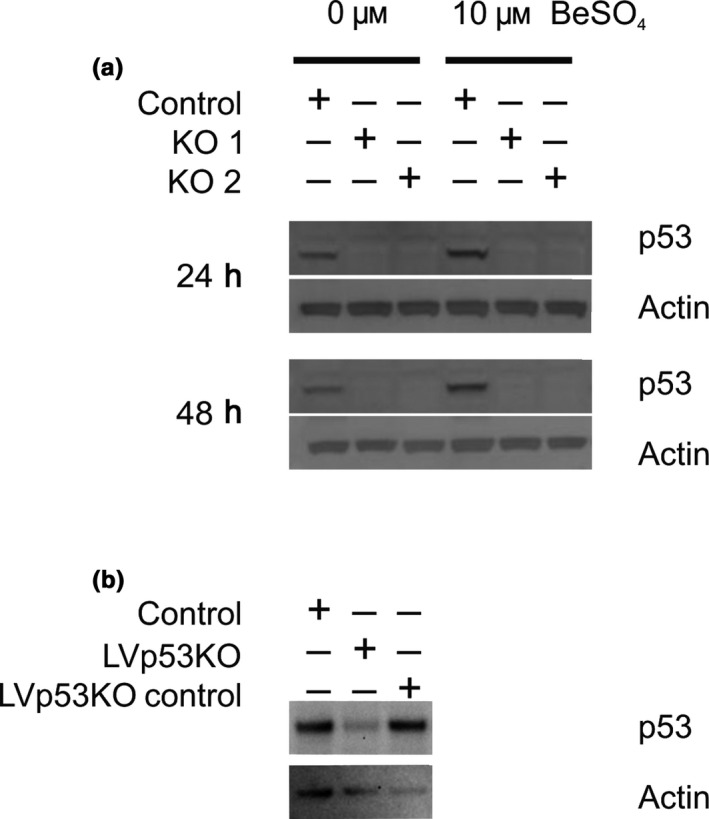
Knockdown of p53 protein expression by siRNA and shRNA. (a) A172 cells were transfected with either of two different siRNA sequences (KO 1 and KO2) directed against p53 mRNA. As a negative control, A172 cells were transfected with an siRNA sequence unrelated to p53. Western blots show levels of p53 and actin proteins after treatment with 0 or 10 μm BeSO 4 for 24 or 48 h. (b) Western blots show constitutive levels of p53 and actin proteins in normal A172 cells (control), A172 cells with a stably integrated anti‐p53 shRNA sequence from lentivirus (LVp53KO), or A172 cells with a stably integrated scrambled shRNA sequence from lentivirus (LVp53KO control)
As a second approach, we established sub‐clones of A172 cells by transducing lentiviral expression constructs encoding shRNA and isolating single cell clones under puromycin selection. The LVp53KO clone contains shRNA directed against p53, and the LVp53KO control clone contains a non‐targeted shRNA that serves as a negative control cell line. Western blotting done on cell lysates of these clones show that LVp53KO has constitutively reduced p53 expression, whereas p53 levels are unaffected for the negative control (Fig. 1b).
A third strategy used expression of E6 protein from human papillomavirus 16 (HPV16). The E6 protein binds to the p53 protein and impairs its function, and it also promotes degradation of p53.27, 28 The lines are labelled as A172 for normal cells, A172 E6 for clonal cells stably expressing the E6 protein, and A172 Neo for a transfection control line that received a neomycin‐resistance plasmid lacking E6. These cell lines have been characterized previously.25
3.2. Functional p53 increases the sensitivity of A172 cells to growth inhibition by beryllium
Beryllium salt inhibited A172 cell proliferation in a dose‐dependent manner (Fig. 2). However, cells with reduced p53 function due to the presence of KO 1, KO 2 or E6 were less sensitive to the growth inhibitory effect of BeSO4 (Fig. 2a,b). The role of p53 was most evident for the 10 μm BeSO4 concentration. Therefore, the time dependency of this effect was examined in more detail at 10 μm BeSO4 concentration using the clonal cell lines created by lentiviral transduction. The LVp53KO cells were able to maintain a logarithmic growth rate over time in the presence of 10 μm BeSO4, whereas the A172 cells that possess fully functional p53 (normal A172 cells and the Lentiviral Control A172 sub‐clone) were unable to maintain growth over time with this treatment (Fig. 2c). The growth inhibitory effect of beryllium was correlated with p53 function in each of the three approaches used to suppress p53, which strongly suggests that the observed p53 dependency was not due to off‐target effects or other potential artefacts. Altogether, these data show that cell growth inhibition by beryllium is p53 dependent.
Figure 2.
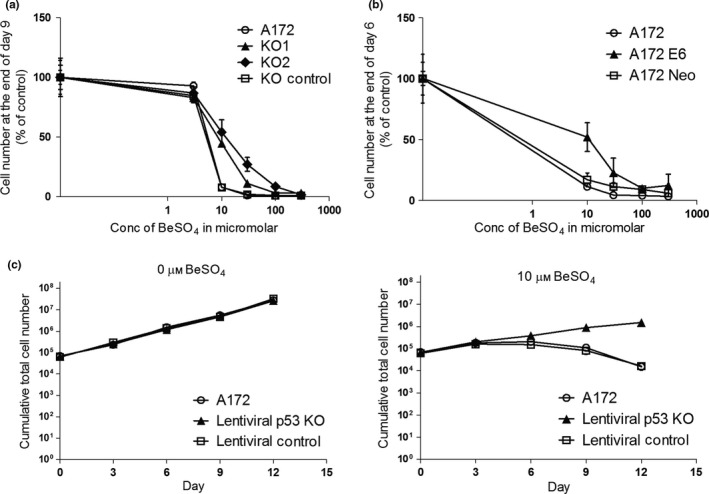
Growth inhibition by beryllium is p53 dependent. (a) A172 cells with or without siRNA‐based p53 knockdown were cultured in 0, 3, 10, 30, 100 or 300 μm BeSO 4 for 9 d, with passage on day 3 and day 6 to maintain sub‐confluency. Cell counts on day 9 are shown as percent of untreated control (mean ± SD). (b) Normal A172 cells, the E6‐transfected A172 cell line and the A172‐Neo transfection control cell line were cultured in 0, 10, 30, 100 or 300 μm BeSO 4 for 6 d, with passage on day 3 to maintain sub‐confluency. Cell counts on day 6 are shown as percent of untreated control (mean ± SD). (c) A172 cells with functional p53 (A172 and Lentiviral control) and a shRNA‐based p53 knockdown cell line (Lentiviral p53 KO) were cultured in RPMI containing 0 μm BeSO 4 (left) or 10 μm BeSO 4 (right) for 12 d. Cumulative cell number (mean ± SD) was determined every 3 d over the 12‐d period
3.3. Beryllium‐induced G1/S‐phase cell cycle arrest and decreased DNA synthesis is p53 dependent
A G1/S cell cycle arrest causes the proportion of cells in the G1‐phase of the cell cycle to increase and the proportion of cells in S‐phase to decrease. Using the E6 system, flow cytometry analysis demonstrated that the G1/S arrest produced by 10 μm BeSO4 is p53 dependent (Fig. 3). Beryllium produced almost no change in the proportion of cells in each phase for cells that had lost p53 function due to E6 overexpression (Fig. 3b). In contrast, both types of p53‐normal cell lines exhibited a clear G1/S cell cycle arrest in response to beryllium (Fig. 3a,c). Flow cytometry histogram plots for this experiment are provided (Fig. S2).
Figure 3.
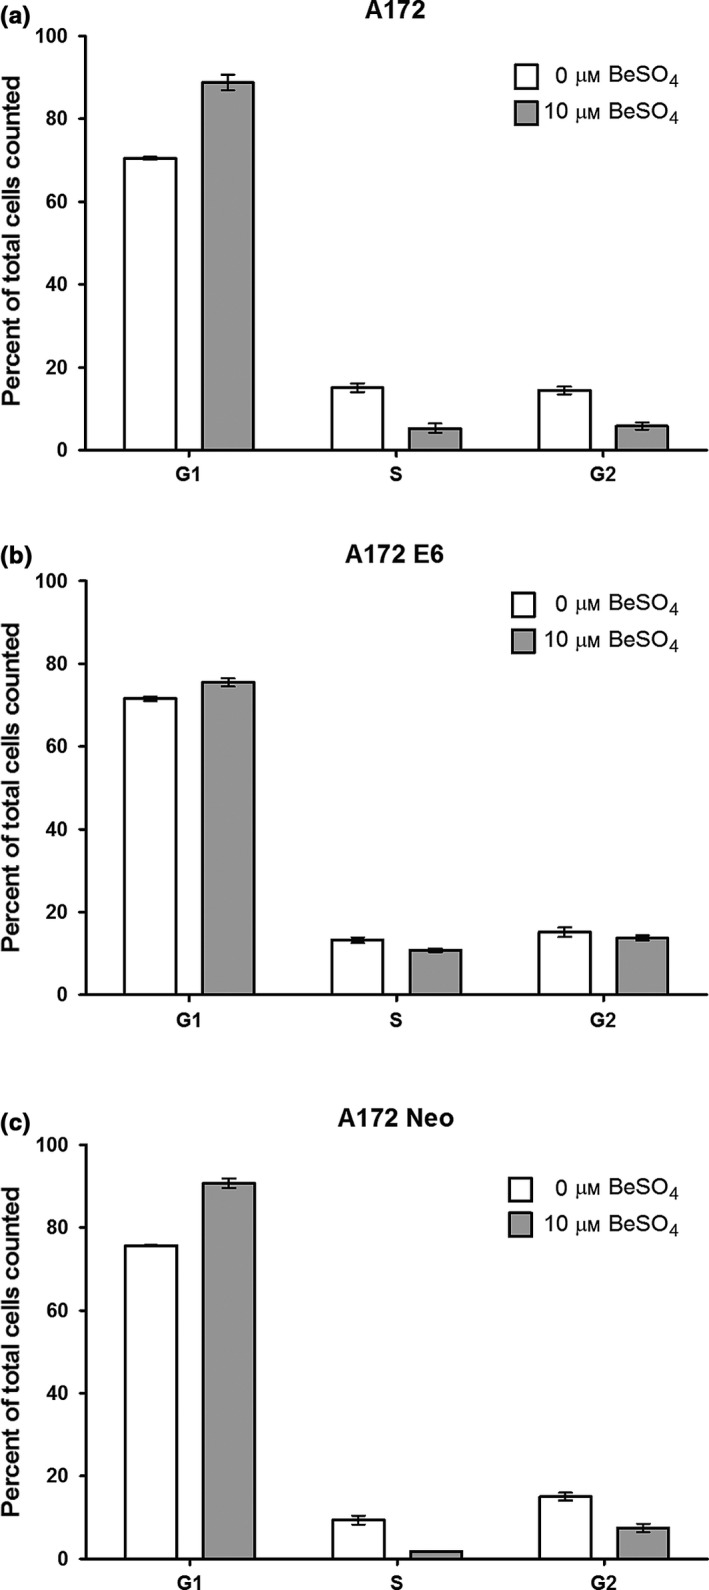
G1/S cell cycle arrest induced by beryllium is p53 dependent. Normal A172 cells (a), E6‐expressing cells (b) or vector‐control cells (c) were cultured in the presence or absence of 10 μm BeSO 4 for 72 h, then stained with propidium iodide and analysed by flow cytometry. DNA content per cell was used to determine cell cycle phase. The percentage of cells (mean ± SD) in each phase is shown
DNA synthesis occurs during S‐phase of the cell cycle. The rate of DNA synthesis can be evaluated by measuring the incorporation of BrdU, a thymidine analogue that can be easily quantified. Beryllium treatment caused a large decrease in DNA synthesis in cells with normal p53 function, but the treatment failed to have much effect when p53 was knocked down (Fig. 4). For example, in normal A172 cells, the rate of DNA synthesis after exposure to 10 μm BeSO4 decreased to 15 ± 2% compared to that of untreated control cells (i.e. 0 μm BeSO4). However, for A172 cells with p53 knocked down by KO1 or KO2 siRNA, the same treatment produced only a small decrease, to 84 ± 5% and 86 ± 5%, respectively.
Figure 4.
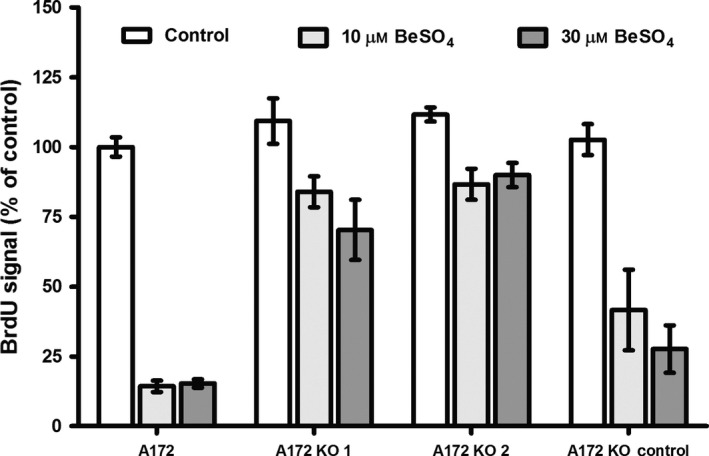
Beryllium‐induced DNA synthesis block requires the presence of functional p53. A172 cells were treated with siRNA to knock down p53 mRNA (KO 1, KO 2) or non‐homologous siRNA (KO control) that served as a control for the siRNA treatment procedure. The cells were cultured with 0, 10 or 30 μm BeSO 4 for 72 h. The incorporation of the thymidine analogue BrdU into newly synthesized DNA was quantified using a fluorogenic histochemical assay to give fluorescence intensity proportional to DNA synthesis. Values are expressed as percent of untreated control (mean ± SD)
3.4. p53 is necessary for the up‐regulation of p21 in response to beryllium
The CDKN1A gene product, p21Waf1/Cip1/Sdi1, is an important cyclin‐dependent kinase inhibitor that regulates cell cycle progression. Induction of p21 is known to occur via both p53‐dependent and p53‐independent mechanisms. To evaluate the role of p53 in the cytostatic response of A712 cells to beryllium treatment, p21 expression was analysed in the p53 knockdown cell systems.
The efficacy of siRNA oligos KO 1 and KO 2 in suppressing p53 protein expression was confirmed in Fig. 1. As expected, KO 1 and KO 2 suppressed p53 mRNA levels as well, to 32% and 34% of control, respectively, as shown by RT‐PCR analysis (Fig. 5a). The p21 mRNA levels were measured in the same samples. For normal A172 cells, 48‐hour exposure to 10 μm BeSO4 caused p21 mRNA levels to increase by about 300% (i.e. to 420% of control), and a similar increase was observed for KO control cells (Fig. 5b). In contrast, beryllium produced only a modest increase in p21 mRNA for the cells that had been treated with KO 1 or KO 2 siRNA to suppress p53. Similar evidence of p53 dependence was also observed for the A172‐E6 cell system (Fig. 5c). The results observed for p21 mRNA were recapitulated when p21 protein levels were examined via Western blotting (Fig. 6). Beryllium‐induced p21 protein expression was robust in normal A172 cells and the various types of A172 control cells, but it was depressed in A172 cells that had impaired p53 function due to E6 expression (Fig. 6a), siRNA transient transfection (Fig. 6b) or shRNA stable transfection (Fig. 6c). Using p21 protein expression as an indicator of p53 knockdown effectiveness, it appeared that each of the three knockdown methods had similar efficacy. With each method, there was some residual p53 activity, but the magnitude of the p53 reduction was sufficient to evaluate p53 dependency in this and subsequent experiments.
Figure 5.
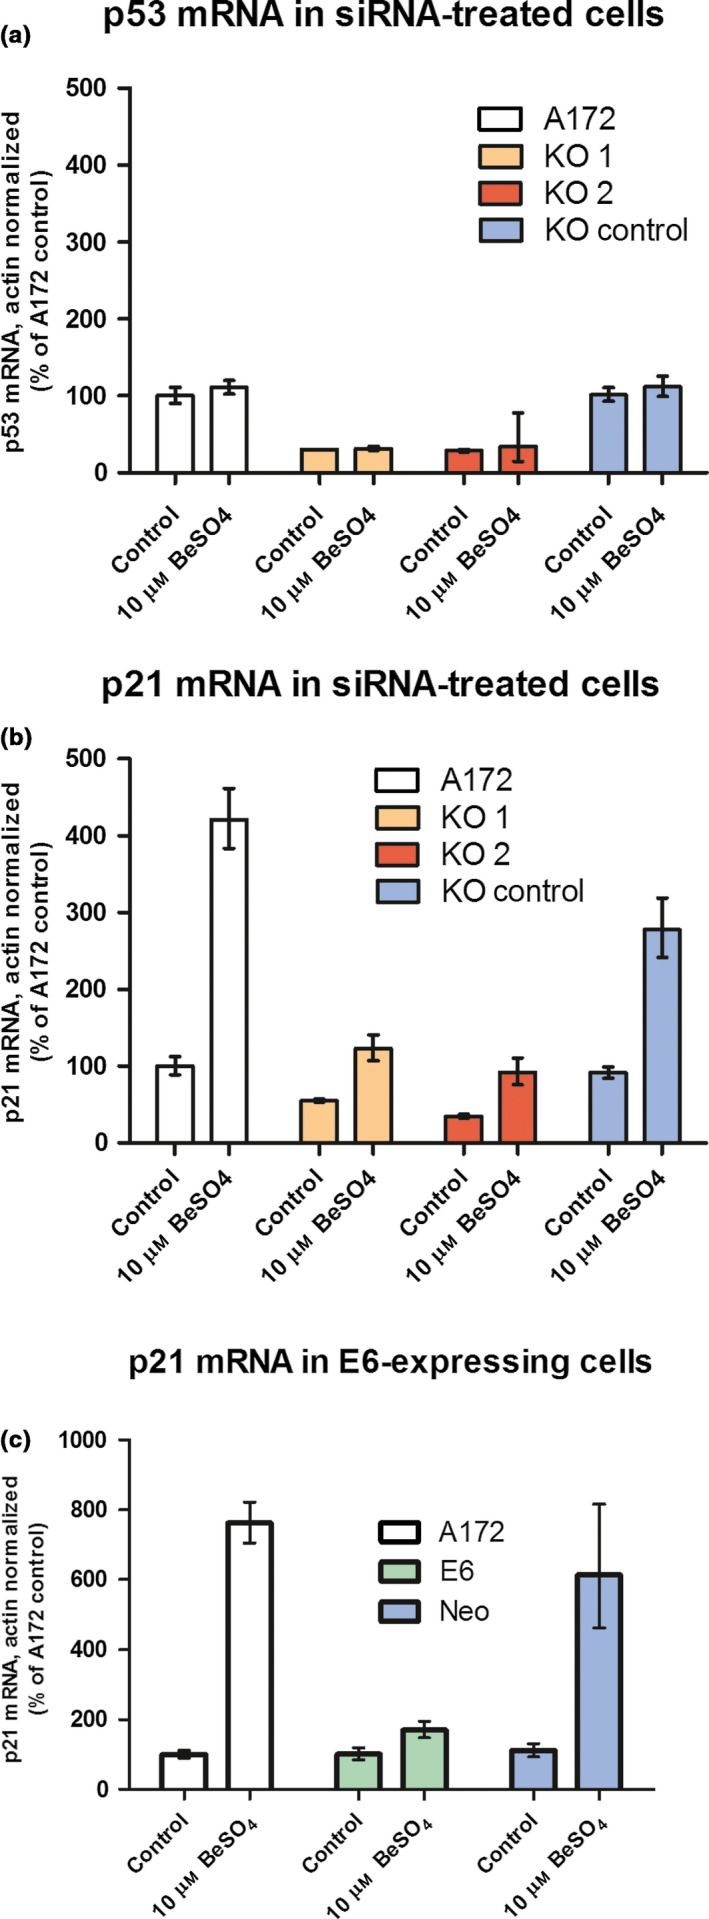
Up‐regulation of p21 mRNA after BeSO 4 treatment is p53 dependent. A172 cells with or without siRNA‐based p53 knockdown were cultured in the presence or absence of 10 μm BeSO 4 for 48 h, and then mRNA levels of p53 (a) or p21 (b) were quantified using RT‐PCR. In each sample, actin mRNA was also quantified and used for normalization. Actin‐normalized mRNA quantities are expressed as percent of untreated control. Error bars bracket a confidence interval that is equivalent to the mean ± SD. Using a similar approach, p21 mRNA at 48 hours was measured in cells that carry a p53‐suppressing E6 expression vector or a neomycin control vector (c).
Figure 6.
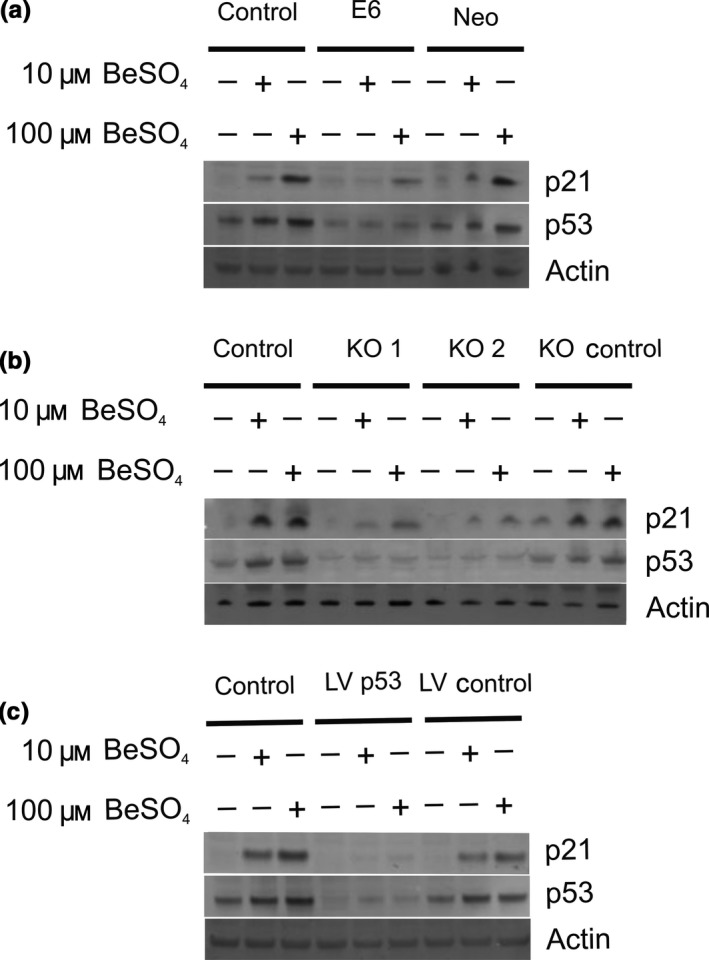
Up‐regulation of p21 protein after BeSO 4 treatment is p53 dependent. (a) Untransfected control A172 cells, an E6‐transfected A172 sub‐clone with suppressed p53, or a Neomycin vector A172 sub‐clone were grown in 0, 10 or 100 μm BeSO 4 for 48 h and protein expression was analysed by Western blotting. Actin served as a loading control. (b) Untreated control A172 cells, cells treated with anti‐p53 siRNA KO 1 or KO 2, or cells treated with the non‐targeted KO control siRNA sequence were grown in 0, 10 or 100 μm BeSO 4 for 48 h and analysed by Western blotting. (c) Protein expression at 48 hours was analysed in untransfected control A172 cells, a lentivirus‐infected A172 sub‐clone expressing anti‐p53 shRNA, or a lentivirus‐infected A172 sub‐clone expressing a negative control sequence shRNA
The U87MG cell line is another human glioma type that also possesses a wild‐type TP53 gene. Beryllium salt is able to elicit a cytostatic response in this cell type (our unpublished data). Therefore, we used this cell type to see whether the observations with A172 cells may be reproducible with another cell type. Beryllium treatment of U87MG cells and their E6 and Neo derivatives demonstrated that cell growth inhibition, as assessed by cell counting, and p21 induction, as assessed by Western blotting, were p53 dependent in U87MG cells (Fig. S3).
3.5. Beryllium induces a p53‐dependent decrease in cyclin E2 mRNA
The cell cycle block at the G1/S transition (Figs 3 and 4) could be caused by the presence of a cell cycle inhibitor, such as p21, or it could be caused by the absence of a cell cycle effector. Cyclin E is the cyclin that most directly effects the G1/S transition. In human cells, there are two cyclin E isoforms, cyclin E1 and cyclin E2. In our preliminary microarray studies, cyclin E2 was one of the mRNA species that was most dramatically and consistently decreased in human cells following beryllium treatment (our unpublished data). Therefore, we decided to study cyclin E2 in more detail.
As judged by RT‐PCR, beryllium produced a large p53‐dependent decrease in cyclin E2 mRNA levels in A172 cells (Fig. 7). In contrast, the same samples showed no changes in the mRNA abundance of GAPDH, a housekeeping gene that is involved in glycolysis and whose expression level is not expected to be affected by cell cycle regulators or cytostatic agents. For normal A172 cells, addition of 10 μm BeSO4 for 48 hours caused CCNE2 mRNA to decrease by 84% (to 16% of control) in one experiment (Fig. 7a) and by 91% (to 9% of control) in another experiment (Fig. 7c). Similar decreases were observed for the A172 KO control cells and the A172 Neo‐control cells. However, the effect of beryllium on CCNE2 mRNA was much smaller when p53 function had been knocked down by siRNA (Fig. 7a) or by E6 expression (Fig. 7c), showing that p53 function is required for this aspect of the beryllium cytostatic response.
Figure 7.
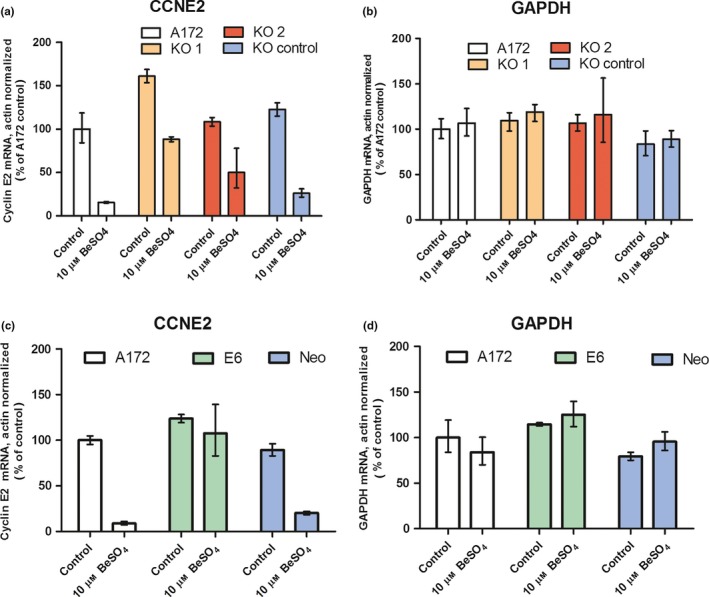
Beryllium decreases cyclin E2 mRNA in cells with functional p53. Untreated A172 cells, cells treated with anti‐p53 siRNA KO 1 or KO 2, or cells treated with the non‐targeted KO control siRNA sequence were grown in 0 or 10 μm BeSO 4 for 48 hours and mRNA levels of cyclin E2 (CCNE2) and the housekeeping genes actin and GAPDH were measured in each sample using quantitative RT‐PCR. Actin‐normalized mRNA quantities, expressed as percent of untreated control, are shown for CCNE2 (a) and for GAPDH (b). Untransfected A172 cells, E6‐transfected A172 cells with suppressed p53 or Neomycin vector A172 cells were grown in 0 or 10 μm BeSO 4 for 48 h, and actin‐normalized mRNA levels are reported for CCNE2 (c) and for GAPDH (d). Error bars bracket a confidence interval that is equivalent to the mean ± SD
Surprisingly, cyclin E2 protein levels in A172 cells were unaffected by beryllium treatment (Fig. 8). Thus, cyclin E2 protein levels did not correlate with the changes in CCNE2 mRNA levels described earlier (Fig. 7). In Western blots, the amount of cyclin E2 protein was invariant regardless of whether p53 function was intact or knocked down, and cyclin E2 protein was unchanged regardless of whether the cells were grown in 0, 10 or 100 μm BeSO4 (Fig. 8). In these experiments, the effect of the experimental treatments on p53 and p21 protein levels was similar to that seen in earlier experiments (compare to Fig. 6). As with A172 cells, the cyclin E2 protein content of U87MG cells was unaffected by p53 activity or beryllium exposure (Fig. S3).
Figure 8.
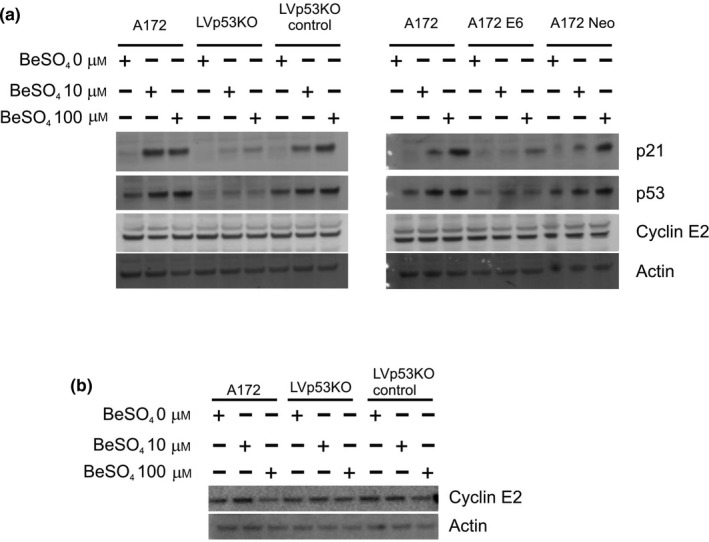
The abundance of cyclin E2 protein does not correlate with its mRNA expression. (a) A172 cells with p53 knockdown via lentivirally introduced shRNA (LVp53KO) or E6‐expression (A172 E6), or their respective control cell types, were grown in 0, 10 or 100 μm BeSO 4 for 48 h and analysed by Western blotting. (b) The lentiviral knockdown cells and controls were grown in 0, 10 or 100 μm BeSO 4 for 96 h and analysed by Western blotting.
Considering the striking effect of beryllium treatment on cyclin E2 mRNA, it was of interest to determine whether cyclin E1 expression might also be affected by this treatment. Exposure of A172 cells to 10 μm BeSO4 did indeed cause a decrease in cellular CCNE1 mRNA levels; however, the magnitude of the effect was not nearly as large as for CCNE2 (Fig. S4). It is unclear whether the change in CCNE1 was p53 dependent; experiments with the E6 system suggested that there was p53 dependence, but parallel experiments using siRNA to knock down p53 failed to demonstrate p53 dependence (Fig. S4). An attempt was made to examine cyclin E1 protein levels in A172 cells, but this was inconclusive due to low levels of expression of cyclin E1 protein in this cell type (Fig. S5). It is not too surprising that cyclin E2 but not E1 could be analysed in the glioma cells, as it has previously been reported that cyclin E2 is highly expressed in human brain tissue.22, 23
3.6. Slow turnover of cyclin E2 protein accounts for its failure to correlate with mRNA levels
We found that beryllium treatment caused a dramatic decline in cyclin E2 mRNA (Fig. 7), but little or no change in cyclin E2 protein level (Fig. 8). This behaviour would be compatible with a protein that possesses a long half‐life, but not with one that experiences rapid turnover within the cell. To examine this question more directly, A172 cells were treated with MG‐132, an inhibitor of proteasomal degradation (Fig. 9a,b). For a short‐lived protein that undergoes rapid degradation in the proteasome, it is expected that MG‐132 treatment would lead to protein accumulation. This was indeed the case for p53 protein (Fig. 9b), which is known to have a short half‐life. One might expect that the polyubiquitylated form of the protein would accumulate predominantly, but MG‐132 causes depletion of free ubiquitin due to inhibition of ubiquitin recycling, and therefore the drug effects are apparent for the 53 kD form of the p53 protein. In contrast to p53, cyclin E2 protein levels were essentially unaffected by MG‐132 treatment over a 6‐hour treatment duration (Fig. 9a,b). This suggests that cyclin E2 does not undergo rapid proteasome‐mediated degradation in A172 cells.
Figure 9.
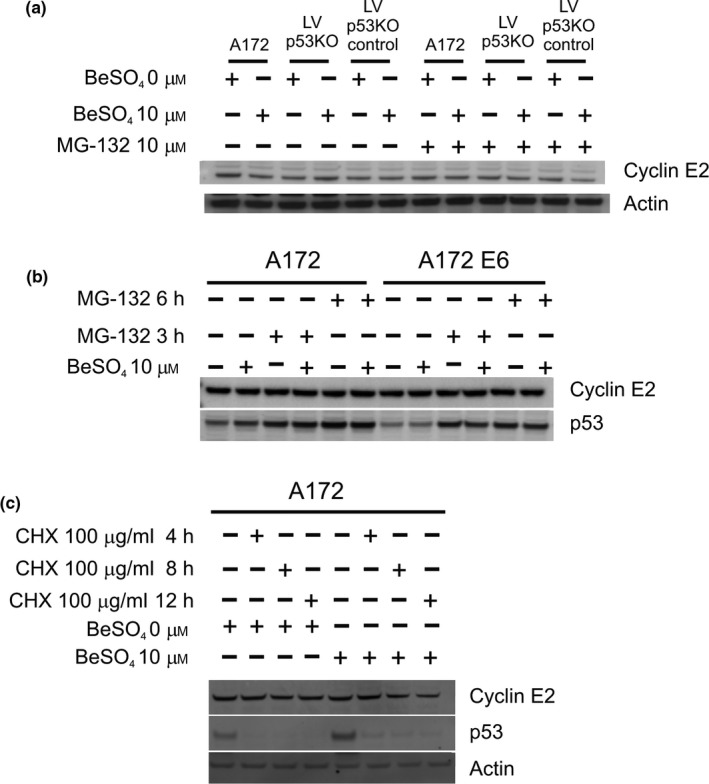
Slow turnover of cyclin E2 protein accounts for its failure to correlate with mRNA levels. (a) The lentiviral p53 knockdown cells (LVp53KO) and control cell lines were grown in RPMI media containing 0 or 10 μm BeSO 4 for 2 d, then either 0 or 10 μm MG‐132 (a proteasome inhibitor) was added for 6 h, and lysates were analysed by Western blotting. (b) A172 or A172‐E6 cells were grown in 0 or 10 μm BeSO 4 for 2 d and 10 μm MG‐132 for 0, 3 or 6 h, and analysed by Western blotting. (c) Normal A172 cells were grown in RPMI media containing 0 or 10 μm BeSO 4 for 2 d, followed by fresh media containing 100 μg/mL cycloheximide (a protein synthesis inhibitor) for 0, 4, 8 or 12 h, and lysates were analysed by Western blotting
Cycloheximide is a protein synthesis inhibitor. After new protein synthesis is blocked with cycloheximide, existing specific protein pools will decline in proportion to their rates of degradation. The p53 protein was virtually eliminated from A172 cells after only 4 hours of cycloheximide treatment (Fig. 9c), showing that it is rapidly degraded. In contrast, cyclin E2 persisted in these cells even after 12 hours of cycloheximide treatment (Fig. 9c). After 12 hours, more than half of the cyclin E2 protein remained intact in the untreated cells, but less than half remained in the set of cells that had been treated with 10 μM BeSO4; altogether, these experiments suggest a half‐life of about 12 hours or more for the cyclin E2 protein in A172 cells. The MG‐132 results and the cycloheximide results each indicate that cyclin E2 protein is hyperstable in the A172 cell type. This hyperstability is probably caused by a defect in the ubiquitin ligase pathway that targets cyclin E2 for degradation, because ubiquitin ligase pathways are often mutated in various cancers. For any hyperstable protein, decreases in mRNA abundance are not expected to have much effect on protein abundance, which explains the initially puzzling discrepancy between mRNA and protein levels for this protein. Whether the synthesis of new cyclin E2 protein is suppressed by mRNA depletion or halted by cycloheximide treatment, in either case, the pre‐existing pool of cyclin E2 protein persists long enough so that changes in cyclin E2 seen in Western blotting experiments are minimal.
4. Discussion
Beryllium is a potentially toxic element that must be handled with care. It is capable of triggering immune system hypersensitivities, and exposure to solid forms via inhalation is especially hazardous to humans and animals. This study utilizes beryllium as a soluble salt at low concentration, to examine the unusual molecular effects of this reagent under conditions in which more generalized toxicity appears to be minimal. At 10 μm, BeSO4 produces a senescence‐like cell cycle arrest in A172 glioma cells, but it has no effect on RKO colon carcinoma cells.4 The lack of effect on RKO cells suggests that generalized toxicity at this concentration is negligible. Therefore, this study focused on 10 μm as the key reference concentration for every experiment, although higher concentrations were also examined in many of the assays. The A172 cell type was chosen because 10 μm BeSO4 elicits a strong cytostatic response that has been thoroughly characterized.4
This study, in combination with earlier work, indicates that functional p53 is necessary but not sufficient to confer responsiveness to beryllium. The elicitation of the cytostatic state required p53 (Figs 2, 3, 4), but the presence of functional p53 does not necessarily ensure that a given cell type will be responsive to beryllium.4 Up‐regulation of CDKN1A and down‐regulation of CCNE2 were two of the molecular events associated with the p53‐dependent cytostatic response. During this response, there was a clear requirement for p53 function in the regulation of mRNA levels for each of these two cell cycle regulatory genes (Figs 5 and 7). The increase in CDKN1A mRNA produced an increase in p21 protein; however, the decrease in CCNE2 mRNA failed to produce much change in cyclin E2 protein (Figs 6 and 8). In many cell types, there is a correlation between mRNA and protein levels for cyclin E2,21, 22, 29, 30 but such a correlation was not evident in the A172 cells. Recently, a similar phenomenon was reported in MCF‐7 human breast cancer cells. In MCF‐7, combination therapy with a PI‐3‐kinase inhibitor and a selective oestrogen receptor modulator caused a large decrease in CCNE2 mRNA but very little change in cyclin E2 protein abundance.31
All of the important features of the beryllium‐induced cytostatic response that were examined in this study required the presence of functional p53 protein. Often, p53 protein accumulation and increased p53 transcriptional activity are triggered by the DNA damage response. However, beryllium treatment does not cause DNA damage, and the Be2+‐response appears to be distinct from DNA damage signalling.4 How then does beryllium treatment lead to p53 activation? BeSO4 has been shown to inhibit GSK‐3β in treated cells,32 and inhibition of GSK‐3β kinase activity has been associated with p53 activation in some systems.33, 34, 35, 36 GSK‐3β has an important role in a variety of cell signalling pathways, including the insulin response and the Wnt/β‐catenin pathway.37, 38 The functions of GSK‐3β and the details of its integration within interconnected signalling pathways vary among different cell types. This may help to explain why some cell types are much more sensitive to beryllium salt than others. For example, A172 cells and RKO cells are equally capable of initiating a p53‐dependent DNA damage response, but BeSO4 treatment does not inhibit proliferation of RKO cells.4 It may be that the signalling connections between GSK‐3β and p53 are structured differently in these two cell types. The transcriptional activity of p53 is fine‐tuned by post‐translational modifications and by association with various p53‐binding proteins. Therefore, in Be2+‐responsive cells such as A172, different subsets of downstream events may arise depending on whether p53 activation is initiated through DNA damage or through BeSO4 treatment.
Cyclin E1 and E2 appear to be largely redundant in many respects, but this study suggests that cells that rely predominantly on cyclin E2 may be more favourably positioned to respond to p53‐mediated cytostatic signals. Our results reinforce other studies that have hinted at a possible role for p53 in regulating cyclin E2 expression. In a microarray study of p53‐mediated transcriptional repression, CCNE2 was identified as one of the 111 genes that were down‐regulated at least 2‐fold after p53 overexpression in PC3 human prostate cancer cells.39 In normal human fibroblasts, overexpression of the HPV E6 oncoprotein to suppress p53 activity leads to increased cyclin E2 mRNA and protein.22 This study helps to solidify the connection between p53 activation and transcriptional mechanisms that suppress cyclin E2. Beryllium treatment elicited a massive p53‐dependent decrease in cyclin E2 mRNA as measured by RT‐PCR (Fig. 7). However, in the A172 model system, this decrease did not lead to a corresponding decrease in cyclin E2 protein (Fig. 8). There are many well‐known examples in which the quantity of a particular protein is governed mainly by post‐translational modifications rather than changes in transcript abundance. The p53 protein is one such example: in normal untreated A172 cells, 10 μm BeSO4 caused a large increase in p53 protein (Figs 1a, 6, 8a, and 9c) but no change in p53 mRNA (Fig. 5a). However, recent investigations suggest that discordance between specific mRNA and protein levels may be more common than previously appreciated, especially within cancer cells. The Clinical Proteomic Tumour Analysis Consortium (CPTAC) recently completed global proteomics analyses on a set of 95 tumour samples whose mRNA expression had previously been quantified through The Cancer Genome Atlas (TCGA) project. The central finding from this study, which the authors described as the largest protein‐transcript relationship analysis ever conducted, was summarized as “Messenger RNA transcript abundance did not reliably predict protein abundance differences between tumours”.40
It is interesting that the cyclin E2 protein was long‐lived in A172 glioblastoma cells (Fig. 9). Using cycloheximide to block protein synthesis, we estimated the half‐life of cyclin E2 protein to be about 12 hours or more in A172 cells. Using a similar approach, the cyclin E2 protein half‐life in Saos‐2 human osteosarcoma and HEK‐293T human kidney cells was estimated to be about 1.5 hours.41 Both cyclin E1 and cyclin E2 are targeted for degradation in the proteasome via the SCFFbw7 ubiquitin ligase complex.22, 41, 42 Fbw7 is very frequently mutated in a variety of human cancers,43, 44 leading to overexpression of oncogenic Fbw7 targets such as cyclin E proteins. Recent work using the T‐47D human breast cancer line suggests that the determinants of cyclin E1 vs E2 stability are more complex than first thought. In T‐47D cells, cyclin E2 expression was cell cycle dependent but persisted later into S‐phase than cyclin E1, and Fbw7 appeared to regulate the stability of cyclin E1 to a greater extent than cyclin E2.45 Except for the present study, it does not appear that cyclin E2 protein stability has been studied in glioma cells, but cyclin E2 appeared to be hyperstable in A172 (Figs 8 and 9) and U87MG (Fig. S3) glioma lines, suggesting that mechanisms for cyclin E2 protein turnover may be characteristically impaired in these types of tumours. Although there is potential for GSK‐3β inhibitors to interfere with Fbw7 function,19, 43 this would not explain the failure of MG‐132 and cycloheximide treatments to affect cyclin E2 protein levels in A172 cells that were not exposed to beryllium (Fig. 9).
A model for beryllium‐induced cell cycle arrest in A172 cells can be proposed. The primary event after BeSO4 treatment may be GSK‐3β inhibition,32 which in turn leads to up‐regulation and activation of p53.33, 34, 35, 36 The activity of p53 causes increased transcription of CDKN1A directly, p21 protein levels increase, and sustained cell cycle arrest ensues due to the inhibition of cyclin E‐CDK2 and other cyclin‐CDK complexes by p21. The increased activity of p53 also causes cyclin E2 mRNA levels to decline, perhaps via microRNA‐mediated degradation of the CCNE2 message. MicroRNAs such as miR‐26a, miR‐30b, miR‐30d, miR‐34a, miR‐144, miR‐200 and miR‐449 have been shown to target CCNE2.29, 30, 46, 47, 48, 49, 50, 51 In normal cells and in many cancer cell types, the drop in CCNE2 mRNA would lead to decreased cyclin E2 protein abundance that further deters cell cycle progression. This dual mechanism for suppressing the G1/S cell cycle transition is illustrated (Fig. 10). However, in A172 glioma cells and some other cancer cell types, abnormal cyclin E2 protein hyperstability causes a disconnect between mRNA and protein levels, thwarting one of the two cell cycle arrest mechanisms elicited during the cytostatic response.
Figure 10.
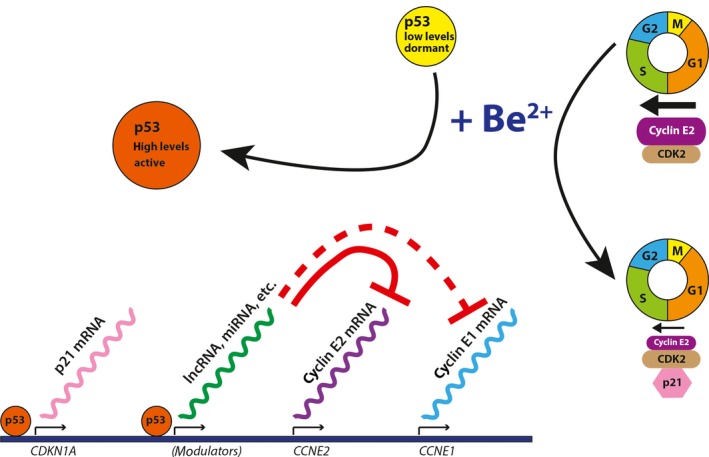
Dual mechanism for p53‐dependent suppression of G1/S cell cycle transition. Beryllium treatment causes activation of p53 (orange circle). It is hypothesized that p53 mediates transcription of p21 and gene expression modulators that include microRNAs (miRNA) or long non‐coding RNAs (lncRNA). These expression modulators cause a decrease in the levels of cyclin E2 mRNA (solid red line) but have little or no effect on cyclin E1 mRNA (dashed red line). Increased p21 protein (pink hexagon) and diminished cyclin E2 protein (purple oval) are two consequences that deter G1/S transition. Tumour cells with defects in cyclin E2 protein degradation pathways tend to maintain cyclin E2 protein levels despite modulation of the corresponding mRNA
Supporting information
Acknowledgements
This work was supported by the NIH grant P20 RR‐016464, ARO grant W911NF‐15‐1‐0216, and a UNLV Faculty Opportunity Award.
References
- 1. Skilleter DN, Price RJ, Legg RF. Specific G1‐S phase cell cycle block by beryllium as demonstrated by cytofluorometric analysis. Biochem J. 1983;216:773–776. [DOI] [PMC free article] [PubMed] [Google Scholar]
- 2. Lehnert NM, Gary RK, Marrone BL, Lehnert BE. Inhibition of normal human lung fibroblast growth by beryllium. Toxicology. 2001;160:119–127. [DOI] [PubMed] [Google Scholar]
- 3. Coates SS, Lehnert BE, Sharma S, Kindell SM, Gary RK. Beryllium induces premature senescence in human fibroblasts. J Pharmacol Exp Ther. 2007;322:70–79. [DOI] [PubMed] [Google Scholar]
- 4. Gorjala P, Gary RK. Beryllium sulfate induces p21 CDKN1A expression and a senescence‐like cell cycle arrest in susceptible cancer cell types. Biometals. 2010;23:1061–1073. [DOI] [PMC free article] [PubMed] [Google Scholar]
- 5. Xiong Y, Hannon GJ, Zhang H, Casso D, Kobayashi R, Beach D. P21 is a universal inhibitor of cyclin kinases. Nature. 1993;366:701–704. [DOI] [PubMed] [Google Scholar]
- 6. Karimian A, Ahmadi Y, Yousefi B. Multiple functions of p21 in cell cycle, apoptosis and transcriptional regulation after DNA damage. DNA Repair. 2016;42:63–71. [DOI] [PubMed] [Google Scholar]
- 7. Di Leonardo A, Linke SP, Clarkin K, Wahl GM. DNA damage triggers a prolonged p53‐dependent G1 arrest and long‐term induction of Cip1 in normal human fibroblasts. Genes Dev. 1994;8:2540–2551. [DOI] [PubMed] [Google Scholar]
- 8. Chang BD, Xuan Y, Broude EV, et al. Role of p53 and p21waf1/cip1 in senescence‐like terminal proliferation arrest induced in human tumor cells by chemotherapeutic drugs. Oncogene. 1999;18:4808–4818. [DOI] [PubMed] [Google Scholar]
- 9. El‐Deiry WS, Harper JW, O'Connor PM, et al. WAF1/CIP1 is induced in p53‐mediated G1 arrest and apoptosis. Cancer Res. 1994;54:1169–1174. [PubMed] [Google Scholar]
- 10. Michieli P, Chedid M, Lin D, Pierce JH, Mercer WE, Givol D. Induction of WAF1/CIP1 by a p53‐independent pathway. Cancer Res. 1994;54:3391–3395. [PubMed] [Google Scholar]
- 11. Macleod KF, Sherry N, Hannon G, et al. p53‐dependent and independent expression of p21 during cell growth, differentiation, and DNA damage. Genes Dev. 1995;9:935–944. [DOI] [PubMed] [Google Scholar]
- 12. Gartel AL, Tyner AL. Transcriptional regulation of the p21(WAF1/CIP1) gene. Exp Cell Res. 1999;246:280–289. [DOI] [PubMed] [Google Scholar]
- 13. Datto MB, Li Y, Panus JF, Howe DJ, Xiong Y, Wang XF. Transforming growth factor beta induces the cyclin‐dependent kinase inhibitor p21 through a p53‐independent mechanism. Proc Natl Acad Sci USA. 1995;92:5545–5549. [DOI] [PMC free article] [PubMed] [Google Scholar]
- 14. Alpan RS, Pardee AB. p21WAF1/CIP1/SDI1 is elevated through a p53‐independent pathway by mimosine. Cell Growth Differ. 1996;7:893–901. [PubMed] [Google Scholar]
- 15. Javelaud D, Wietzerbin J, Delattre O, Besançon F. Induction of p21Waf1/Cip1 by TNFalpha requires NF‐kappaB activity and antagonizes apoptosis in Ewing tumor cells. Oncogene. 2000;19:61–68. [DOI] [PubMed] [Google Scholar]
- 16. Roninson IB. Oncogenic functions of tumour suppressor p21(Waf1/Cip1/Sdi1): association with cell senescence and tumour‐promoting activities of stromal fibroblasts. Cancer Lett. 2002;179:1–14. [DOI] [PubMed] [Google Scholar]
- 17. Lafarga V, Cuadrado A, Lopez de Silanes I, Bengoechea R, Fernandez‐Capetillo O, Nebreda AR. p38 Mitogen‐activated protein kinase‐ and HuR‐dependent stabilization of p21(Cip1) mRNA mediates the G(1)/S checkpoint. Mol Cell Biol. 2009;29:4341–4351. [DOI] [PMC free article] [PubMed] [Google Scholar]
- 18. Macdonald FH, Yao D, Quinn JA, Greenhalgh DA. PTEN ablation in Ras(Ha)/Fos skin carcinogenesis invokes p53‐dependent p21 to delay conversion while p53‐independent p21 limits progression via cyclin D1/E2 inhibition. Oncogene. 2014;33:4132–4143. [DOI] [PubMed] [Google Scholar]
- 19. Siu KT, Rosner MR, Minella AC. An integrated view of cyclin E function and regulation. Cell Cycle. 2012;11:57–64. [DOI] [PMC free article] [PubMed] [Google Scholar]
- 20. Sherr CJ, Roberts JM. CDK inhibitors: positive and negative regulators of G1‐phase progression. Genes Dev. 1999;13:1501–1512. [DOI] [PubMed] [Google Scholar]
- 21. Lauper N, Beck AR, Cariou S, et al. Cyclin E2: a novel CDK2 partner in the late G1 and S phases of the mammalian cell cycle. Oncogene. 1998;17:2637–2643. [DOI] [PubMed] [Google Scholar]
- 22. Zariwala M, Liu J, Xiong Y. Cyclin E2, a novel human G1 cyclin and activating partner of CDK2 and CDK3, is induced by viral oncoproteins. Oncogene. 1998;17:2787–2798. [DOI] [PubMed] [Google Scholar]
- 23. Gudas JM, Payton M, Thukral S, et al. Cyclin E2, a novel G1 cyclin that binds Cdk2 and is aberrantly expressed in human cancers. Mol Cell Biol. 1999;19:612–622. [DOI] [PMC free article] [PubMed] [Google Scholar]
- 24. Geng Y, Sicinski P. Differences in regulation and function of E‐cyclins in human cancer cells. Cell Cycle. 2013;12:1165. [DOI] [PMC free article] [PubMed] [Google Scholar]
- 25. Xu GW, Mymryk JS, Cairncross JG. Inactivation of p53 sensitizes astrocytic glioma cells to BCNU and temozolomide, but not cisplatin. J Neurooncol. 2005;74:141–149. [DOI] [PubMed] [Google Scholar]
- 26. Xu GW, Nutt CL, Zlatescu MC, Keeney M, Chin‐Yee I, Cairncross JG. Inactivation of p53 sensitizes U87MG glioma cells to 1,3‐bis(2‐chloroethyl)‐1‐nitrosourea. Cancer Res. 2001;61:4155–4159. [PubMed] [Google Scholar]
- 27. Scheffner M, Werness BA, Huibregtse JM, Levine AJ, Howley PM. The E6 oncoprotein encoded by human papillomavirus types 16 and 18 promotes the degradation of p53. Cell. 1990;63:1129–1136. [DOI] [PubMed] [Google Scholar]
- 28. Thomas M, Pim D, Banks L. The role of the E6‐p53 interaction in the molecular pathogenesis of HPV. Oncogene. 1999;18:7690–7700. [DOI] [PubMed] [Google Scholar]
- 29. Bommer GT, Gerin I, Feng Y, et al. p53‐mediated activation of miRNA34 candidate tumor‐suppressor genes. Curr Biol. 2007;17:1298–1307. [DOI] [PubMed] [Google Scholar]
- 30. He L, He X, Lim LP, et al. A microRNA component of the p53 tumour suppressor network. Nature. 2007;447:1130–1134. [DOI] [PMC free article] [PubMed] [Google Scholar]
- 31. Peek GW, Tollefsbol TO. Combinatorial PX‐866 and raloxifene decrease Rb phosphorylation, cyclin E2 transcription, and proliferation of MCF‐7 breast cancer cells. J Cell Biochem. 2016;117:1688–1696. [DOI] [PMC free article] [PubMed] [Google Scholar]
- 32. Mudireddy SR, Abdul AR, Gorjala P, Gary RK. Beryllium is an inhibitor of cellular GSK‐3β that is 1,000‐fold more potent than lithium. Biometals. 2014;27:1203–1216. [DOI] [PubMed] [Google Scholar]
- 33. Mao CD, Hoang P, DiCorleto PE. Lithium inhibits cell cycle progression and induces stabilization of p53 in bovine aortic endothelial cells. J Biol Chem. 2001;276:26180–26188. [DOI] [PubMed] [Google Scholar]
- 34. Kulikov R, Boehme KA, Blattner C. Glycogen synthase kinase 3‐dependent phosphorylation of Mdm2 regulates p53 abundance. Mol Cell Biol. 2005;25:7170–7180. [DOI] [PMC free article] [PubMed] [Google Scholar]
- 35. Yao D, Alexander CL, Quinn JA, Chan WC, Wu H, Greenhalgh DA. Fos cooperation with PTEN loss elicits keratoacanthoma not carcinoma, owing to p53/p21 WAF‐induced differentiation triggered by GSK3beta inactivation and reduced AKT activity. J Cell Sci. 2008;121:1758–1769. [DOI] [PubMed] [Google Scholar]
- 36. Boehme KA, Kulikov R, Blattner C. p53 stabilization in response to DNA damage requires Akt/PKB and DNA‐PK. Proc Natl Acad Sci USA. 2008;105:7785–7790. [DOI] [PMC free article] [PubMed] [Google Scholar]
- 37. Frame S, Cohen P. GSK3 takes centre stage more than 20 years after its discovery. Biochem J. 2001;359:1–16. [DOI] [PMC free article] [PubMed] [Google Scholar]
- 38. Doble BW, Woodgett JR. GSK‐3: tricks of the trade for a multi‐tasking kinase. J Cell Sci. 2003;116:1175–1186. [DOI] [PMC free article] [PubMed] [Google Scholar]
- 39. Spurgers KB, Gold DL, Coombes KR, et al. Identification of cell cycle regulatory genes as principal targets of p53‐mediated transcriptional repression. J Biol Chem. 2006;281:25134–25142. [DOI] [PubMed] [Google Scholar]
- 40. Zhang B, Wang J, Wang X, et al. Proteogenomic characterization of human colon and rectal cancer. Nature. 2014;513:382–387. [DOI] [PMC free article] [PubMed] [Google Scholar]
- 41. Klotz K, Cepeda D, Tan Y, Sun D, Sangfelt O, Spruck C. SCF(Fbxw7/hCdc4) targets cyclin E2 for ubiquitin‐dependent proteolysis. Exp Cell Res. 2009;315:1832–1839. [DOI] [PubMed] [Google Scholar]
- 42. Ye X, Nalepa G, Welcker M, et al. Recognition of phosphodegron motifs in human cyclin E by the SCFFbw7 ubiquitin ligase. J Biol Chem. 2004;279:50110–50119. [DOI] [PubMed] [Google Scholar]
- 43. Davis RJ, Welcker M, Clurman BE. Tumor suppression by the Fbw7 ubiquitin ligase: mechanisms and opportunities. Cancer Cell. 2014;26:455–464. [DOI] [PMC free article] [PubMed] [Google Scholar]
- 44. Xu W, Taranets L, Popov N. Regulating Fbw7 on the road to cancer. Semin Cancer Biol. 2016;36:62–70. [DOI] [PubMed] [Google Scholar]
- 45. Caldon CE, Sergio CM, Sutherland RL, Musgrove EA. Differences in degradation lead to asynchronous expression of cyclin E1 and cyclin E2 in cancer cells. Cell Cycle. 2013;12:596–605. [DOI] [PMC free article] [PubMed] [Google Scholar]
- 46. Bou Kheir T, Futoma‐Kazmierczak E, Jacobsen A, et al. miR‐449 inhibits cell proliferation and is down‐regulated in gastric cancer. Mol Cancer. 2011;10:29. [DOI] [PMC free article] [PubMed] [Google Scholar]
- 47. Cai J, Liu X, Cheng J, et al. MicroRNA‐200 is commonly repressed in conjunctival MALT lymphoma, and targets cyclin E2. Graefes Arch Clin Exp Ophthalmol. 2012;250:523–531. [DOI] [PubMed] [Google Scholar]
- 48. Ichikawa T, Sato F, Terasawa K, et al. Trastuzumab produces therapeutic actions by upregulating miR‐26a and miR‐30b in breast cancer cells. PLoS ONE. 2012;7:e31422. [DOI] [PMC free article] [PubMed] [Google Scholar]
- 49. Deng J, He M, Chen L, Chen C, Zheng J, Cai Z. The loss of miR‐26a‐mediated post‐transcriptional regulation of cyclin E2 in pancreatic cancer cell proliferation and decreased patient survival. PLoS ONE. 2013;8:e76450. [DOI] [PMC free article] [PubMed] [Google Scholar]
- 50. Chen D, Guo W, Qiu Z, et al. MicroRNA‐30d‐5p inhibits tumour cell proliferation and motility by directly targeting CCNE2 in non‐small cell lung cancer. Cancer Lett. 2015;362:208–217. [DOI] [PubMed] [Google Scholar]
- 51. Matsushita R, Seki N, Chiyomaru T, et al. Tumour‐suppressive microRNA‐144‐5p directly targets CCNE1/2 as potential prognostic markers in bladder cancer. Br J Cancer. 2015;113:282–289. [DOI] [PMC free article] [PubMed] [Google Scholar]
Associated Data
This section collects any data citations, data availability statements, or supplementary materials included in this article.
Supplementary Materials


