Abstract
Efficient assembly of HIV-1 at the plasma membrane (PM) of the T-cell specifically requires PI(4,5)P2. It was previously shown that a highly basic region (HBR) of the matrix protein (MA) on the Gag precursor polyprotein Pr55Gag is required for membrane association. MA is N-terminally myristoylated, which enhances its affinity to membranes. In this work we used X-ray scattering and neutron reflectivity to determine how the physical properties and structure of lipid bilayers respond to the addition of binding domain peptides, either in the myristoylated form (MA31myr) or without the myristoyl group (MA31). Neutron reflectivity measurements showed the peptides predominantly located in the hydrocarbon interior. Diffuse X-ray scattering showed differences in membrane properties upon addition of peptides and the direction of the changes depended on lipid composition. The PI(4,5)P2-containing bilayers softened, thinned and became less ordered as peptide concentration increased. In contrast, POPS-containing bilayers with equivalent net charge first stiffened, thickened and became more ordered with increasing peptide concentration. As softening the host cell’s PM upon contact with the protein lowers the free energy for membrane restructuring, thereby potentially facilitating budding of viral particles, our results suggest that the role of PI(4,5)P2 in viral assembly goes beyond specific stereochemical membrane binding. These studies reinforce the importance of lipids in virology.
Keywords: Bending modulus, area/lipid, bilayer thickness, X-ray diffuse scattering, Sxray order parameter, neutron reflectivity
Graphical abstract
1. Introduction
Retroviral particle production occurs at the infected cell’s plasma membrane (PM) where the virus acquires its lipid envelope [1]. Viral production is a complex, multistep process mediated by the viral structural protein Gag [2]. Human immunodeficiency virus (HIV-1) Gag is synthesized as a precursor polyprotein, Pr55Gag, which, upon viral release, is cleaved into four major domains: N-terminal matrix (MA), capsid (CA), nucleocapsid (NC) and P6 [3]. MA protein binds Gag to the plasma membrane (PM), CA forms a Gag dimerization interface, NC promotes multimerization of Gag through binding to RNA, and P6 recruits the ESCRT cellular protein complexes (endosomal-sorting complex required for transport) that are required for viral release [2]. Both MA and NC are highly basic proteins, and can thus potentially bind to acidic membranes and nucleic acids in the cell. Small-angle neutron scattering suggested that in full-length Gag, the MA and NC domains are closely juxtaposed in solution, resulting in a compact, folded-over protein [4]; this was confirmed using single molecule-Förster resonance energy transfer [5]. In the absence of nucleic acid, a similar conformation of Gag was observed by neutron reflectivity on negatively charged membranes, but upon increasing nucleic acid concentration, the Gag protein assumed the elongated shape that persists in the immature virus [6]. Whereas it is established that the nucleocapsid (NC) domain of Gag specifically recognizes motifs in the viral RNA genome for packaging [7, 8], there is compelling evidence that the matrix (MA) domain also binds to cellular RNA [9-11].
Membrane binding of HIV-1 Gag depends on a conserved highly basic region (HBR) between amino acids 19 and 31 [12, 13] in the 131 amino acid MA protein as well as on the myristoyl moiety at MA’s N-terminus. In solution the myristate moiety is sequestered within the MA globular domain, but a conformational switch exposes it, enhancing membrane binding [14]. The HBR contributes to the conformational switch by interacting with acidic phospholipids on the inner leaflet of the PM [12, 14]. Myristoylation occurs co-translationally, where the 14-carbon saturated fatty acid, myristic acid, is attached to the N-terminal glycine that is exposed after the first methionine is removed. Mutating the N-terminal glycine to alanine reduces membrane binding and inhibits virus release [15, 16]. Mutating the 2nd to 5th residues after glycine also reduces membrane binding and virus particle production, indicating that these residues are required for N-myristoyltransferase recognition [16-18]. Thin section electron microscopy has more recently shown that the G2A mutation causes roughly spherical particles to assemble within the cytoplasm [19].
Targeting of Gag to the PM occurs by interaction between the MA HBR and phosphatidylinositol (4,5) – bisphosphate (PI(4,5)P2) or PIP2), which is concentrated primarily on the cytoplasmic leaflet of the PM. Mutant studies demonstrated that PM PIP2 is required for efficient HIV-1 viral release [20], and for avoiding misdirection of nascent virions to endosomal compartments [21]. Additional mutant studies revealed that amino acids K17, K29 and K31 are involved in PIP2 binding, while K25 and K26 inhibit PIP2-independent membrane binding of Gag [9]. In a mutant containing the myristoyl group but lacking the HBR, production of viral particles was decreased by 10-fold, and those that formed near the plasma membrane did not contain Envelope proteins (Env) [22]. The requirement for the tetra-anionic PIP2 instead of the mono-anionic negatively charged PS has been intensively investigated. Liposomal studies showed that binding to PC/PS is significantly higher in the presence of small amounts of PIP2, suggesting a specific interaction [23]. Other experimental approaches have been used to demonstrate specific binding of HIV-1 Gag to PIP2 [24-26]. Solution nuclear magnetic resonance (NMR) revealed the structure of myristoylated MA bound to water-soluble PIP2 with truncated (C4 or C8) chains [25]. These studies showed that MA-PIP2 binding promotes myristoyl switching and suggested that the sn-2 acyl chain of PIP2 is inserted into a hydrophobic cleft in MA, with the inositol group packed against the HBR of MA. More recently, the same group has re-examined their previous study, using native PIP2 acyl chains (5%) in DHPC/DMPC bicelles, and found that the PIP2 sn-2 acyl chain does not dissociate from the membrane to bind into a cleft in the MA protein [27].
A recent SPR study examined the role of lipids in membrane binding of the myristoylated and non-myristoylated forms of MA [28] and reported that myristoylation increases MA affinity to PC/PS membranes by factors up to ~20 depending on membrane charge. Cholesterol in PC/PS membranes increased MA affinity only mildly, while it increased it much more in PIP2-containing PC/PS membranes, in particular for the myristoylated protein. This suggests yet another additive effect of MA protein binding, between the myristoyl group and PIP2 [28]. Therefore, membrane binding is a sensitive assay of the contributions of different lipids to the MA protein/membrane interaction; however, binding is only one part of the picture.
In the present work, we quantify interactions between the HIV-1 Gag MA membrane binding interface with lipid bilayers and use X-ray diffuse scattering to study the effect of binding on membrane bending rigidity, chain order, area/lipid and bilayer thickness. In order to focus on the membrane binding domain, we investigate the N-terminal 31 AA residues of MA that include the myristoylation site (G2) and the HBR (AAs 20-32). Numbering begins with G2, since the N-terminal methionine (M1) is removed during protein synthesis. The model peptide, henceforth called MA31myr, includes the main membrane interaction sites, myristoyl and the HBR, of the full-length MA protein. For contrast we also study MA31 without the myristoyl group. These peptides are reductionist proxies to explore the molecular interactions between the membrane binding interface and bilayers with different lipid headgroups. We quantify how bilayers respond to such interactions with MA31myr and MA31, and reveal significant differences between peptide interactions with PIP2 and PS-containing membranes. Importantly, the observed differences in physical response make PIP2-containing bilayers more susceptible to membrane reorganization than bilayers devoid of PIP2, and thereby facilitate viral budding.
2. Materials and Methods
2.1. Lipids and peptides
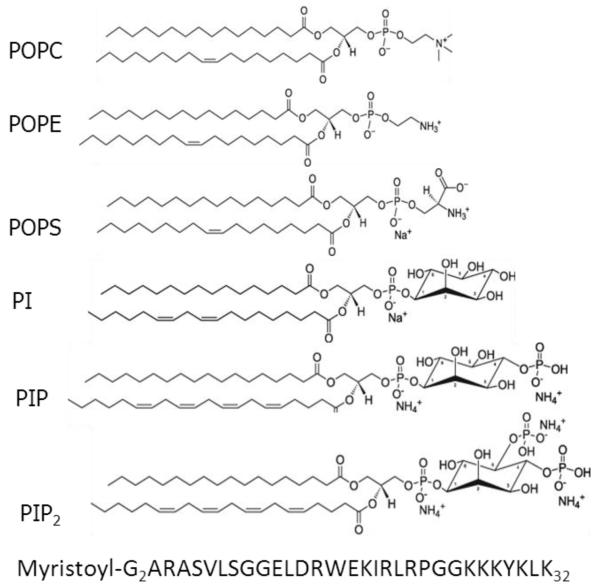
Synthesized, lyophilized lipids were purchased from Avanti Polar Lipids (Alabaster, AL) and used as received, and HPLC grade organic solvents were purchased from Sigma/Aldrich. Lipid structures are shown in Fig. 1. Membrane mimics were prepared by first dissolving lyophilized lipids in chloroform (POPC) or hexafluoroisopropanol HIP (POPS, POPE, inositol lipids) and then mixing these stock solutions to create the lipid mole ratio compositions: POPC/POPS (92:8, 60:40), POPC/PIP2 (98:2, 95:5, 90:10, 80:20), POPC/POPE (50:50), POPC/POPE/POPS (46:46:8), POPC/POPE/PIP2 (49:49:2, 50:30:20), POPC/POPE/PI (50:30:20), POPC/POPE/PIP (50:30:20), POPC/POPE/POPS/Chol (31:31:8:30), POPC/POPE/PIP2/Chol (34:34:2:30) and POPC mixtures with PI or PIP (95:5, 90:10, 80:20). Myristoylated-MA31 (MA31myr) and MA31 (see Fig. 1 for structure) were purchased from the Peptide synthesis Facility (University of Pittsburgh, Pittsburgh, PA); mass spectroscopy indicated >95% purity. These matrix peptides correspond to amino acid residues 1-31 of the 131 residues in the MA protein [29]. MA31myr was dissolved in HIP to form mole fractions in lipids between 0.002 and 0.020. The molecular weight of MA31 (4289) and MA31myr (4499) included 7 trifluoroacetate counterions from the peptide synthesis. Solvents were removed by evaporation in the fume hood, followed by 2 h in a vacuum chamber at room temperature. In this work, lipid mixtures will be represented by mole ratios, while peptide/lipid mixtures will be represented by mole fractions. Sample preparations will be represented by mg/ml.
Figure 1.
Structures of lipids used in this work (from Avanti Polar Lipids WEBsite). Lipid names: POPC, palmitoyloleoylphosphatidylcholine; POPE, palmitoyloleoylphosphatidylethanolamine; POPS, palmitoyloleoylphosphatidylserine; PI, phosphatidylinositol (soy); PIP, phosphatidylinositol-4-phosphate (porcine brain); phosphatidylinositol-4,5-bisphosphate (porcine brain). The primary structure of MA31myr is shown. Counterions are shown for the charged lipids.
2.2.1. Samples for X-ray scattering
4 mg of dried lipid/peptide mixture was re-dissolved in 200 μl HIP, or chloroform:HIP (4:1 or 1:1, vol:vol) ratios for most of the lipid compositions. These mixtures were plated onto silicon wafers (15 × 30 × 1 mm) via the rock and roll method [30] to produce stacks of ~1800 well-aligned bilayers; solvents were removed by evaporation in the fume hood, followed by 2 h under vacuum at room temperature. Samples were prehydrated in polypropylene hydration chambers at 37 °C for 1-6 h directly before hydration in a thick-walled X-ray hydration chamber [31] for 0.5-1 h.
2.2.2. Samples for neutron reflectivity
10 mg lipid mixtures, POPC/POPS (60:40) or POPC/PIP2 (90:10), were prepared as in 2.1. MA31 or MA31myr was dissolved in HIP and added to the lipid mixtures in mole fractions: 0.01, 0.0125 and 0.01667. Organic solvent was removed by evaporation in the fume hood and then under vacuum for 12 hours. Samples were stored at −20°C until shortly before the neutron reflectivity measurements. Dried peptide/lipid films were rehydrated in a 1 M NaCl aqueous solution to a final concentration of 5-6 mg/ml and bath sonicated for 60-90 minutes until the vesicular suspension became transparent. Self-assembled monolayers (SAMs) of HC18 tethers were formed on 3” diameter silicon wafers as previously described [32]. Sparsely-tethered bilayer lipid membranes (stBLMs) were formed by exposing the SAM to the vesicle suspension for 60 minutes in a NIST reflectivity flow cell, followed by a rinse with 40 ml deionized water [28].
2.2.3. Samples for densimetry
Multilamellar vesicles (MLVs) were prepared by mixing dried lipid/peptide mixtures with MilliQ water to a final concentration of 5-100 mg/ml in nalgene vials and cycled three times between −20 °C and 50 °C for 10 min at each temperature with intermittent vortexing [33]. Pure MA31 and MA31myr were dissolved in MilliQ water at 1-5 mg/ml and vortexed to dissolve.
2.3.1. X-ray scattering. LAXS
Oriented stacks of membrane mimics, ~1800 layers, were hydrated through the vapor phase. Low-angle X-ray scattering from these samples at 37 °C were obtained at the Cornell High Energy Synchrotron Source (CHESS) using previously described methods [34, 35] using X-ray wavelengths 1.187, 1.177 and 1.108 Å on three separate CHESS trips, and sample-to-detector S-distances 377, 373 and 387 cm at the G1 station. The analysis of diffuse LAXS from oriented stacks of fluctuating fluid bilayers has been previously described [31]. Form factors ∣F(qz)∣ and bending moduli KC were obtained as previously described [34, 36, 37]. When peptides are added, KC is an effective bending modulus that accounts for traditional bending of a homogeneous bilayer, ignoring a tilt mode and any local disordering effect of the peptides on the height-height pair correlation functions [38].
2.3.2. WAXS
Wide-angle X-ray scattering data from the same samples as for LAXS were obtained at a fixed angle of 0.5°, background collected at −0.5° was subtracted, and these data were analyzed to obtain the Sxray order parameter as described in Ref. [39]. S-distances for WAXS were 145, 142 and 163 cm.
2.4. Neutron reflectivity
NR measurements were performed at the NGD-MAGIK reflectometer [40] at the NIST Center for Neutron Research over a momentum transfer range 0-0.25 Å−1. Three bulk contrasts were used: D2O, H2O and a 2:1 mixture by volume of D2O and H2O (CM4). 6 hour scans at 37°C were performed for each solvent contrast. The 1D-structural profile along the lipid bilayer normal was modeled using a composition-space model as described in Ref. [41].
2.5. Densimetry
Volumes of peptides in water and in MLVs were determined at 37 ± 0.01 °C using an Anton-Paar USA DMA5000M (Ashland, VA) vibrating tube densimeter [42].
3. Results
3.1. Low-angle X-ray scattering (LAXS)
3.1.1. Intensity data
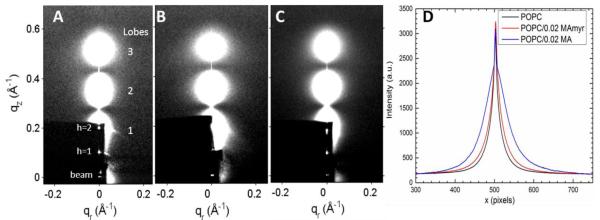
Synchrotron LAXS data are shown in Fig. 2A, B, C for POPC, POPC/0.02 MA and POPC/0.02 MAmyr, respectively. The lobes of diffuse scattering result from fluctuational disorder that occurs spontaneously in fully hydrated, oriented bilayers. Analysis of the weak arcs emanating from the diffuse, white lobes [43] indicates a small mosaic spread (i.e., an excellent bilayer alignment) with mosaic spread <1 degree. Although visual comparison shows only small differences between the lobes of diffuse scattering data in Fig. 2A, B and C, when their intensities in the qr direction are plotted (Fig. 2D), one sees that POPC is the most narrow, POPC/MA31myr slightly wider, while POPC/MA31 has the largest width. The widths of the intensity lobes are one indication that POPC/MA31 causes the greatest softening of the POPC membrane, which is quantified by determining the bending modulus, KC (see 3.1.2).
Figure 2.
2D CCD images of hydrated LAXS intensity (white is most intense) at 37°C where z is the direction of the membrane normal and r is the in-plane direction. (A) POPC, (B) POPC/0.02MA31, and (C) POPC/0.02MA31myr. Lamellar D-spacings corresponding to these images are 62.6 Å, 67.3 Å and 74 Å for A, B and C, respectively. Diffuse scattering lobes (1–3) are identified with large numbers. The dark rectangle in the lower left corner is due to molybdenum sheets that attenuate the beam and the h = 1, 2 lamellar diffraction peaks. (D) X-ray intensity vs. lateral x pixels collected with a broad, horizontal slice through lobes 2 and 3.
3.1.2. Bending moduli
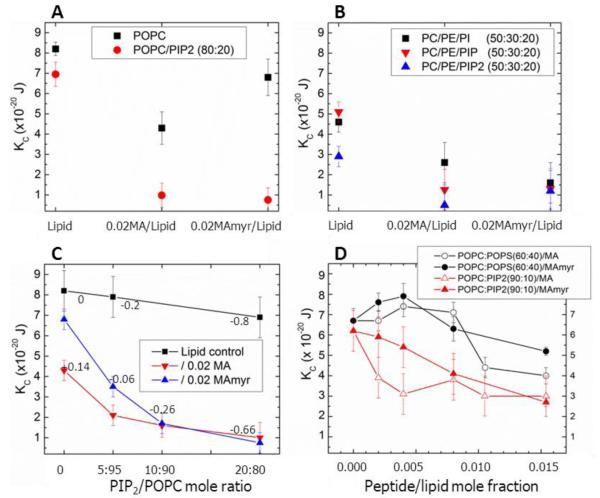
Larger fluctuations indicate lower resistance of the membrane to bending, resulting in a lower effective bending modulus, KC. KC results for the three samples shown in Fig. 2 appear as the black solid squares in Fig. 3A. This quantitative data analysis [34] confirms greater fluctuations (52% smaller KC) in the POPC sample containing 0.02 of the non-myristoylated MA31, while KC for 0.02 MA31myr/POPC was only slightly smaller compared to peptide-free POPC. When either peptide at 0.02 mole ratio was mixed with POPC/PIP2 (80:20), Fig. 3A shows that KC decreased much more from the control POPC/PIP2 value than the decrease when the peptides were added to POPC. This indicates that the interaction of the peptides with the membrane is greatly enhanced by the electrostatic interaction between the positively charged peptides and the negatively charged membrane.
Figure 3.
Bending modulus, KC, as a function of lipid and peptide concentration. (A) 0.02 MA31 or MA31myr in POPC, in POPC/PIP2 (80:20), (B) 0.02 MA31 and MA31myr in POPC/POPE/PI (50:30:20), in POPC/POPE/PIP (50:30:20), in POPC/POPE/PIP2 (50:30:20), (C) 0.02 MA31 or MA31myr in POPC with increasing PIP2, (D) Increasing MA31 or MA31myr in POPC/pOpS (60:40) or POPC/PIP2 (90:10). Numbers in Figs. 3C indicate the net membrane charge/lipid plus protein. Lipid control indicates samples with no peptides. Error bars represent standard deviations of the average KC values from 2-5 different samples.
In panel B the PC headgroup was partially replaced with the smaller PE headgroup that gives a negative spontaneous curvature to monolayers. For the lipid mixtures without peptides, the partial replacement of PC with PE decreased KC, indicating that a lipid with negative curvature softens the bilayer. When the negatively charged lipids PI, PIP or PIP2 were added to the PC/PE mixture, KC decreased further, as with POPC. While systematic studies of lipid asymmetry in T-cells have not been performed to our knowledge, in red blood cells there is at least as much PE as PC in the cytoplasmic leaflet of the plasma membrane [44, 45]. Therefore we have included PE in several samples in this work.
Differences between MA31 and MA31myr occur at low concentrations of PIP2 as shown in Fig. 3C; non-myristoylated MA31 caused a greater decrease in KC than did MA31myr, similar to their difference with neutral POPC (Fig. 3A). The difference in KC between MA31 and MA31myr decreased as the net charge for the peptide-containing samples in Fig. 3C ranged from +0.14 to negative values.
In order to test the specificity of the PIP2 headgroup [46], we compared adding increasing amounts of MA31 or MA31myr to two lipid mixtures with the same overall net negative charge: POPC/POPS (60:40 mole ratio) and POPC/PIP2 (90:10 mole ratio) (both −0.4 e per lipid). Fig. 3D shows that increasing amounts of both peptides stiffen at low concentration, and then soften POPC/POPS membranes at higher concentration, yet both peptides monotonically soften POPC/PIP2 membranes with increasing concentration. The net charge on these samples was dominated by the high concentrations of PIP2 or PS, ranging from −0.4 to −0.29 per lipid plus protein (see Table 1).
Table 1.
Net charge and D-spacing
| Net Charge | Sample | D-spacing result |
Sample | D-spacing result |
|---|---|---|---|---|
| −0.4 | Control POPC/POPS (60:40) | D-unbound | Control POPC/PIP2 (90:10) | D-unbound |
| −0.385 | POPC/POPS (60:40)/.002MA | D-unbound | POPCPIP2 (90:10)/.002MA | D-unbound |
| −0.371 | POPC/POPS (60:40)/.004MA | D-unbound | POPC/PIP2 (90:10)/.004MA | D-unbound |
| −0.34 | POPC/POPS (60:40)/.008MA | D-unbound | POPC/PIP2 (90:10)/.008MA | D-unbound |
| −0.323 | POPC/POPS (60:40)/.011MA | D-unbound | POPC/PIP2 (90:10)/.011MA | D-bound |
| −0.288 | POPC/POPS (60:40)/.015MA | D-unbound | POPC/PIP2 (90:10)/.015MA | D-bound |
| −0.4 | Control POPC/POPS (60:40) | D-unbound | Control POPC/PI P2 (90:10) | D-unbound |
| −0.385 | POPC/POPS (60:40)/.002MAmyr | D-unbound | POPC/PIP2 (90:10)/.002MAmyr | D-unbound |
| −0.371 | POPC/POPS (60:40)/.004MAmyr | D-unbound | POPC/PIP2 (90:10)/.004MAmyr | D-unbound |
| −0.34 | POPC/POPS (60:40)/.008MAmyr | D-unbound | POPC/PIP2 (90:10J/.008MAmyr | D-unbound |
| −0.288 | POPC/POPS (60:40)/.C15MAmyr | D-bound | POPC/PIP2 (90:10)/.015MAmyr | D-bound |
Net charge of the mixtures (peptide plus lipid) is shown in the left-hand column. Samples whose D-spacings continued to increase to large values are described as D-unbound. Samples whose D-spacings continued to decrease or reached a limiting value are described as D-bound.
In summary for this subsection, when the net charge was more positive than −0.26 e per lipid, MA31 lowered KC to a greater extent than did MA31myr. When the net charge was more negative than −0.26e per lipid, there was little difference in KC between MA31myr and MA31. With no added peptides, PS and PIP2 caused a decrease in KC compared to the POPC control (compare POPC in Fig. 3A with 0 peptide concentration in Fig. 3D). MA31 softens membranes more than MA31myr in PIP2-containing membranes unless the net negative charge exceeds −0.26, and then both peptides soften similarly. Fig. 3D shows that MA31 and MA31myr both stiffen at low concentration and then soften at high concentration PS-containing membranes, while both peptides soften PIP2-containing membranes at all concentrations, yet their overall net charge is identical. Inclusion of POPE in these lipids mixtures (Fig. 3B) decreased KC; PIP and PIP2 decreased KC to a greater extent than PI when combined with POPC and POPE, due to their greater negative charges.
3.1.3 X-ray form factors and electron density profiles
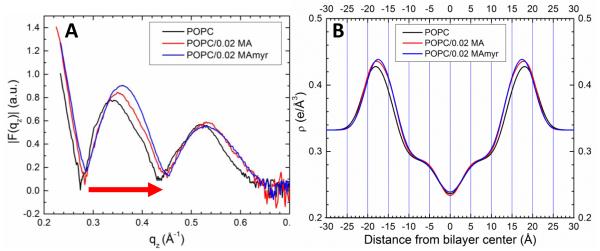
Fig. 4A shows that the form factor of the neutral lipid, POPC, moves to higher qz upon addition of peptide; this q-space result qualitatively indicates a membrane thinning that is slightly greater for MA31myr compared to MA31. The real-space extent of membrane thinning is indicated in Fig. 4B by comparing the maxima in the total electron density envelope of these three samples. A membrane bilayer thinning of 0.5 Å for POPC/0.02 MA31 and 1.2 Å for POPC/0.02 MA31myr occurred, as judged by the peak-to-peak distance.
Figure 4.
(A) Form factors for POPC (black line) with 0.02 mole fraction MA31 (red line) or MA31myr (blue line). Arrow indicates that ∣F(qz)∣ data shift to higher qz values, indicating membrane thinning. (B) Total electron density profiles of samples shown in (A).
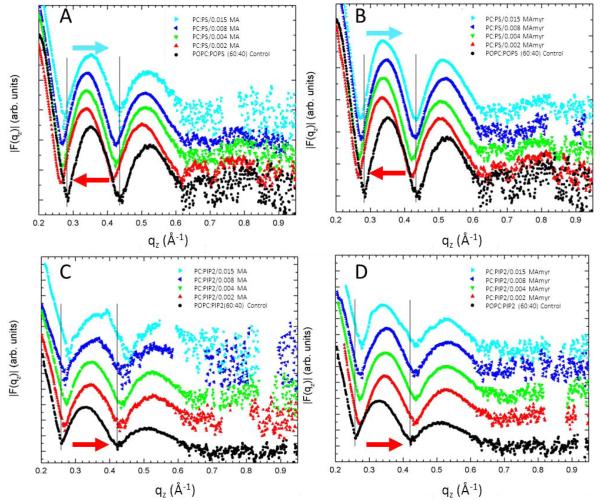
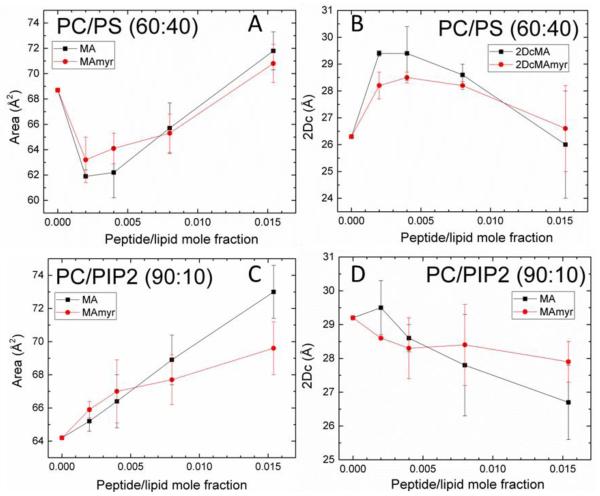
Fig. 5 shows form factors for MA31 and MA31myr as a function of peptide concentration in POPC/POPS (60:40) and POPC/PIP2 (90:10) lipid membranes. These are the structural results for the samples that yielded the KC results in Fig. 3D. For increasing peptide concentration in PS-containing membranes, the qz values decreased and subsequently increased, indicating first a membrane thickening, then a membrane thinning back to the control thickness. Quite differently, in PIP2-containing membranes, there was an increase in qz, indicating a membrane thinning that increased with peptide concentration. While these trends are qualitatively revealing, detailed analysis gives the quantitative structural results summarized in Fig. 6A-D. The area/lipid AL first decreased then increased with added peptides in PC/PS membranes (Fig. 6A), but monotonically increased in PC/PIP2 membranes (Fig. 6C). The membrane thickness, 2DC, showed a similar trend. It first increased, then decreased back to the control value in PC/PS membranes, but decreased in PC/PIP2 membranes. Similarly, the hydrocarbon membrane thickness, 2DC, first increased and then decreased back to the control value in PC/PS membranes (Fig. 6B), while there was a steady decrease observed in PC/PIP2 membranes (Fig. 6D). There was no significant difference between MA31 and MA31myr.
Figure 5.
Form factors as a function of lipid mimic and peptide mole ratio from 0 to 0.015 peptide/lipid. (A) MA31 in POPC/POPS (60:40 mole ratio), (B) MA31myr in POPC/POPS (60:40), (C) MA31 in POPC/PIP2 (90:10), (D) MA31myr in POPC:PIP2 (90:10). Arrows indicate membrane thickening (pointing to lower qz values), and membrane thinning (pointing to higher qz values). Control lipids are black solid circles in all sections. Form factors are shifted vertically for clarity.
Figure 6.
Structural results vs. increasing peptide mole ratio: (A) area/lipid AL in POPC/POPS (60:40), (B) hydrocarbon thickness 2DC in POPC/POPS (60:40), (C) AL in POPC/PIP2 (90:10), (D) 2DC in POPC/PIP2 (90:10). Error bars indicate the standard deviations of the average of 2-5 fits.
3.2 Wide-angle X-ray scattering (WAXS)
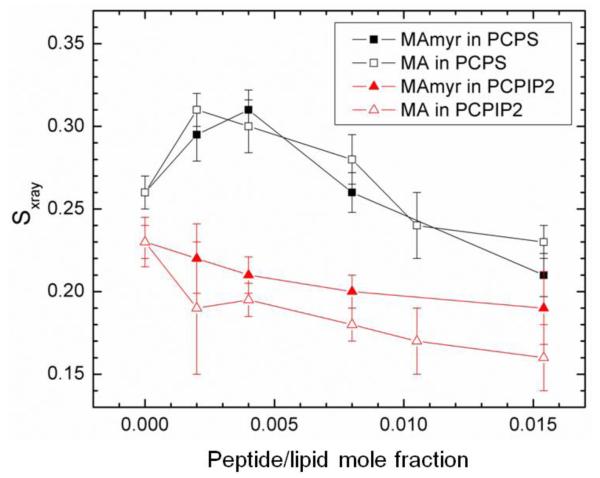
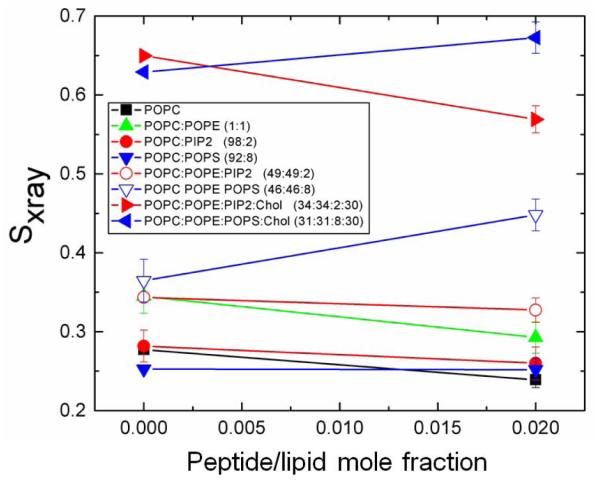
Fig. 7 shows the chain order Sxray results as a function of peptide concentration for the series of samples in Fig. 3A. Sxray is an order parameter, similar to the NMR order parameter Smol [47], which reports on chain orientational order [39]. The chain order is observed to increase initially and then decrease with increasing concentration of both peptides in POPC:POPS (60:40) membranes. This parallels the trend observed in the structural results for these samples in Fig. 6B; there was first a membrane thickening followed by a membrane thinning at higher peptide concentration. Evidently thickening is due to an increase in chain order which causes the lipid chains to extend, and which reverses at higher concentrations to cause membrane thinning back to the control value. In contrast to POPC/POPS, there was a very gradual decrease in membrane order in the POPC/PIP2 (90:10) samples, which is consistent with the 2.5 Å membrane thinning that occurred (Fig. 6D). The chain order results are also consistent with the KC values presented in Fig. 3C for these lipids in that PC/PS lipids first stiffened and then softened with increasing peptide concentration, while PC/PIP2 lipids generally softened with increasing peptide.
Figure 7.
Sxray order parameter for MA31myr or MA in POPC/POPS (60:40), or POPC/PIP2 (90:10). Sxray values were corrected for misalignment of layers. Error bars indicate standard deviations from the average Sxray from 2 or more images.
The data above have the advantage of varying charge concentration over a range large enough to more easily see trends. We also obtained results from samples that focused on physiological concentrations of PIP2. As with the majority of the data shown above, these negatively charged mimics have the same overall net negative charge. Peptide concentration was limited to lipid/0.02 MA31myr. Results for KC, 2DC and area/lipid are given in Table 2, and results for Sxray are given in Figure 8. Addition of the peptide to PIP2-containing bilayers decreased KC, consistent with the results in Fig. 3D, decreased the hydrophobic thickness, consistent with Fig. 6D, and increased the area/lipid, consistent with results in Fig. 6C. Addition of the peptide to the PS-containing bilayer had negligible effect on KC, the hydrophobic thickness and area/lipid. As was the case for the data above, the results are different for adding peptide to bilayers of PS- vs. PIP2-containing lipids. While the responses of PC/PS mimics at this concentration (92:8 mole ratio) were smaller compared to those at 60:40 mole ratio, they were quite different from those of PC/PIP2 (98:2 mole ratio), suggesting that the results in Figs. 3D and 6 are in qualitative agreement with physiological concentrations of negatively charged lipids. We also note that it is the local responses that are important for functionality and these can be much larger than the measured responses which are averaged over the entire membrane.
Table 2.
KC and structural results for physiological lipid concentrations
| Membrane Mimic | KC(x10−20J) | Std. Dev. |
2DC(Å) | Std. Dev. |
Area/lipid(Å2) | Std. Dev. |
|---|---|---|---|---|---|---|
| POPC | 8.2 | 0.4 | 29.1 | 0.5 | 64 | 1 |
| POPC/0.02 MAmyr | 6.8 | 0.2 | 27.1 | 0.4 | 68.7 | 1.1 |
| POPC/PIP2(98:2) | 7.6 | 0.1 | 29.6 | 0.6 | 63 | 1.1 |
| POPC/PIP2(98:2)/0.02 MAmyr | 6.7 | 0.2 | 27.7 | 0.6 | 67.1 | 0.9 |
| POPC/POPS(92:8) | 6.0 | 0.2 | 27.8 | 0.4 | 67 | 0.8 |
| POPC/POPS(92:8)/0.02 MAmyr | 5.9 | 0.3 | 27.7 | 0.5 | 67.2 | 1.2 |
(For each membrane mimic, averages and standard deviations resulted from 2-10 samples.)
Figure 8.
Sxray order parameter for pure lipid mimetics and MA31myr (see legend for lipid details). Sxray values were corrected for mosaic spread. Error bars represent standard deviation of average Sxray values from 2-4 images.
The Sxray results shown in Fig. 8 for the samples in Table 2, also include additional samples containing POPE and cholesterol with the negatively charged lipids. Samples containing 30 mole% cholesterol had high Sxray values due to their increased chain order [48]. However, when 0.02 MAmyr was added to the mimic containing cholesterol and POPS, Sxray increased, while it decreased for the mimic containing cholesterol and PIP2. This indicates that cholesterol does not interfere with the differences in chain order caused by PS vs. PIP2. Similarly, when POPE was included, PS-containing samples increased, and PIP2-containing samples decreased Sxray when MAmyr was added. Therefore, the changes caused by the peptide are dominated by their interactions with the negatively charged lipids, even at physiological concentrations. While it is true that the hydrocarbon chains in the lipids that we purchased from Avanti are different for POPS vs. porcine brain PI(4,5)P2, we doubt that the additional polyunsaturation in the PIP2 lipid plays a role in softening membranes. Indeed, we have found just the opposite [49].
3.3 Neutron Reflectivity (NR)
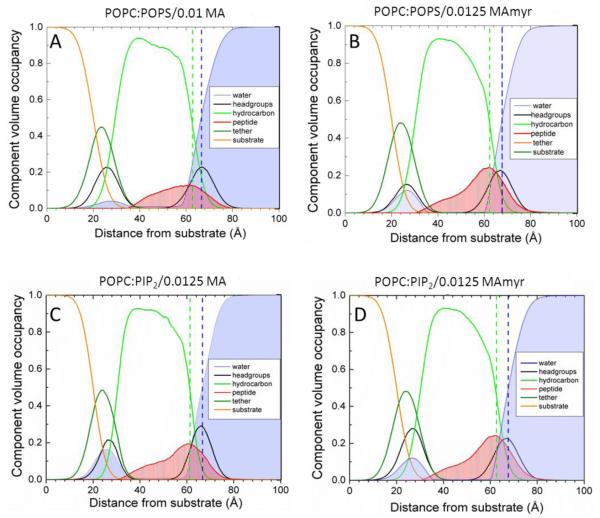
While X-ray scattering is well suited to reporting changes in membrane thickness and elastic properties, neutron reflectivity is superior for obtaining peptide position in a bilayer due to greater contrast between the protein, lipid headgroup and lipid hydrocarbon chains [41]. NR results (Fig. 9) show MA31myr located both in the headgroup (HG) region as well as 69±17% in the hydrocarbon (HC) region in both membrane mimics. Within the 68% confidence limits, there were no significant differences between MA31 and MA31myr. See Fig. S3 for visualization of the 68% confidence limits.
Figure 9.
Scattering density profiles obtained from neutron reflectivity. A. POPC/POPS (60:40 mole ratio)/0.01 MA31, B. POPC/POPS (60:40)/0.0125 MA31myr, C. POPC/PIP2 (90:10)/0.0125 MA31, D. POPC/PIP2 (90:10)/0.0125 MA31myr. Bilayer components are shown in the legends; Gibbs dividing surfaces HC (green dashed line) and water (blue dashed line) are shown.
3.4 D-Spacing
The D-spacing of oriented samples as they were hydrated through the vapor phase either continuously increased, which we call D-unbound, or reached a limit, which we call D-bound. Instead of listing actual D-spacings, which were quite variable for the samples shown in Table 1 due to different effective relative humidity, the D-spacing is shown either as D-unbound or D-bound along with the overall net charge (based on a unit cell of one lipid plus the mole ratio of peptide and assuming a net charge of +7e on the peptides). At the highest MA31myr concentration in both PC/PS and PC/PIP2 membranes, the membranes became D-bound, similar to the condition for neutral lipid membranes. At the highest two MA31 concentrations in PC/PIP2 membranes, the membranes also became D-bound, but not in PC/PS membranes.
3.5 CD spectroscopy and volume measurements
CD spectroscopy for MA31 and MA31myr with several lipid mixtures are shown in Fig. S2. Similarly, volume results for MA31 and MA31myr in pure water and mixed with lipids are shown in Table S1.
4. Discussion
4.1 Location of the peptides in the membrane mimics
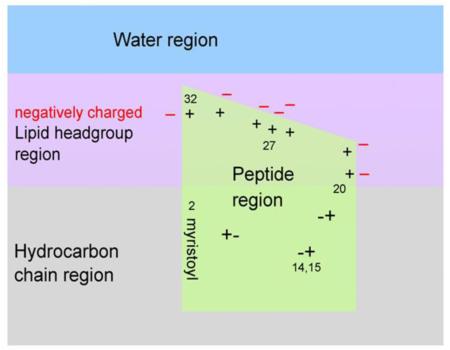
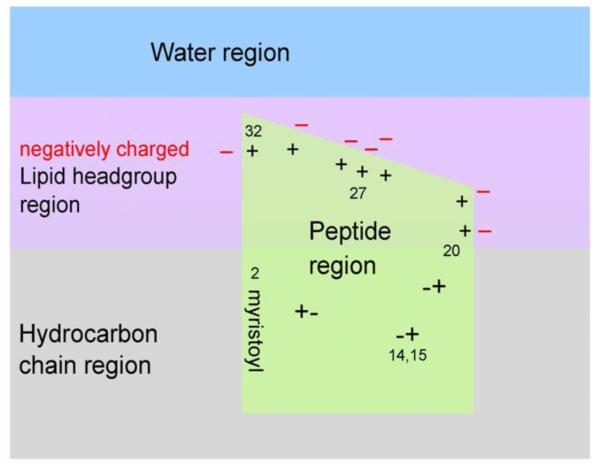
A striking result, obtained from neutron reflectivity, is that the MA peptides reside more deeply in the interior of charged membrane mimics than one might have guessed, based on hydrophobicity scales [50]. A priori, such strongly positively charged peptides would have been predicted to occupy a more peripheral location, somewhat further from the center of the bilayer than the phosphate headgroups of the lipids. We propose that the deeper location can be understood in terms of the cartoon in Fig. 10 which shows a proposed distribution of the peptides along the membrane normal. This cartoon suggests that the charged amino acid side chains can be neutralized, thereby allowing greater hydrophobic penetration. Neutralization could be effected by the negatively charged lipids with those amino acids in the AA20-32 binding domain and by pairing and hydrogen bonding of positive and negative amino acids in AA2-19. If their charged ends are neutralized, lysine and arginine side chains are hydrophobic moieties.
Figure 10.
Cartoon representation of MA31myr insertion into a negatively charged membrane, based upon neutron reflectivity results. The location of the 7 positively charged amino acid residues in the HBR from AA20-32 are visualized by + signs with nearby negatively charged lipid headgroups (− signs). The charged amino acids in the AA2-19 stretch are visualized as +− pairs. The last AA32 is visualized near bulk water to allow the remainder of the MA131 protein to reside in water.
It is interesting to relate our cartoon in Fig. 10 to recent paramagnetic relaxation enhancement studies of MA protein bound to bicelles [27]. The used 5-DOXYL-PC harbors an NMR perturbing nitroxyl radical at position 5 of the sn-2 stearoyl chain, which resides in the hydrocarbon region about 2-3 Å from the hydrocarbon/headgroup interface [51-54]. The largest perturbations were reported for G2, A3, R4, A5, S6 and L8, consistent with the placement of these residues in the hydrocarbon region in our Fig. 10. Some of the residues in the HBR were perturbed more than residues that are usually thought to reside outside the membrane; that is consistent with their residing in the headgroup region in Fig. 10.
Our interpretation may seem contrary to published neutron reflectivity results [6, 55]. However, Ref. [55] used NR to study the non-myristoylated MA protein which was positioned at the surface of a bilayer containing saturated lipids. The results in Ref. [6] could be within the 68% confidence resolution of our present NR results (see Fig. S3). It may also be noted that the location of the peptides is relative to the average location of the lipids; at the local lateral position of the peptide, it would be possible for the lipid bilayer to be thinner, thereby placing the peptides less deeply into the hydrophobic core locally, as has previously been suggested for the HIV-1 Tat petide [56] and for the KvAP K+ channel [57]. The mechanism for such thinning is that a peptide localized in the headgroup region will require the chains of nearby lipids to fill in the hydrocarbon volume beneath the peptide; these chains will then be tilted, with a smaller projection along the bilayer normal, resulting in a locally thinner membrane. We note that the deep penetration of MA31myr from our NR experiments do not agree with the much shallower penetration obtained from a coarse grained simulation of MA [58] that has not been validated against experimental structure involving a lipid bilayer. It is, of course, possible that the first 31 amino acids in the full MA reside less deeply in the membrane than our truncated peptides; the water soluble amino acids not included in our reductionist study might pull the binding sites towards the water. This conclusion would be supported if the same simulation methodology applied to MA31myr agreed with our NR experimental results. Even if this is so, it is still of interest that our highly charged peptides reside so deeply in lipid bilayers.
4.2 PI(4,5)P2 vs. PS
As was emphasized in the Introduction, PIP2 is required for targeting of the precursor polyprotein, Pr55Gag, to the PM, where the nascent virions acquire their lipid envelope from the local PM. We emphasize the importance of lipids by reporting differences between PIP2 and PS at the membrane biophysical level as MA is added. The structural differences are shown in Figs. 6A and 6C for area/lipid, in Figs. 6B and 6D for membrane thickness, in Fig. 7 for chain order parameter Sxray, in Fig. S2 for circular dichroism and in Table 1 for the lamellar repeat spacing D. Structurally, the difference is that concentrations of both peptides thicken and order PS-containing membranes and thin and disorder PIP2-containing membranes, although larger concentrations of peptides reverse the effect in PS-containing membranes. Decreasing the PC/PS lipid area and increasing the PC/PS membrane thickness by the peptides could result from the requirement for seven negatively-charged PS lipids to neutralize one peptide, which could compact the lipids near MA31. Only two PIP2 lipids are needed to neutralize MA31, so compaction would not be as likely. While the secondary structures shown in Fig. S2 are not identical to the secondary structures in the intact MA protein [25], they are similar enough to warrant using this MA31 binding domain to characterize MA/membrane interactions.
Structural differences, while clear, do not suggest functional differences. For that we turn to Fig. 3D which shows that the bending modulus KC becomes smaller when peptide binds to PIP2-containing membranes and larger for PS-containing membranes. Making a membrane softer makes it easier to undergo the restructuring that is required for budding of the HIV-1 virion. The concentrations of MA peptides at which we find differences between PS and PIP2-containing membranes are smaller than the concentration 0.03 MA/lipid in the fully formed immature virion [59]. We hypothesize that the lipid differences would be important during the recruitment of MA when its concentration is smaller than the upper bound of the fully formed virion. It is during this process that the membrane must bend substantially. While this is only one aspect of this complicated process, it is one that correlates our biophysical results well with functionality.
4.3 Myristoyl group
Since it has long been known that the myristoyl is involved in binding of Gag to the PM [60], we thought it was important for this biophysical study to test the effect of the myristoyl group by studying MA31 in addition to MA31myr. Surprisingly, our neutron reflectivity results show that both MA31 and MA31myr bound to and inserted deeply into both PS- and PIP2- containing bilayers, suggesting that the myristoyl group might not have been needed. On the other hand, we may explain this surprising NR result as due to the large net charge in our membrane mimics that used more than the physiological concentration of PIP2. Perhaps NR experiments on less charged systems, or with less peptide, would find differences between MA31 and MA31myr binding. We have obtained NR data using POPC tethered bilayers (not shown) that indicate no binding of either peptide. While this may appear to contradict our X-ray results that clearly show strong interaction with our peptides, there is no contradiction because there is roughly 105 times less water per lipid in the X-ray experiments, even though our X-ray samples consist of fully hydrated stacks with the order of 30 waters/lipid (~20 Å water between adjacent bilayers). Therefore, much more peptide becomes bound even with the same partition coefficient that gives negligible binding in the NR samples where there is ~0.2 mm of water on top of the tethered bilayer.
Also surprising at first glance, KC of the neutral POPC bilayer decreased even more upon addition of MA31 than of MA31myr, as seen in Fig. 3A. We suggest that both peptides are forced into the headgroup region of the neutral membranes in our X-ray samples, displacing lipid headgroups, creating a deficit pressure in the underlying hydrocarbon chain region, splaying the chains and thereby reducing KC. The myristoyl chain on MA31myr would help fill in the hydrocarbon deficit region, thereby reducing KC less compared to MA31, as observed in Fig. 3A. Of course, binding would become stronger and deeper with a greater concentration of charged lipids, and differences between MA31 and MA31myr would be expected to disappear, consistent with our NR results in Fig. 8 and with our KC results in Fig. 3C.
The D-spacing results in Table 1 are noteworthy with regard to both myristoylation and the lipids. First recall that electrostatic repulsion between neighboring membranes generally leads to D-unbinding. As the net negative charge is reduced by binding positively charged peptide to the lipids, the smaller electrostatic repulsion leads to D-binding, which is the usual state for systems of fully hydrated neutral bilayers. However, if the peptides do not bind or bind only partially, the electrostatic repulsion remains large and the stack of bilayers remains unbound. In this case, the peptides remain in the water space between membranes such as occurred with a positively charged monomer of the HIV-1 fusion peptide [36]. Less peptide binding in the MA31/PS-containing system would account for MA31 remaining D-unbound at concentrations at which MA31/PIP2, MA31myr/PS, and MA31myr/PIP2 became D-bound. The D-binding difference in Table 1 between MA31/PS and MA31/PIP2 is consistent with specific binding of MA31 to PIP2, and the difference between MA31/PS and MA31myr/PS is consistent with specific binding due to the myristoyl group.
5. Conclusions
Our first main conclusion is that many membrane properties are affected quite differently by the MA31 binding domain when PIP2 lipids are replaced by PS lipids of equivalent charge. Of these membrane properties the one we hypothesize to be most likely to affect function is the bending modulus. Reducing this modulus reduces the free energy for restructuring the membrane for viral budding. Our result that the binding domain of MA31 reduces the bending modulus for the native PIP2-containing membranes whereas it increases the bending modulus of the PS-containing membranes suggests another biological value for PIP2 in addition to its recognized function of providing a stereo-specific anchor for the MA protein to the membrane [25].
In order to obtain this result we utilized 31 amino acid peptides that included the highly charged HBR in the membrane binding domain. Despite their high charge, our neutron reflectivity results show that a substantial portion of our peptides inserts quite deeply into the hydrocarbon interior when the lipid bilayer is highly charged. This second main result is consistent with our interpretation of recent NMR/spin label results for the entire myristoylated MA protein [27].
We also tested the effect of the myristoyl group by comparing MA31myr with MA31. Our results implicate the myristoyl group as aiding MA31 binding only when a strong charge neutralization does not dominate the interaction. Overall, our results emphasize the importance of the lipid composition in MA31 peptide binding.
Supplementary Material
Highlights.
Equally charged PS- and PIP2-containing membranes react differently to MA31 peptides.
The key difference is that MA31 peptides soften PIP2- and stiffen PS-membranes
MA31 peptides bind deeply into negatively charged membranes.
In neutral and lightly charged membranes, MA31 lowers KC more than does MA31myr.
Acknowledgements
This work is funded by the National Institute of General Medical Sciences of the National Institutes of Health under award R01GM44976 (S.T.-N., J.F.N., co-PIs) and R01GM101647 (M.L.(PI), F.H.). L.O’N. was the recipient of a NASA Award for summer undergraduates and GM44976, B.W.T., GM44976. The authors would like to acknowledge Michael S. Jablin for help with experimental design, sample preparation, data collection at CHESS, LAXS data analysis and volume measurements, GM44976. The authors would also like to thank Timothy Brooks for help with the LAXS data analysis. X-ray scattering data were taken at the Cornell High Energy Synchrotron Source (CHESS), which is supported by the National Science Foundation and the National Institutes of Health/National Institute of General Medical Sciences under National Science Foundation Award DMR-0225180. The authors thank Dr. Arthur Woll for help with beam alignment at CHESS. Parts of this research were performed at the NIST Center for Nanoscale Science and Technology and were supported by the NIST IMS program “Precision Measurements for Integral Membrane Proteins”. Certain commercial materials, equipment, and instruments are identified in this work to describe the experimental procedure as completely as possible. In no case does such an identification imply a recommendation or endorsement by National Institute of Standards and Technology, nor does it imply that the materials, equipment, or instrument identified are necessarily the best available for the purpose. CD data were collected in the Center for Molecular Analysis at Carnegie Mellon University.
Footnotes
None of the authors has a conflict of interest regarding this work.
Publisher's Disclaimer: This is a PDF file of an unedited manuscript that has been accepted for publication. As a service to our customers we are providing this early version of the manuscript. The manuscript will undergo copyediting, typesetting, and review of the resulting proof before it is published in its final citable form. Please note that during the production process errors may be discovered which could affect the content, and all legal disclaimers that apply to the journal pertain.
References
- [1].Gelderblom HR, Hausmann EH, Ozel M, Pauli G, Koch MA. Fine structure of human immunodeficiency virus (HIV) and immunolocalization of structural proteins. Virology. 1987;156:171–176. doi: 10.1016/0042-6822(87)90449-1. [DOI] [PubMed] [Google Scholar]
- [2].Chukkapalli V, Ono A. Molecular determinants that regulate plasma membrane association of HIV-1 Gag. J Mol Biol. 2011;410:512–524. doi: 10.1016/j.jmb.2011.04.015. [DOI] [PMC free article] [PubMed] [Google Scholar]
- [3].Ono A. HIV-1 Assembly at the plasma membrane: Gag trafficking and localization. Future Virol. 2009;4:241–257. doi: 10.2217/fvl.09.4. [DOI] [PMC free article] [PubMed] [Google Scholar]
- [4].Datta SAK, Curtis JE, Ratcliff W, Clark PK, Crist RM, Lebowitz J, Krueger S, Rein A. Conformation of the HIV-1 Gag protein in solution. J Mol Biol. 2007;365:812–824. doi: 10.1016/j.jmb.2006.10.073. [DOI] [PMC free article] [PubMed] [Google Scholar]
- [5].Munro JB, Nath A, Farber M, Datta SAK, Rein A, Rhoades E, Mothes W. A conformational transition observed in single HIV-1 Gag molecules during In Vitro assembly of virus-like particles. J Virol. 2014;88:3577–3585. doi: 10.1128/JVI.03353-13. [DOI] [PMC free article] [PubMed] [Google Scholar]
- [6].Datta SAK, Heinrich F, Raghunandan S, Krueger S, Curtis JE, Rein A, Nanda H. HIV-1 Gag extension: Conformational changes require simultaneous interaction with membrane and nucleic acid. J Mol Biol. 2011;406:205–214. doi: 10.1016/j.jmb.2010.11.051. [DOI] [PMC free article] [PubMed] [Google Scholar]
- [7].Jouvenet N, Simon SM, Bieniasz PD. Imaging the interaction of HIV-1 genomes and Gag during assembly of individual viral particles. P Natl Acad Sci USA. 2009;106:19114–19119. doi: 10.1073/pnas.0907364106. [DOI] [PMC free article] [PubMed] [Google Scholar]
- [8].Kutluay SB, Zang T, Blanco-Melo D, Powell C, Jannain D, Errando M, Bieniasz PD. Global changes in the RNA binding specificity of HIV-1 Gag regulate virion genesis. Cell. 2014;159:1096–1109. doi: 10.1016/j.cell.2014.09.057. [DOI] [PMC free article] [PubMed] [Google Scholar]
- [9].Chukkapalli V, Oh SJ, Ono A. Opposing mechanisms involving RNA and lipids regulate HIV-1 Gag membrane binding through the highly basic region of the matrix domain. Proc Natl Acad Sci U S A. 2010;107:1600–1605. doi: 10.1073/pnas.0908661107. [DOI] [PMC free article] [PubMed] [Google Scholar]
- [10].Chukkapalli V, Inlora J, Todd GC, Ono A. Evidence in support of RNA-mediated inhibition of phosphatidylserine-dependent HIV-1 Gag membrane binding in cells. J Virol. 2013;87:7155–7159. doi: 10.1128/JVI.00075-13. [DOI] [PMC free article] [PubMed] [Google Scholar]
- [11].Olety B, Ono A. Roles played by acidic lipids in HIV-1 Gag membrane binding. Virus Res. 2014;193:108–115. doi: 10.1016/j.virusres.2014.06.015. [DOI] [PMC free article] [PubMed] [Google Scholar]
- [12].Zhou WJ, Parent LJ, Wills JW, Resh MD. Identification of a membrane-binding domain within the amino-terminal region of Human-Immunodeficiency-Virus Type-1 Gag protein which interacts with acidic phospholipids. J Virol. 1994;68:2556–2569. doi: 10.1128/jvi.68.4.2556-2569.1994. [DOI] [PMC free article] [PubMed] [Google Scholar]
- [13].Ono A, Orenstein JM, Freed EO. Role of the gag matrix domain in targeting human immunodeficiency virus type 1 assembly. J Virol. 2000;74:2855–2866. doi: 10.1128/jvi.74.6.2855-2866.2000. [DOI] [PMC free article] [PubMed] [Google Scholar]
- [14].Tang C, Loeliger E, Luncsford P, Kinde I, Beckett D, Summers MF. Entropic switch regulates myristate exposure in the HIV-1 matrix protein. P Natl Acad Sci USA. 2004;101:517–522. doi: 10.1073/pnas.0305665101. [DOI] [PMC free article] [PubMed] [Google Scholar]
- [15].Freed EO, Orenstein JM, Buckler-White AJ, Martin MA. Single amino acid changes in the human immunodeficiency virus type 1 matrix protein block virus particle production. Journal of virology. 1994;68:5311–5320. doi: 10.1128/jvi.68.8.5311-5320.1994. [DOI] [PMC free article] [PubMed] [Google Scholar]
- [16].Ono A, Freed EO. Binding of human immunodeficiency virus type 1 Gag to membrane: Role of the matrix amino terminus. J Virol. 1999;73:4136–4144. doi: 10.1128/jvi.73.5.4136-4144.1999. [DOI] [PMC free article] [PubMed] [Google Scholar]
- [17].Saad JS, Loeliger E, Luncsford P, Liriano M, Tai J, Kim A, Miller J, Joshi A, Freed EO, Summers MF. Point mutations in the HIV-1 matrix protein turn off the myristyl switch. J Mol Biol. 2007;366:574–585. doi: 10.1016/j.jmb.2006.11.068. [DOI] [PMC free article] [PubMed] [Google Scholar]
- [18].Paillart JC, Gottlinger HG. Opposing effects of human immunodeficiency virus type 1 matrix mutations support a myristyl switch model of gag membrane targeting. Journal of virology. 1999;73:2604–2612. doi: 10.1128/jvi.73.4.2604-2612.1999. [DOI] [PMC free article] [PubMed] [Google Scholar]
- [19].Datta SAK, Temeselew LG, Crist RM, Soheilian F, Kamata A, Mirro J, Harvin D, Nagashima K, Cachau RE, Rein A. On the role of the SP1 domain in HIV-1 particle assembly: A molecular switch? J Virol. 2011;85:4111–4121. doi: 10.1128/JVI.00006-11. [DOI] [PMC free article] [PubMed] [Google Scholar]
- [20].Ono A, Ablan SD, Lockett SJ, Nagashima K, Freed EO. Phosphatidylinositol (4,5) bisphosphate regulates HIV-1 Gag targeting to the plasma membrane. Proc Natl Acad Sci U S A. 2004;101:14889–14894. doi: 10.1073/pnas.0405596101. [DOI] [PMC free article] [PubMed] [Google Scholar]
- [21].Brown FD, Rozelle AL, Yin HL, Balla T, Donaldson JG. Phosphatidylinositol 4,5-bisphosphate and Arf6-regulated membrane traffic. J Cell Biol. 2001;154:1007–1017. doi: 10.1083/jcb.200103107. [DOI] [PMC free article] [PubMed] [Google Scholar]
- [22].Facke M, Janetzko A, Shoeman RL, Krausslich HG. A large deletion in the matrix domain of the human immunodeficiency virus gag gene redirects virus particle assembly from the plasma membrane to the endoplasmic reticulum. Journal of virology. 1993;67:4972–4980. doi: 10.1128/jvi.67.8.4972-4980.1993. [DOI] [PMC free article] [PubMed] [Google Scholar]
- [23].Chukkapalli V, Hogue IB, Boyko V, Hu WS, Ono A. Interaction between the human immunodeficiency virus type 1 Gag matrix domain and phosphatidylinositol-(4,5)-bisphosphate is essential for efficient Gag membrane binding. J Virol. 2008;82:2405–2417. doi: 10.1128/JVI.01614-07. [DOI] [PMC free article] [PubMed] [Google Scholar]
- [24].Chan R, Uchil PD, Jin J, Shui GH, Ott DE, Mothes W, Wenk MR. Retroviruses human immunodeficiency virus and murine leukemia virus are enriched in phosphoinositides. J Virol. 2008;82:11228–11238. doi: 10.1128/JVI.00981-08. [DOI] [PMC free article] [PubMed] [Google Scholar]
- [25].Saad JS, Miller J, Tai J, Kim A, Ghanam RH, Summers MF. Structural basis for targeting HIV-1 Gag proteins to the plasma membrane for virus assembly. Proc Natl Acad Sci U S A. 2006;103:11364–11369. doi: 10.1073/pnas.0602818103. [DOI] [PMC free article] [PubMed] [Google Scholar]
- [26].Shkriabai N, Datta SAK, Zhao ZJ, Hess S, Rein A, Kvaratskhelia M. Interactions of HIV-1 Gag with assembly cofactors. Biochemistry. 2006;45:4077–4083. doi: 10.1021/bi052308e. [DOI] [PubMed] [Google Scholar]
- [27].Mercredi PY, Bucca N, Loeliger B, Gaines CR, Mehta M, Bhargava P, Tedbury PR, Charlier L, Floquet N, Muriaux D, Favard C, Sanders CR, Freed EO, Marchant J, Summers MF. Structural and molecular determinants of membrane binding by the HIV-1 matrix protein. J Mol Biol. 2016;428:1637–1655. doi: 10.1016/j.jmb.2016.03.005. [DOI] [PMC free article] [PubMed] [Google Scholar]
- [28].Barros M, Heinrich F, Datta SAK, Rein A, Karageorgos I, Nanda H, Lösche M. Membrane binding of HIV-1 matrix protein: Dependence on bilayer composition and protein lipidation. J Virol. 2016;90:4544–4555. doi: 10.1128/JVI.02820-15. [DOI] [PMC free article] [PubMed] [Google Scholar]
- [29].Freed EO. HIV-1 Gag proteins: Diverse functions in the virus life cycle. Virology. 1998;251:1–15. doi: 10.1006/viro.1998.9398. [DOI] [PubMed] [Google Scholar]
- [30].Tristram-Nagle SA. Preparation of oriented, fully hydrated lipid samples for structure determination using X-ray scattering. Methods Mol Biol. 2007;400:63–75. doi: 10.1007/978-1-59745-519-0_5. [DOI] [PMC free article] [PubMed] [Google Scholar]
- [31].Kučerka N, Liu YF, Chu NJ, Petrache HI, Tristram-Nagle S, Nagle JF. Structure of fully hydrated fluid phase DMPC and DLPC lipid bilayers using X-ray scattering from oriented multilamellar arrays and from unilamellar vesicles. Biophysical Journal. 2005;88:2626–2637. doi: 10.1529/biophysj.104.056606. [DOI] [PMC free article] [PubMed] [Google Scholar]
- [32].Budvytyte R, Valincius G, Niaura G, Voiciuk V, Mickevicius M, Chapman H, Goh HZ, Shekhar P, Heinrich F, Shenoy S, Lösche M, Vanderah DJ. Structure and properties of tethered bilayer lipid membranes with unsaturated anchor molecules. Langmuir. 2013;29:8645–8656. doi: 10.1021/la401132c. [DOI] [PMC free article] [PubMed] [Google Scholar]
- [33].Wiener MC, Tristram-Nagle S, Wilkinson DA, Campbell LE, Nagle JF. Specific volumes of lipids in fully hydrated bilayer dispersions. Biochim Biophys Acta. 1988;938:135–142. doi: 10.1016/0005-2736(88)90153-8. [DOI] [PubMed] [Google Scholar]
- [34].Liu YF, Nagle JF. Diffuse scattering provides material parameters and electron density profiles of biomembranes. Phys Rev E. 2004;69:040901–040904(R). doi: 10.1103/PhysRevE.69.040901. [DOI] [PMC free article] [PubMed] [Google Scholar]
- [35].Lyatskaya Y, Liu YF, Tristram-Nagle S, Katsaras J, Nagle JF. Method for obtaining structure and interactions from oriented lipid bilayers. Phys Rev E. 2001;63:0119071–0119079. doi: 10.1103/PhysRevE.63.011907. [DOI] [PMC free article] [PubMed] [Google Scholar]
- [36].Tristram-Nagle S, Chan R, Kooijman E, Uppamoochikkal P, Qiang W, Weliky DP, Nagle JF. HIV fusion peptide penetrates, disorders, and softens T-cell membrane mimics. J Mol Biol. 2010;402:139–153. doi: 10.1016/j.jmb.2010.07.026. [DOI] [PMC free article] [PubMed] [Google Scholar]
- [37].Tristram-Nagle S, Nagle JF. HIV-1 fusion peptide decreases bending energy and promotes curved fusion intermediates. Biophysical Journal. 2007;93:2048–2055. doi: 10.1529/biophysj.107.109181. [DOI] [PMC free article] [PubMed] [Google Scholar]
- [38].Jablin MS, Akabori K, Nagle JF. Experimental support for tilt-dependent theory of biomembrane mechanics. Phys Rev Lett. 2014;113:248102, 248101–248105. doi: 10.1103/PhysRevLett.113.248102. [DOI] [PubMed] [Google Scholar]
- [39].Mills TT, Toombes GES, Tristram-Nagle S, Smilgies DM, Feigenson GW, Nagle JF. Order parameters and areas in fluid-phase oriented lipid membranes using wide angle x-ray scattering. Biophysical Journal. 2008;95:669–681. doi: 10.1529/biophysj.107.127845. [DOI] [PMC free article] [PubMed] [Google Scholar]
- [40].Dura JA, Pierce DJ, Majkrzak CF, Maliszewskyj NC, McGillivray DJ, Lösche M, O'Donovan KV, Mihailescu M, Perez-Salas U, Worcester DL, White SH. AND/R: Advanced neutron diffractometer/reflectometer for investigation of thin films and multilayers for the life sciences. Rev Sci Instrum. 2006;77:074301. doi: 10.1063/1.2219744. [DOI] [PMC free article] [PubMed] [Google Scholar]
- [41].Heinrich F, Lösche M. Zooming in on disordered systems: Neutron reflection studies of proteins associated with fluid membranes. Biochim. Biophys. Acta-Biomembr. 2014;1838:2341–2349. doi: 10.1016/j.bbamem.2014.03.007. [DOI] [PMC free article] [PubMed] [Google Scholar]
- [42].Boscia AL, Akabori K, Benamram Z, Michel JA, Jablin MS, Steckbeck JD, Montelaro RC, Nagle JF, Tristram-Nagle S. Membrane structure correlates to function of LLP2 on the cytoplasmic tail of HIV-1 gp41 protein. Biophysical Journal. 2013;105:657–666. doi: 10.1016/j.bpj.2013.06.042. [DOI] [PMC free article] [PubMed] [Google Scholar]
- [43].Nagle JF, Akabori K, Treece BW, Tristram-Nagle S. Determination of mosaicity in oriented stacks of lipid bilayers. Soft Matter. 2016;12:1884–1891. doi: 10.1039/c5sm02336j. [DOI] [PMC free article] [PubMed] [Google Scholar]
- [44].Daleke DL. Regulation of phospholipid asymmetry in the erythrocyte membrane. Current opinion in hematology. 2008;15:191–195. doi: 10.1097/MOH.0b013e3282f97af7. [DOI] [PubMed] [Google Scholar]
- [45].Devaux PF. Static and dynamic lipid asymmetry in cell membranes. Biochemistry. 1991;30:1163–1173. doi: 10.1021/bi00219a001. [DOI] [PubMed] [Google Scholar]
- [46].Graber ZT, Jiang ZP, Gericke A, Kooijman EE. Phosphatidylinositol-4,5-bisphosphate ionization and domain formation in the presence of lipids with hydrogen bond donor capabilities. Chem Phys Lipids. 2012;165:696–704. doi: 10.1016/j.chemphyslip.2012.07.003. [DOI] [PubMed] [Google Scholar]
- [47].Seelig J, Niederberger W. Deuterium-labeled lipids as structural probes in liquid-crystalline bilayers - deuterium magnetic-resonance study. J Am Chem Soc. 1974;96:2069–2072. [Google Scholar]
- [48].Pan JJ, Mills TT, Tristram-Nagle S, Nagle JF. Cholesterol perturbs lipid bilayers nonuniversally. Phys Rev Lett. 2008;100:198103, 198101–198104. doi: 10.1103/PhysRevLett.100.198103. [DOI] [PMC free article] [PubMed] [Google Scholar]
- [49].Eldho NV, Feller SE, Tristram-Nagle S, Polozov IV, Gawrisch K. Polyunsaturated docosahexaenoic vs docosapentaenoic acid - Differences in lipid matrix properties from the loss of one double bond. J Am Chem Soc. 2003;125:6409–6421. doi: 10.1021/ja029029o. [DOI] [PubMed] [Google Scholar]
- [50].Wimley WC, White SH. Experimentally determined hydrophobicity scale for proteins at membrane interfaces. Nat Struct Biol. 1996;3:842–848. doi: 10.1038/nsb1096-842. [DOI] [PubMed] [Google Scholar]
- [51].Chattopadhyay A, London E. Parallax method for direct measurement of membrane penetration depth utilizing fluorescence quenching by spin-labeled phospholipids. Biochemistry. 1987;26:39–45. doi: 10.1021/bi00375a006. [DOI] [PubMed] [Google Scholar]
- [52].Abrams FS, London E. Calibration of the parallax fluorescence quenching method for determination of membrane penetration depth: refinement and comparison of quenching by spin-labeled and brominated lipids. Biochemistry. 1992;31:5312–5322. doi: 10.1021/bi00138a010. [DOI] [PubMed] [Google Scholar]
- [53].Abrams FS, Chattopadhyay A, London E. Determination of the location of fluorescent probes attached to fatty acids using parallax analysis of fluorescence quenching: effect of carboxyl ionization state and environment on depth. Biochemistry. 1992;31:5322–5327. doi: 10.1021/bi00138a011. [DOI] [PubMed] [Google Scholar]
- [54].Abrams FS, London E. Extension of the parallax analysis of membrane penetration depth to the polar-region of model membranes - Use of fluorescence quenching by a spin-label attached to the phospholipid polar headgroup. Biochemistry. 1993;32:10826–10831. doi: 10.1021/bi00091a038. [DOI] [PubMed] [Google Scholar]
- [55].Nanda H, Datta SAK, Heinrich F, Losche M, Rein A, Krueger S, Curtis JE. Electrostatic interactions and binding orientation of HIV-1 matrix studied by neutron reflectivity. Biophysical Journal. 2010;99:2516–2524. doi: 10.1016/j.bpj.2010.07.062. [DOI] [PMC free article] [PubMed] [Google Scholar]
- [56].Akabori K, Huang K, Treece BW, Jablin MS, Maranville B, Woll A, Nagle JF, Garcia AE, Tristram-Nagle S. HIV-1 Tat membrane interactions probed using X-ray and neutron scattering, CD spectroscopy and MD simulations. Biochim. Biophys. Acta-Biomembr. 2014;1838:3078–3087. doi: 10.1016/j.bbamem.2014.08.014. [DOI] [PMC free article] [PubMed] [Google Scholar]
- [57].Freites JA, Tobias DJ, von Heijne G, White SH. Interface connections of a transmembrane voltage sensor. Proc Natl Acad Sci U S A. 2005;102:15059–15064. doi: 10.1073/pnas.0507618102. [DOI] [PMC free article] [PubMed] [Google Scholar]
- [58].Charlier L, Louet M, Chaloin L, Fuchs P, Martinez J, Muriaux D, Favard C, Floquet N. Coarse-grained simulations of the HIV-1 matrix protein anchoring: Revisiting its assembly on membrane domains. Biophysical Journal. 2014;106:577–585. doi: 10.1016/j.bpj.2013.12.019. [DOI] [PMC free article] [PubMed] [Google Scholar]
- [59].Briggs JAG, Krausslich HG. The molecular architecture of HIV. J Mol Biol. 2011;410:491–500. doi: 10.1016/j.jmb.2011.04.021. [DOI] [PubMed] [Google Scholar]
- [60].Zhou WJ, Resh MD. Differential membrane binding of the human immunodeficiency virus type 1 matrix protein. J Virol. 1996;70:8540–8548. doi: 10.1128/jvi.70.12.8540-8548.1996. [DOI] [PMC free article] [PubMed] [Google Scholar]
Associated Data
This section collects any data citations, data availability statements, or supplementary materials included in this article.


