Abstract
We applied the theory of synergies to analyze the processes that lead to unintentional decline in isometric fingertip force when visual feedback of the produced force is removed. We tracked the changes in hypothetical control variables involved in single fingertip force production based on the equilibrium-point hypothesis, namely, the fingertip referent coordinate (RFT) and its apparent stiffness (CFT). The system's state is defined by a point in the {RFT; CFT} space. We tested the hypothesis that, after visual feedback removal, this point (1) moves along directions leading to drop in the output fingertip force, and (2) has even greater motion along directions that leaves the force unchanged. Subjects produced a prescribed fingertip force using visual feedback, and attempted to maintain this force for 15 s after the feedback was removed. We used the “inverse piano” apparatus to apply small and smooth positional perturbations to fingers at various times after visual feedback removal. The time courses of RFT and CFT showed that force drop was mostly due to a drift in RFT towards the actual fingertip position. Three analysis techniques, namely, hyperbolic regression, surrogate data analysis, and computation of motor-equivalent and non-motor-equivalent motions, suggested strong co-variation in RFT and CFT stabilizing the force magnitude. Finally, the changes in the two hypothetical control variables {RFT; CFT} relative to their average trends also displayed covariation. On the whole the findings suggest that unintentional force drop is associated with (a) a slow drift of the referent coordinate that pulls the system towards a low-energy state, and (b) a faster synergic motion of RFT and CFT that tends to stabilize the output fingertip force about the slowly-drifting equilibrium point.
Keywords: finger force, isometric, apparent stiffness, uncontrolled manifold
INTRODUCTION
Unintentional actions by healthy persons are rather common. For example, when a person is asked to walk toward an obstacle and step over it, repeating the task leads to a slow drop in the clearance between the foot and the obstacle, particularly pronounced for the trailing foot, and sometimes the trailing foot hits the obstacle (Heijnen et al. 2012, 2014). Force production in isometric conditions leads to an unintentional slow decline in the force when the subject is deprived of visual feedback (Slifkin et al. 2000; Vaillancourt and Russell 2002). The cited studies invoked limitation of motor memory, fatigue, and boredom as possible contributors to such behaviors. Brain imaging and electrophysiological studies have provided data compatible with the hypothesis that unintentional force drift may be related to working memory (Vaillancourt et al. 2003; Coombes et al. 2011; Poon et al. 2012).
In recent studies (Ambike et al. 2015, 2016a), we have suggested a different conceptual framework to address the phenomena of unintentional changes in performance based on the idea of control of voluntary actions with referent coordinates (RCs) for the involved effectors (Latash 2010; Feldman 2015). According to this idea, the neural control of an action is associated with defining spatial RCs for the salient performance variable (Latash 2010; Feldman 2015). We view the drift in performance as a consequence of natural relaxation processes within the physical/physiological system involved in the action production, consistent with the system seeking a state with minimal potential energy. When visual feedback of the performance is available, such drifts are corrected, and they appear when the visual feedback is removed.
Since all natural movements involve redundant sets of effectors (Bernstein 1967), a relatively low-dimensional set of RCs at the task level is mapped onto larger sets of RCs at hierarchically lower levels. Many such mappings exist, down to the numerous individual muscles involved in typical natural movements. These transformations are organized in a synergic way, meaning that RCs at lower levels show low stability (and high inter-trial variance) in directions that do not affect task RCs and the corresponding performance variables. These directions span the uncontrolled manifold (UCM, Scholz and Schöner 1999) in the space of the lower-level elemental variables (i.e., RCs or effector-specific variables) for those task-specific performance variables (Latash et al. 2007; Latash 2010). Higher stability and lower inter-trial variance are typically observed in directions orthogonal to the UCM (ORT space).
This general scheme allows the analysis of unidirectional action by a single effector, e.g. single-finger force production, as a consequence of two commands, R and C, equivalent to the reciprocal and co-activation commands within the equilibrium-point hypothesis (Feldman 1980, 1986). Note that both R and C are measured in spatial units. However, they may be measured in different units at the level of performance: R is a referent spatial coordinate that the effector would approach in the absence of external constraints, while C is the apparent stiffness of the effector (see Latash 2010; Ambike et al. 2016b). We recently explored inter-trial variation in R and C during constant force production by a finger under continuous visual feedback and found large inter-trial variance in both variables (called RFT and CFT; FT = fingertip) associated with a low variance in total force (Ambike et al. 2016b). In other words, R and C variation was primarily confined to the UCM for the required level of output force.
In the present study, we explored the unintentional force drift phenomenon using the same method of {RFT; CFT} estimation as in the previous study (Ambike et al. 2016b). Our main hypothesis was that the slow drift in fingertip force after visual feedback removal would be associated with drifts in both RFT and CFT variables along the corresponding UCM as well as orthogonal to it. Larger variations along the UCM (i.e., those leading to no change in force) were expected compared to those orthogonal to the UCM (Hypothesis 1A), reflecting lower stability of processes within the UCM. However, these variations were not expected to show consistent directions (along the UCM) across the trials (Hypothesis 1B). In contrast, smaller but consistent variations orthogonal to the UCM would cause a drop in the output force (Hypothesis 2).
Our study was designed based on the ideas of the EP (RC) hypothesis. We see this as a valid approach to testing predictive power of this hypothesis, i.e., making non-trivial predictions and testing them experimentally. At the same time, we explored the specific phenomenon of unintentional force drift within the framework of this hypothesis. Our approach was motivated by the across-trials co-variation of the experimentally reconstructed values of outcome variables reflecting the hypothetical RFT and CFT commands observed in a previous study (Ambike et al. 2016b). To our knowledge, no other hypothesis in the field of motor control would make predictions corresponding to our specific hypotheses, in particular Hypothesis 1B and 2.
To test these hypotheses we asked subjects to produce accurate constant pressing force with a finger under visual feedback and then turned the feedback off. We then applied smooth positional perturbations to the finger with the help of “inverse piano” (Martin et al. 2011a) under the instruction to the subject not to react to the perturbations (as in Feldman 1966; Latash 1994; Ambike et al. 2014). Such perturbations were applied at different time intervals from the moment when the visual feedback had been turned off resulting in samples of {RFT; CFT} data points over the assumed process of force drift. Inter-trial distributions of the {RFT; CFT} data points were explored using three analyses. Based on the previous study (Ambike et al. 2016b), we expected to see large across-trials variation in the {RFT; CFT} data sets, primarily restricted to the corresponding UCM. This was explored using hyperbolic regressions and the surrogate data set analysis (as in Müller and Sternad 2003). We also quantified the magnitude of drifts in the {RFT; CFT} plane in directions along the UCM (motor equivalent, Mattos et al. 2011, 2014) and orthogonal to the UCM (non-motor equivalent). We expected larger drifts along the UCM, estimated across trials, without consistency in the drift direction. In contrast, smaller drifts were expected orthogonal to the UCM consistently directed toward lower force magnitudes. The main hypotheses were explored for two fingers of the dominant hand, the index and the ring finger, chosen as the most and least independently controlled fingers, respectively (Zatsiorsky et al. 2000).
METHODS
Subjects
Twelve healthy subjects voluntarily participated in this study (8 males and 4 females; age: 28.67 ± 5.6 yr., height: 171.82 ± 8.9 cm, weight: 73.9 ± 8.6 kg; mean ± SD). All subjects were right-hand dominant by self-report and had no history of discomfort or injury in the upper arm for the past six months. All subjects provided informed consent in accordance with the procedures approved by the Office for Research Protection of the Pennsylvania State University.
Equipment
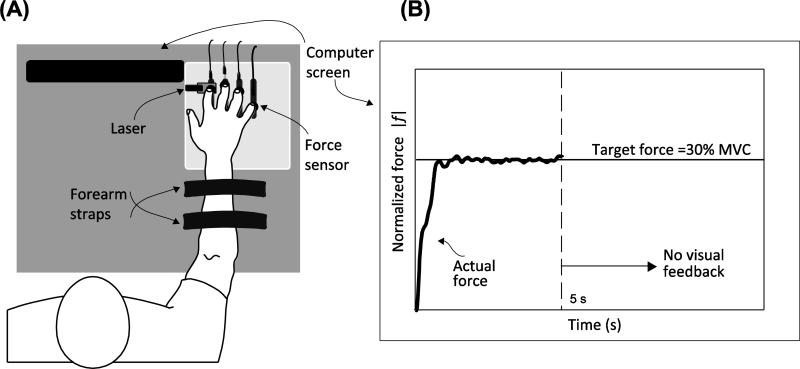
The “inverse piano” device (details in Martin et al. 2011a, b) was used to provide controlled positional displacements of the fingers during the course of the trial (see Procedures). This equipment consists of four unidirectional piezoelectric force sensors (model 208C01, PCB Piezotronics, Depew, NY) connected to linear actuators (PS01- 23 × 80; LinMot, Spreitenbach, Switzerland). The force sensors were mounted within slots in a steel frame (140 × 90 mm), 3-cm apart in the medio-lateral direction and could be adjusted in the anterior-posterior direction to accommodate different hand sizes. The diameter of the sensor was 17 mm. A wooden board (460 × 175 × 27 mm) was attached to the frame to support the subject's arm. Sandpaper (100-grit) was placed on the contact surface of the sensor to increase the friction between the digits and sensors. In addition, a laser sensor was used (resolution, 0.015 mm; AR200-50 M, Schmitt Industries, Portland OR) to record the displacement of the force sensors. The laser was projected onto a reflective surface screwed to the index-finger sensor. The signals from the force transducers were routed through a PCB 484B11 signal conditioner and then digitized along with the laser signal at 200 Hz using a 16-bit National Instruments PCI-6052E analog-to-digital card (National Instruments, Austin, TX). The sensor reading was zeroed with the subject's fingers resting on the sensors with the hand relaxed just before data collection so that the sensors measured only the active normal finger force. A customized LabVIEW program was used for the data acquisition and for subject feedback. Visual feedback was provided by means of a 19-inch monitor placed at 0.8 m in front of the subject. See Figure 1 for a schematic representation of the experimental setup.
Fig. 1.
Experimental setup. Panel A depicts the subject with the fingers resting on the force sensors. Panel B shows the feedback provided to the subject
Procedures
Subjects sat comfortably in a chair with the forearms resting on top of a table. Each subject was allowed to choose a comfortable hand posture such that all the fingers were comfortably extended and rested on four force sensors. The hand posture was consistent across trials. The subjects placed the volar aspect of the distal phalanx of the fingers on force sensors as shown in Figure 1.
We tested the index and the ring finger of the right hand. For each finger, the subject first performed maximum voluntary contractions (MVC). In the MVC trials, the subject was instructed to press on the sensor as hard as possible with the instructed finger, achieve maximal force level within 6 s, and relax immediately after reaching maximal force. The finger force feedback was provided to the subjects. Each subject performed two consecutive attempts with a 30-s rest interval, and the trial with the higher MVC was selected to set the main task.
The main task of the experiment was a continuation task in which subjects were required to press with the instructed finger and match a target force set at 30% MVC, or 0.3 normalized force units (NFU), of that finger. A horizontal line representing the target force was displayed on the screen, and a trace moving from left to right with time indicated the current finger force (Figure 1B). Visual feedback on the finger force was provided for the first 5 s of each trial. Subjects were required to keep producing the same force for a total of 20 s. At certain time instants following visual feedback removal, all fingers were smoothly lifted by 1 cm over 0.5 s, and immediately lowered to the initial position over 0.5 s. The time instants of perturbation initiation were at 0.5 s intervals starting from the 5th second of the trial (when the visual feedback was removed) up to the 19th second of the trial. Thus, there were 29 perturbation instants. Note that only one perturbation was administered per trial, so there were 29 perturbation trials per finger. Subjects were instructed not to interfere voluntarily with the finger motion and possible force changes (cf. Feldman 1966; Latash 1994; Ambike et al. 2014) and to continue pressing on the sensors until the end of the trial with the same effort. At the beginning of the test, subjects practiced both finger conditions to become familiar with the experimental procedures. The test fingers were block randomized across subjects, and the perturbation time was randomized within each finger block.
Finally, subjects performed three repetitions of control trials in which the fingers were not perturbed. Thus, each subject performed a total of 68 trials (4 MVC trials + 6 control trials + 29 perturbation trials × 2 fingers). The entire experiment lasted about 1.5 hours. There was a 20-s break after each perturbation trial, and at least a 3-min enforced rest period between the blocks of 29 trials to avoid fatigue. Additionally, subjects were required to ask for rest if they felt fatigue. None of the subjects reported any fatigue.
Data analysis
MATLAB programs were written for data analysis. The vertical finger forces and the laser signal were filtered using a low-pass, zero-lag, fourth-order Butterworth filter with the cutoff frequency of 5 Hz. All force trajectories were normalized by the corresponding MVC values, and further analysis was conducted on the normalized forces.
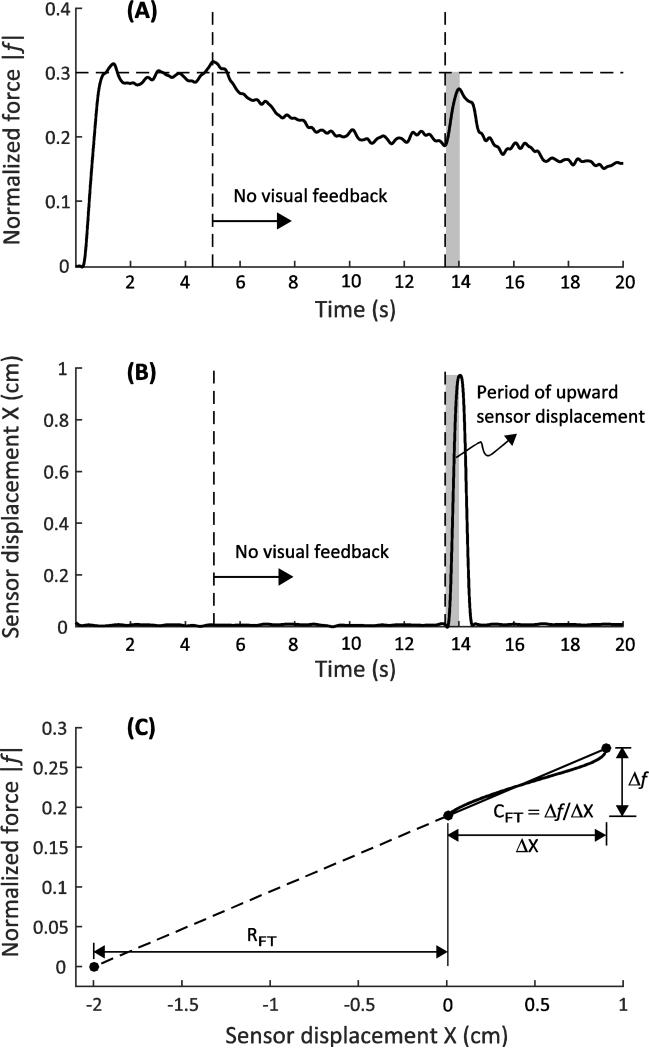
For each trial, the net change in the laser output over the 0.5-s time period of the upward sensor displacement provided the net displacement of the fingertip (ΔX = XFT-final; the initial fingertip coordinate is set to zero by appropriate choice of coordinate frame). This is depicted as the gray area in Figure 2. Note that the initial fingertip position is set to zero with an appropriate choice of the lab-fixed reference frame. The laser signal was used to verify that the sensor displacement was linear over time, although these data are not included in this paper for brevity. The finger-force trajectory over the same time period was measured (Figure 2A; force is positive upward, so absolute value of the normalized force |f| is plotted), and the linearity of the force response with time was quantified with a linear regression (Figure 2C). All selected trials displayed Pearson's correlation R > 0.9.
Fig. 2.
Representative subject response. Panel A shows the force evolution with time, Panel B depicts the sensor position, and Panel C depicts the computation of {RFT: CFT} from the force-displacement data
The net change in the finger force (Δf = |ffinal - finitial|) was computed for each trial. The initial force finitial was obtained as the mean of the fingertip force data over a 50 ms window prior to the onset of the sensor perturbation. The final force ffinal was obtained as the force attained at the end of the upward sensor perturbation. Then, the fingertip apparent stiffness, CFT = Δ f /ΔX, and the fingertip referent coordinate, RFT = − |finitial|/CFT, were computed as depicted in Figure 2C. Note that RFT < 0 because of the choice of coordinate frame.
Once the pair of variables {RFT; CFT} were obtained for each trial, the results were fit using the non-linear regression model RFT × CFT = ffit and the corresponding goodness-of-fit parameter, R2, was computed separately for each finger condition. The regression parameter was obtained by minimizing the sum of squared errors: ffit locally minimizes the function Σ(Ci – ffit/Ri)2. The constant in the fit, ffit, was expected to be close to, but of smaller magnitude than the required force of −0.3 NFU due to the expected drop in fingertip force after visual feedback removal. The negative sign indicates that the fingertip force is produced in the downward direction. Significant hyperbolic regressions indicate that despite the change in the performance variable (force), the two referent variables (RFT and CFT) co-varied across trials to stabilize the fingertip force (Hypothesis 1A).
As a second test of Hypothesis 1A, we employed the method of surrogate data analysis developed by Muller and Sternad (2003). This was done by first pooling the data into three time bins: Initial – 0 to 5 s, Middle – 5 to 10 s, and Final – 10 to 14 s after visual feedback removal, and then permuting the original set of {RFT; CFT} pairs within each time bin to obtain a new surrogate set of {RFT-sur; CFT-sur} separately for each subject, finger condition and time bin. Note that the surrogate set is a sample from the same distribution as the original data, i.e., the mean and variance of the {RFT; CFT} is the same in both sets. The randomization, however, removes the task-specific co-variation within the {RFT; CFT} pairs. The surrogate {RFT-sur; CFT-sur} set was then used to compute the force fsur= RFT-sur × CFT-sur, and its variance Var(fsur). Finally, to minimize the chance of the surrogate data showing co-variation, the above procedure was repeated one hundred times, and the mean of all the force variance values was computed. The force variances between the actual and surrogate sets were compared statistically. Hypothesis 1A predicts that Var(fsur) >> Var(f).
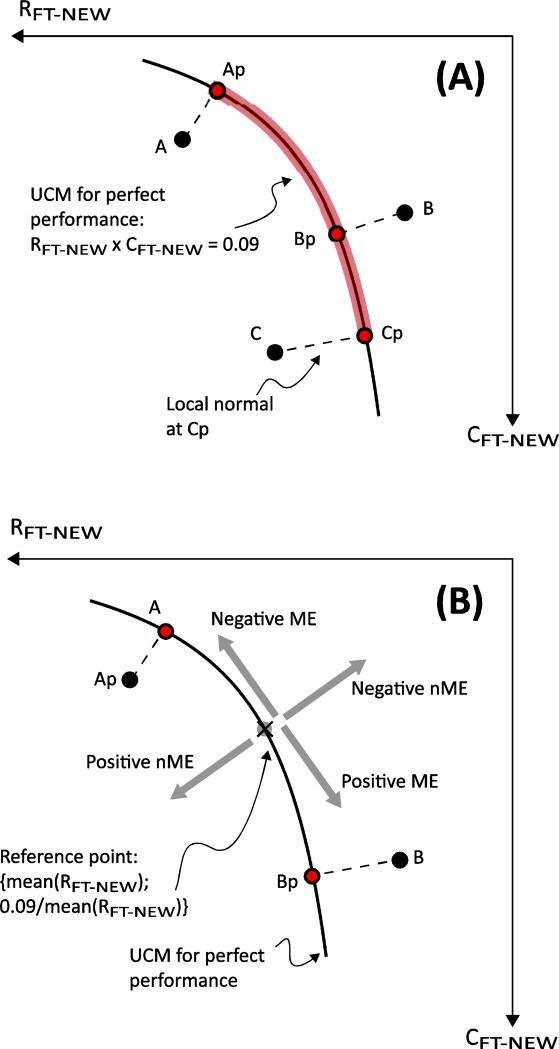
Finally, a third test for the covariation in the referent variables (Hypothesis 1A) was conducted using the motor-equivalence analysis (Mattos et al. 2011, 2014). We first normalized the {RFT; CFT} variables and expressed them both in NFU: RFT-NEW = RFT × mean(CFT), and CFT-NEW = CFT × mean(RFT). To perform the motor-equivalence analysis, we chose the data point at t = 0 s and t = 14 s after the visual feedback removal in the {RFT-NEW; CFT-NEW} space for each finger of each subject. These points were projected onto the UCM for perfect performance: RFT-NEW × CFT-NEW = 0.09 NFU2 (see Figure 3A). The arc-length spanned by the two projected points represents the movement along the UCM, i.e., the ME movement that leaves the output variable (fingertip force) unaltered. Note that the UCM in Figure 3 is different from those in the following figures because of the change of coordinates. The non-motor-equivalent (nME) movement was quantified as the sum of the projection distances if the original points were on the opposite sides of the UCM (e.g., distance(A-Ap) + distance(B-Bp), Figure 3A), and the absolute difference, if they were on the same side of the UCM (e.g., |distance(A-Ap) – distance(C-Cp)|, Figure 3A). Hypothesis 1A predicts that ME > nME.
Fig. 3.
Modified motor equivalence analysis. In Panel A, data points (A, B, and C) are projected onto the UCM for perfect performance (the hyperbolic curve) computed in normalized units. Both axes are measured in normalized force units (see text). The projected points (Ap, Bp, and Cp) minimize the distances from the respective data points. Segments A-Ap, B-Bp, and C-Cp are the local normals to the hyperbola at Ap, Bp, and Cp, respectively. For data points A and C, the motor equivalent (ME) component is the length of the highlighted portion of the UCM between Ap and Cp. The non-motor-equivalent (nME) component is distance A-Ap minus distance C-Cp, since the points A and C are on the same side of the UCM. Conversely, the nME component for the points A and B is distance A-Ap plus distance B-Bp, since the points A and B are on the opposite sides of the UCM. In Panel B, the ME and nME movements are signed. ME distances are computed from the reference point, and nME distances are computed from the UCM. The bottom figure describes the signs assigned to the ME and nME movements. ME movement is computed from a reference point on the UCM, and nME movement is computed as the orthogonal distance from the UCM for perfect performance
To test the nature of the across-trials drifts within the UCM and orthogonal to the UCM (Hypotheses 1B and 2), we adapted the motor-equivalence analysis to quantify the direction of the movements of the data points in the {RFT-NEW; CFT-NEW} plane. Similar to the previous analysis, all data points are first projected onto the UCM for perfect performance: RFT-NEW × CFT-NEW = 0.09 NFU2. However, the ME and nME movements were attributed a sign as shown in Figure 3B. Movements along the UCM (ME), which led the referent fingertip coordinate further away from the actual coordinate, and movements orthogonal to the UCM (nME) that produced a force reduction were both considered negative. (The signs are arbitrary chosen, and changing them has no bearing on the analysis or the ensuing results.) For example, in Figure 3B, distance (A-Ap) is positive, and distance (B-Bp) is negative, and in moving from point Ap to point Bp, the referent coordinate approaches the actual coordinate, so, the ME movement is considered positive. Next, to quantify the pattern in the movements over time, we computed the signed ME movement of each projected data point from a common reference point: {mean(RFT-NEW); 0.09/mean(RFT-NEW)}. This reference point was computed separately for each finger of each subject. Similarly, the nME movement was computed as a signed distance from the UCM for perfect performance. Hypothesis 1B predicts that ME movements at subsequent perturbation times would show large fluctuations about a non-zero value (since, due to the expected drift in the actual data, mean(RFT)× mean(CFT) ≠ −0.3). Hypothesis 2 predicts a smaller-amplitude, unidirectional movement in nME.
Statistics
Data are presented in the text as means and standard errors (SE) unless stated otherwise. To quantify the temporal and the within-finger changes in the referent variables, {RFT; CFT}, the variables were pooled into three time bins: Initial – 0 to 5 s, Middle – 5 to 10 s, and Final – 10 to 14 s after visual feedback removal. The averages within these bins were subjected to a two-way, repeated-measures ANOVA with factors Time points (three levels: Initial, Middle, and Final), and Finger (Index and Ring).
To investigate whether the RFT – CFT distribution represented covariation aimed at stabilizing the finger force (Hypothesis 1A), the variance in the fingertip forces obtained from measurement and those computed with the surrogate data sets (fsur) were subjected to three-way, repeated measures ANOVA with factors Data Type (two levels: original and surrogate), Finger (two levels), and Time points (three levels).
The covariation in the referent variables (Hypothesis 1A) was also analyzed through the motor-equivalence analysis. The ME and nME movement in the {RFT-NEW; CFT-NEW} plane were subjected to a two-way, repeated measures ANOVA with factors Manifold (two levels: ME and nME), and Finger (two levels).
To test if there was a consistent drift along and orthogonal to the UCM (Hypotheses 1B and 2), the signed ME and nME distances in the {RFT-NEW; CFT-NEW} plane were regressed against the perturbation time for each subject and finger condition.
Finally, we explored the local deviations in RFT and CFT by obtaining the difference variables {ΔRFT; ΔCFT} by subtracting the actual variable values from their general trends obtained by exponential fits to the variable-perturbation-time data. The difference variables were regressed against each other for each finger of each subject.
All statistics were performed using an α-level of 0.05. Mauchly's sphericity tests were performed to verify the validity of using repeated-measures ANOVA. The Greenhouse–Geisser adjustment to the degrees of freedom was applied whenever departure from sphericity was observed. Significant effects of ANOVA were further explored using pairwise comparisons with Bonferroni corrections. All statistics were performed with SPSS statistical software.
RESULTS
General patterns of behavior
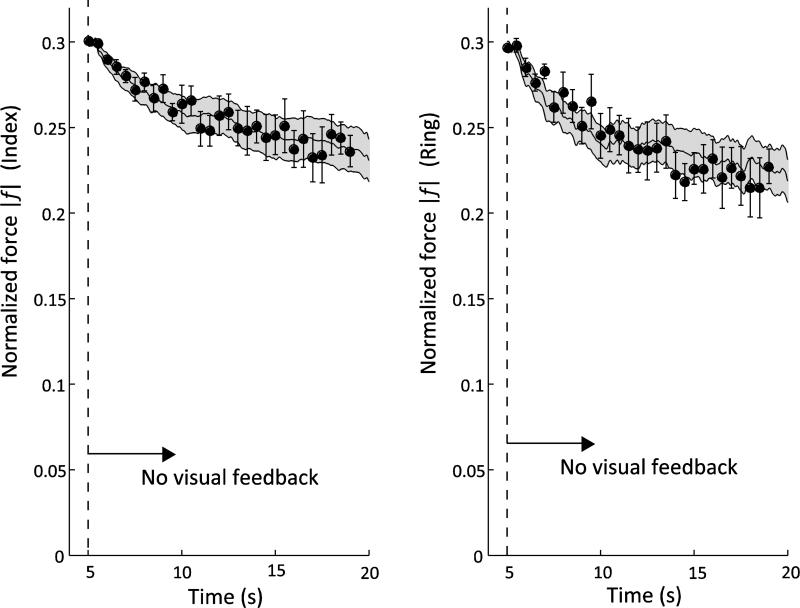
After the visual feedback was turned off, the finger forces during control trials showed an exponential drop. The force-time profiles during the no-feedback phase of the experimental trials with perturbations resembled the force responses during the control trials. Figure 4 shows the across-subject mean and standard error (SE) data of the control trials as the continuous curves and solid bands. The discrete points with error bars represent the across-subject means and SE of the finger force just before the perturbation was administered. There was no significant difference in the force magnitude between the experimental and control trials: p > 0.6, for both index finger and ring finger tasks.
Fig. 4.
Force changes after feedback removal for Index and Ring fingers. The curve and band are the across-subject mean ± SE of the control trials. The solid points with the error bars are the across-subject means ± SE of the forces just before the perturbation was introduced. The force drop in the control trials is exponential for both fingers (Time constant, τ = 5.7 s and 3.4 s for index and ring fingers, respectively)
In the trials with finger perturbations, most force-displacement responses were close to linear. Of the 348 responses for each finger (29 perturbations × 12 subjects), only one trial was rejected for the index finger, and five trials were rejected for the ring finger. The median and the inter-quartile range of the Pearson correlation coefficient for the selected trials were 0.97 and 0.03, respectively.
Temporal changes in referent coordinate and apparent stiffness, {RFT; CFT}
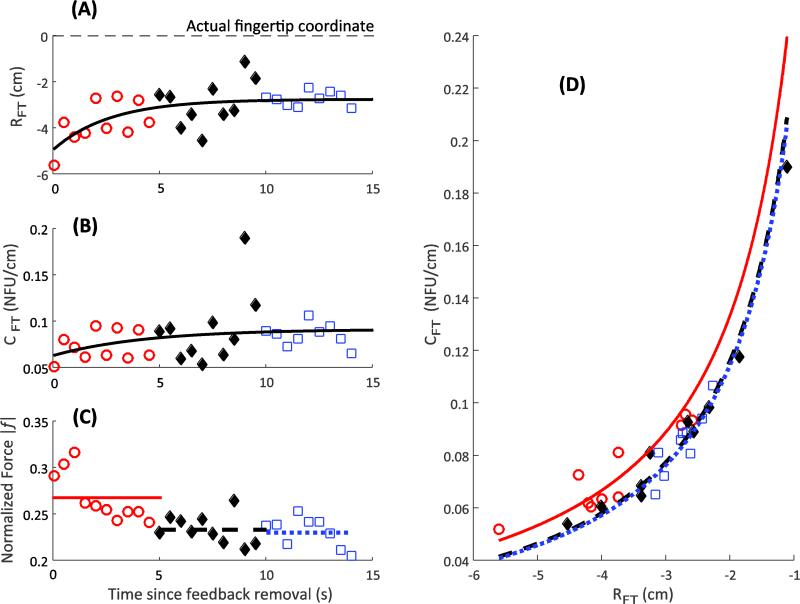
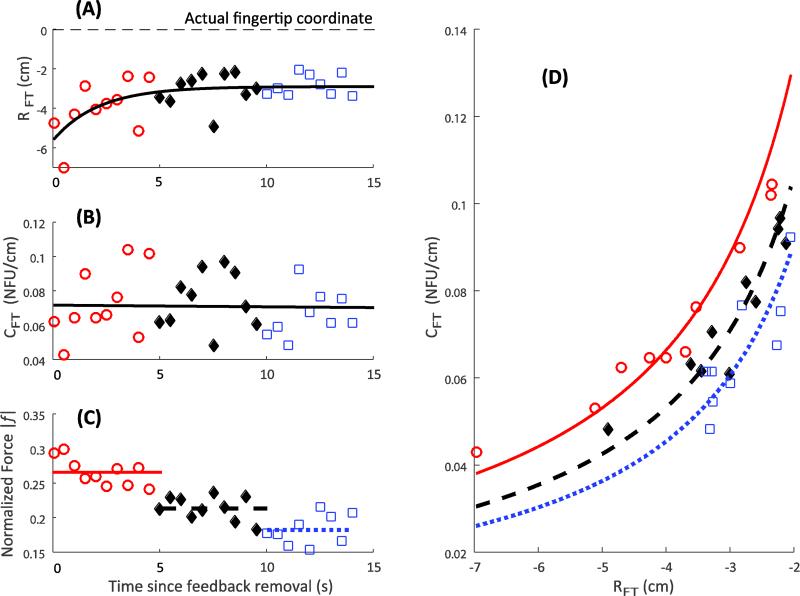
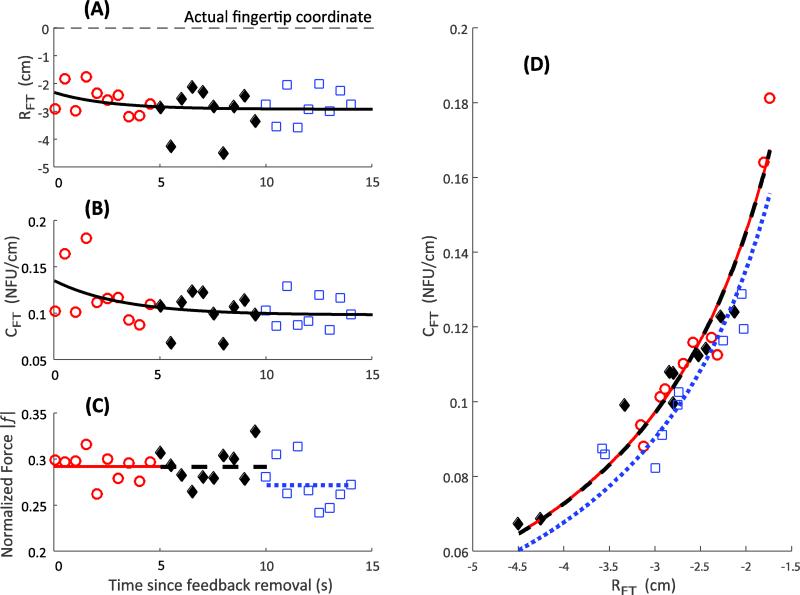
In contrast to the across-subject consistency in the output force profile, the changes in the computed variables {RFT; CFT} showed a few different, subject-specific patterns. The referent coordinate, RFT, typically moved towards the actual fingertip position (Figs 5A and 6A; however, see Fig. 7A). The apparent stiffness, CFT, could increase (Fig. 5B), remain constant (Fig. 6B), and reduce (Fig. 7B). Note that in all the illustrated cases, finger force drops with time (Figs 5C, 6C, and 7C). Panels D in Figures 5-7 illustrate the same data points on the {RFT; CFT} plane with estimates of the uncontrolled manifolds (shown as the three hyperbolic lines). Note the similarities across subjects: the general trend of force to drop – the UCMs shifted down and to the right.
Fig. 5.
Individual subject response. Referent coordinate, R, reduces (Panel A), apparent stiffness, C, increases (Panel B), and the finger force drops (Panel C) with time. The dashed line in Panel A shows the actual location of the fingertip. Panel D depicts the variability in the {R; C} space. Three hyperbolae correspond to the average force over three time bins, depicted in Panel C as dashed lines
Fig. 6.
Individual subject response. Referent coordinate, R, reduces (Panel A), apparent stiffness, C, does not change (Panel B), and the finger force drops (Panel C) with time. The dashed line in Panel A shows the actual location of the fingertip. Panel D depicts the variability in the {R; C} space. Three hyperbolae correspond to the average force over three time bins, depicted in Panel C as dashed lines
Fig. 7.
Individual subject response. The referent coordinate, R, (Panel A), apparent stiffness, C, decreases (Panel B), and the finger force drop (Panel C) with time. The dashed line in Panel A shows the actual location of the fingertip. Panel D depicts the variability in the {R; C} space. Three hyperbolae correspond to the average force over three time bins, depicted in Panel C as dashed lines
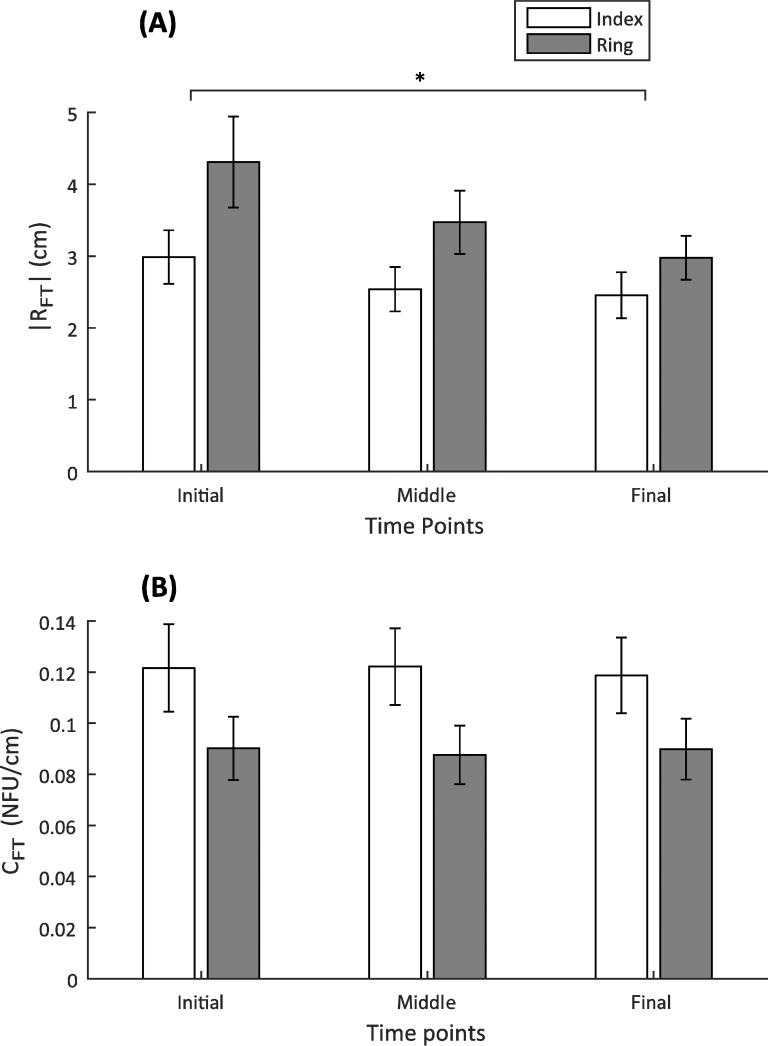
These observations were confirmed by the 2-way, repeated-measures ANOVA on the absolute value of the referent coordinate, |RFT|, and the apparent stiffness, CFT. There was a main effect of Time points [F(1.268,13.949) = 7.194; p < 0.05], and pairwise comparisons revealed a significant difference between the initial and final referent coordinate: |RFT|Initial (3.65 ± 0.48 cm) > |RFT|Final(2.72 ± 0.29 cm) (Figure 8). There was also a difference in the behavior of the two fingers [F(1,11) = 11.106; p < 0.01; |RFT|Index (2.66 ± 0.336 cm) < |RFT|Ring (3.585 ± 0.431 cm)].
Fig. 8.
ANOVA results for the referent coordinate, R, Panel A, and the apparent stiffness, C, Panel B
The apparent stiffness, CFT, displayed no consistent change with time [F(2,22) = 0.151; p = 0.861]. However, there were differences across the two fingers [F(1,11) = 13.244; p < 0.01], with the index finger showing a larger CFT: CFT-Index (0.12 ± 0.02 NFU/cm) > CFT-Ring (0.089 ± 0.01 NFU/cm).
Covariation in {RFT; CFT}
The two variables {RFT; CFT} were expected to display significant spread along the hyperbolic UCM corresponding to the task magnitude of the fingertip force (Hypothesis 1A). However, the drop in force also meant that some variability orthogonal to the UCM was expected. We investigated the covariation in the {RFT; CFT} pair over time using three methods.
First, the equation: RFT × CFT = ffit was fit (hyperbolic fits) to the {RFT; CFT} data for each finger of each subject. The fit parameter ffit yields an estimate of the average force. All fits were significant (p < 0.01), and the median and inter-quartile ranges for R2 of the hyperbolic fits were 0.66 and 0.38, respectively, for the index finger, and 0.68 and 0.18, respectively, for the ring finger. The mean ± SE of ffit were –0.255 ± 0.008 NFU for the index finger, and –0.238 ± 0.009 NFU for the ring finger. The negative sign indicates that the force acts downward, and the force drop is reflected in |ffit| values smaller than 0.3 NFU. Furthermore, note that the R2 values are lower than those found by Ambike et al. (2016) for the same task, but with full visual feedback, reflecting the variability orthogonal to the UCM. However, the R2 values obtained here are still high, thus supporting Hypothesis 1A.
For the second method, we constructed surrogate data sets {Rsur; Csur} by shuffling the order of the {RFT; CFT} pairs within each time bin. Surrogate forces were computed using the shuffled data sets: fsur = Rsur × Csur. The variance in the surrogate forces (Var(fsur)) and in the actual forces (Var(f)) was computed, and the former was an order of magnitude larger than the latter, Var(fsur)(0.012 ± 0.002 NFU2) > Var(f)(0.001± 0.00 NFU2). The 3-way, repeated-measures ANOVA with factors Data type, Finger, and Time points confirmed the effect of Data type: [F(1,11) = 35.533; p < 0.01]. There were also main effects of Finger: [F(1,11) = 7.61; p < 0.05], Var(findex)( 0.004 ± 0.001 NFU2) < Var(fring)(0.009 ± 0002 NFU2), and Time points: [F(2,22) = 10.044; p < 0.01], Var(finitial)(0.01 ± 0.002 NFU2) > Var(ffinal)(0.004 ± 0.001 NFU2). Furthermore, the increase in force variance after surrogation was more pronounced for the ring finger (Finger × Data type [F(1,11) = 6.687; p < 0.05]). Finally, Var(f) increased with time, whereas Var(fsur) decreased with time, which led to the difference in the actual and surrogate force variance to diminish with time (Time points × Data type, F(2,22) = 12.058; p < 0.01).
Third, we analyzed the ME and nME shifts between the first data point (t = 5 s) and the last data point (t = 19 s) in the {RFT-NEW; CFT-NEW} plane (see ‘Methods’ and Figure 3A for details). There was a greater ME shift (0.122 ± 0.022 NFU) compared to the nME shift (0.044 ± 0.006 NFU) confirmed by a main effect of Manifold [F(1,11) = 15.358; p < 0.01] in a two-way, repeated-measures ANOVA with factors Manifold and Finger. There was no Finger effect. (We repeated this analysis by including all data points rather than the extreme data points, and obtained the same statistical result for Manifold. We do not report the longer analysis for brevity).
Patterns of the motor-equivalent (ME) and non-motor-equivalent (nME) movements
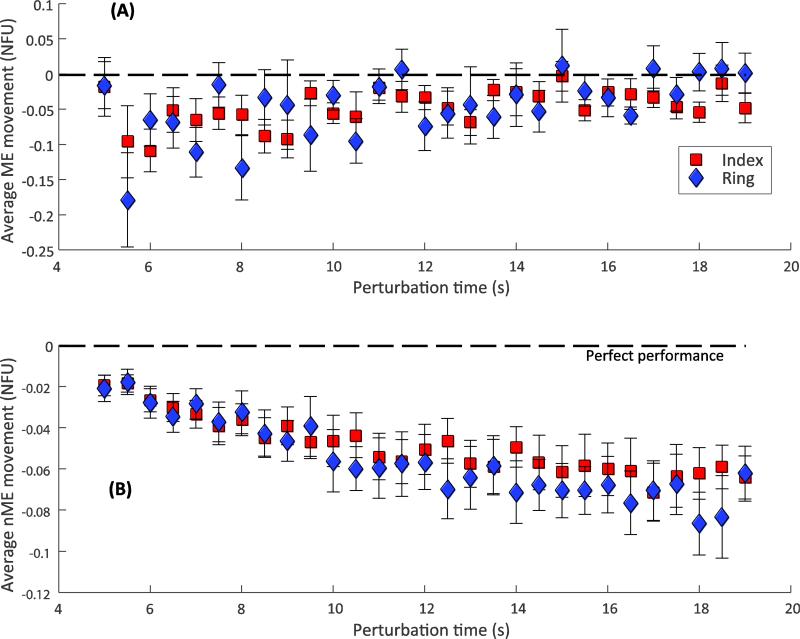
Recall that the ME movement was expected to be larger but show no particular trend over time. In contrast, the nME movement was supposed to be smaller but with a consistent temporal trend (Hypotheses 1B and 2). Both trends across subjects are illustrated in Figure 9. Note that the ME movements (Figure 9A) are larger than the nME movements (Figure 9B), on average, reflected in the different scales of the Y-axes. The ME vs. time regressions yielded significant slopes for three of the 24 cases (12 subjects × 2 fingers) (p < 0.05). In contrast, the nME vs. time regressions yielded significant regressions (p < 0.05) with negative slopes for 18 or the 24 cases. The mean ± SE of the significant slopes were –0.0027 ± 0.00 and –0.0033 ± 0.00 NFU/s for the index and the ring finger nME movements, respectively. The negative slopes indicate that the nME motion moved the fingertip referent coordinate toward its actual coordinate, consistent with a drop in fingertip force. This trend is reflected in Figure 9B.
Fig. 9.
Patterns in the directions of drifts within (Panel A) and orthogonal (Panel B) to the UCM (ME and nME, respectively). Data are mean ± SE computed across subjects
Covariation in {ΔRFT; ΔCFT}
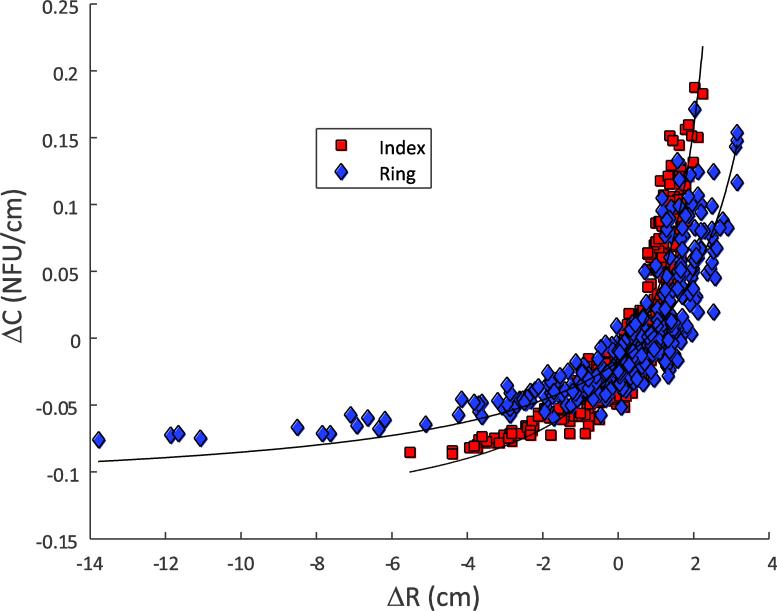
To analyze possible co-variation in the drifts of the two hypothetical control variables, RFT and CFT, we computed the difference between their actual values and the exponential fits to the data series (such as those seen in Figures 4, 5, and 6 A and B). These difference variables {ΔRFT; ΔCFT} also displayed covariation consistent with stabilization of the fingertip force. Hyperbolic regressions for these data were significant (p < 0.01) for all subjects and fingers, and the median and inter-quartile ranges for the R2 values were 0.78 and 0.22 for the index finger and 0.83 and 0.11 for the ring finger, respectively. Figure 10 depicts the {ΔRFT; ΔCFT} data for all subjects. However, this figure plots the deviations in the values from the hyperbolae that are fit to the across-subject averages of the variables {RFT; CFT}.
Fig. 10.
Change in the referent variables from the gross trends in their across-subject, average behavior. Data is from all subjects
DISCUSSION
The main hypotheses formulated in the Introduction have been validated by our data. The high R2 values of the hyperbolic fits to the {RFT; CFT} data, the surrogate data analysis, and the motor-equivalence analysis all support the claim that: (1) as the fingertip force dropped over time after visual feedback removal, the two referent variables displayed larger variability along the UCM than orthogonal to the UCM (Hypothesis 1A), and (2) the movement along the UCM (ME movement) displayed relatively large-amplitude fluctuations without a trend (Hypothesis 1B). In contrast, the movement orthogonal to the UCM (nME movement) was typically of a smaller magnitude and showed a unidirectional trend consistent with a drop in fingertip force (Hypothesis 2).
Additionally, we discovered that the short-time fluctuations {ΔRFT; ΔCFT} displayed significant co-variation that (locally) stabilized the fingertip force. This result suggests that two parallel processes interact to produce the observed behavior. First, there is a slow drift that generates error in the performance, possible induced by a hypothetical process addressed as RC-back-coupling (Wilhelm et al. 2013; Zhou et al. 2014; Ambike et al. 2015; Ambike et al. 2016a). Second, on a shorter time scale, there is co-variation between changes in the two referent variables, RFT and CFT that is primarily confined to the UCM and may be seen as a reflection of a synergy stabilizing the fingertip force (Latash 2008). These finding as well as the differences in the behavior of the index and ring fingers are discussed in more detail below.
Synergic control of performance at the level of referent coordinates
The notion of synergy has been used in the field of motor control for over 100 years (Babinski 1899). The original meaning was something like coordinated motion in several joints; this meaning was adopted and refined by Bernstein (1947) who developed a multi-level scheme of the neural control of movement with one of the levels termed “The level of synergies”. Processes at this level were assumed to participate in the coordination of numerous muscles during typical movements. In the clinical literature, synergy frequently has a negative connotation: it implies stereotypical patterns of muscle activation seen frequently in patients with brain injury (e.g., stroke) that interfere with voluntary movement (DeWald et al. 1995). Recently, the term synergy has been used in the motor control literature to mean a number of variables produced by individual effectors (such as joint rotations, muscle activations, and forces/torques), which show parallel changes in their magnitudes (d'Avella et al. 2003; Ivanenko et al. 2004; Ting and Macpherson 2005). The organization of effector-level (input or elemental) variables into synergies presumably alleviates the famous problem of motor redundancy (Bernstein 1967).
We use the word synergy with a different meaning, which is also related to the motor redundancy issue. This meaning stems from the principle of abundance (Gelfand and Latash 1998; Latash 2012), which views the excess of elemental variables typical of the human motor apparatus as a crucial, useful feature, which allows ensuring stability of salient task variables, and simultaneously avoiding interference among task components that share elemental variables (reviewed in Latash 2008; Latash and Zatsiorsky 2015). This notion is linked tightly to the concepts of task-specific stability (Schöner 1995) and UCM hypothesis (Scholz and Schöner 1999). Synergies represent neural organizations within a high-dimensional space of elemental variables that ensure stability in directions leading to changes in salient performance variables compared to directions that keep these variables unchanged (along the corresponding UCM).
Earlier studies mostly explored synergies in the space of elemental performance variables such as joint rotations, digit forces/moments, and activations of muscle groups (reviewed in Latash and Zatsiorsky 2015). This approach, while productive and insightful, can be criticized because changes in the elemental variables in those studies reflected both central neural processes and interactions of the effectors with the external force fields. The problem is alleviated for studies in isometric conditions when no movement of limb segments is possible. However, even in isometric conditions, changes in muscle activations could lead to changes in the length of muscle fibers leading to changes in reflex-mediated effects.
Recently, a step was taken toward studying synergies within a space of hypothetical control variables (Ambike et al. 2016b). In that study, the authors used the idea that the neural control of movements can be adequately described as setting values (or time profiles) of spatial referent coordinates for the effectors (RC hypothesis, Latash 2010; Feldman 2015). Then, an apparently non-redundant task of producing a single pressing force with one fingertip appears redundant due to the possibility of changing RCs for agonist and antagonist muscle groups. As a result, the same pressing force can be achieved with an infinite number of combinations of RCAGONIST and RCANTAGONIST reflected in combinations of fingertip RC (RFT) and apparent stiffness (CFT). Ambike and colleagues have shown that, indeed, repeating the task several times led to highly variable combinations of RFT and CFT, which kept the force nearly invariant.
In this study, we used several methods to estimate force-stabilizing synergies. Note that, because of the highly non-linear UCM, the most commonly used method of quantifying inter-trial variance along the UCM and orthogonal to the UCM (Latash et al. 2002) is inapplicable. Our first method of hyperbolic regression, based on the predicted shape of the UCM, confirmed the existence of force-stabilizing synergies on average, despite the drift in performance. This result was reinforced by the surrogate-data analysis (Müller and Sternad 2003). The analysis of deviations along the curved UCM (for perfect performance) and orthogonal to that UCM (ME and nME movements; cf. Mattos et al. 2011, 2014), further confirmed synergies in the {RFT; CFT} space stabilizing finger force over the time of its unintentional drift.
As emphasized in the Introduction, our approach is tightly linked to the EP hypothesis. The analysis of the R and C variables in our study and the obtained results are unlikely to reflect computational artifacts or biomechanical factors.
We have utilized the notion of synergies within the UCM hypothesis which assumes two levels of analysis: (1) Redundant (abundant) level of elemental variables, and (2) task-related performance level. Our task and instruction were designed to make force (f) the task-related performance variable. If f and one of the other variables (CFT or RFT) are selected as a pair of elemental variables, the task of this study would be non-redundant with respect to f. Of course, there would still be other tasks that will be defined by redundant mappings, for example, {f; CFT} to RFT or {f; RFT} to CFT. Consider the former case. If the CNS prescribes muscle force, its apparent stiffness (CFT) is expected to co-vary with force (higher apparent stiffness for higher muscle force has been reported in several studies; reviewed in Zatsiorsky and Prilutsky 2012). If RFT is the stabilized performance variable, higher f would cause higher CFT, while higher CFT would cause higher f (for the same RFT!), and we have a positive feedback (unstable) system. Finally, considering force f to be an elemental variable implies adopting the force control formulation of motor control (Hollerbach 1982; Kawato 1999). The set of variables that are directly centrally controlled by the nervous system is a debated issue, and in our view, it is unlikely that the central nervous system specifies force directly. This is because force always depends on external loading conditions, while RFT and CFT, at least theoretically, can be specified by the central nervous system independently of external conditions (see Ostry and Feldman (2003) for a critique of the force control model).
The dependence of apparent stiffness on muscle force could potentially affect the relations among the three variables, CFT, RFT, and f. In a previous study (Ambike et al. 2016b), we explored possible effects of this dependence by analyzing correlations between the initial f value and CFT. Significant correlations were found in only in a handful of cases. We conclude, therefore, that the strong covariation in the {RFT; CFT} space was not due to the CFT(f) dependence.
There was a possibility that the observed strong co-variation between RFT and CFT was due to the two variables being outcomes of a single regression analysis. Then, measurement errors could theoretically lead to co-variation between the two regression parameters. We addressed this issue quantitatively in the previous study (Ambike et al. 2016b), which used the same method to estimate RFT and CFT values, and found no evidence suggesting the presence of such computational artifacts. We, therefore, conclude that the results in this paper indeed suggest the presence of a synergy in the {RFT; CFT} space, even during the unintentional drift in the task variable (f) when the visual feedback is removed.
Synergies stabilizing unintentional force drifts
The phenomenon of unintentional force drift has been originally interpreted as a reflection of a limitation of the working memory with possible contribution of fatigue (Slifkin et al. 2000, Vaillancourt and Russell 2002). This interpretation is compatible with a body of literature describing connections between prefrontal and premotor cortices with the dorsolateral prefrontal cortex and posterior parietal cortex during tasks requiring memory in nonhuman primates (Goldman-Rakic 1988; Selemon and Goldman-Rakic 1988). It has also been corroborated by a series of brain imaging and electroencephalographic studies during continuous and intermittent force production tasks (Vaillancourt et al. 2003; Coombes et al. 2011; Poon et al. 2012).
In recent studies, we have offered a conceptually different view on the unintentional force change (Ambike et al. 2015). This view is based on the idea of movement control with RCs (Latash 2010; Feldman 2015) supplemented with an idea of RC-back-coupling. This latter idea assumes that, when a system is held by an external constraint at a coordinate that differs from its current RC, the RC starts to drift toward the actual coordinate. This may be reflected in force changes in isometric force production tasks (Wilhelm et al. 2013; Reschechtko et al. 2015; Ambike et al. 2015) and in violations of equifinality in multi-joint positional tasks in experiments with transient force perturbations interrupted by a non-zero dwell time (Zhou et al. 2014, 2015).
During voluntary actions, RC is shifted by the central nervous system (CNS), and actual coordinate of the effector follows the RC if such a movement is unimpeded. If the movement is blocked, force production in the direction of RC is observed at the body-environment interface. This process (direct coupling between the actual configuration and the RCs) is usually quick with characteristic times of about 0.1 s defined by the typical neural conduction delays and the electromechanical delay (e.g., Corcos et al. 1992). RC drifts (due to RC-back-coupling) are at least an order of magnitude slower. For example, typical times of RC drift in our experiment was about 5-10 s.
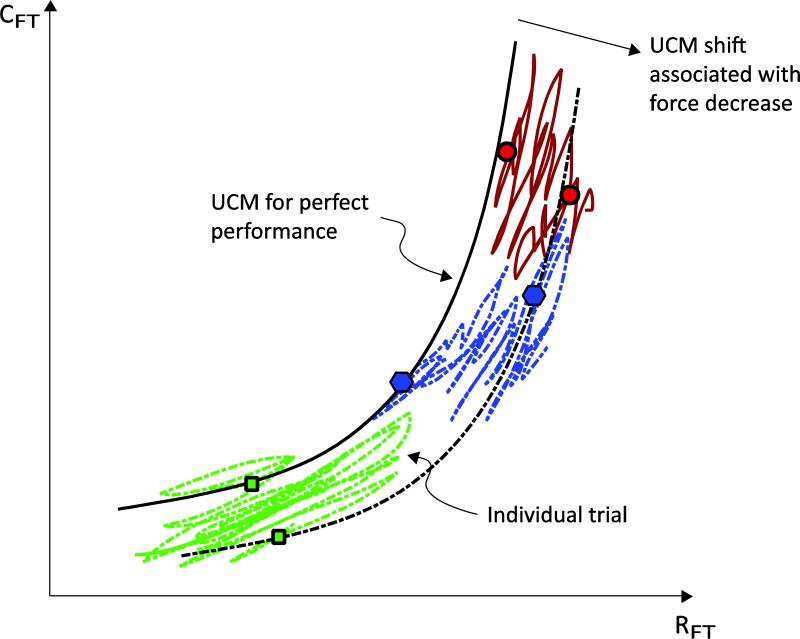
The significant question that this study addresses is: Do synergies in the {RFT; CFT} space stabilize force even as it unintentionally drifts? Note that, by definition, synergies stabilize performance about a set point (or trajectory) – the RC. The recently measured unintentional drifts in performance have cast doubt on the assumption, implicit in most of the previous work in this field, that the RCs themselves are stable. However, it is still plausible that synergic processes stabilize the performance about a drifting RC as time evolves. Figure 11 illustrates our interpretation of the findings of our recent work, including this study. Individual trials start from different {RFT; CFT} combinations with only small deviations from the hyperbolic UCM associated with the required force level (solid hyperbola in Figure 11) (Ambike et al 2016b). Force drift due to the RC drift implies that the associated UCM shifts to a new location, depicted by the dashed hyperbola in Figure 11. The temporal dynamics of a point in the {RFT; CFT} space consists of short-time-span fluctuations along the (shifting) UCM, and slow, unidirectional shift that follows the drift of the UCM.
Fig. 11.
Interpretation of results. Hypothetical trajectories in the {RFT; CFT} space are plotted for different trials. Each trial begins from a different location, but always close to the hyperbola for perfect performance, since visual feedback is available. After feedback removal, the force drops, and the UCM shifts accordingly. The dotted curve represents the UCM at a later time. The individual trial trajectories show large, irregular motion along the shifting UCM, and smaller, consistent motion along the direction of force drop
The three analyses for Hypothesis 1A (hyperbolic fitting, surrogate force analysis, and the ME-nME analysis) indicate the existence of fingertip-force-stabilizing synergy over the entire time span of the force drift. This may be because force drift saturates with time (Slifkin et al. 2000; Vaillancourt and Russell 2002; Ambike et al. 2015, 2016a; Heinen et al. 2012, 2014), thus limiting the magnitude of the nME drift. However, the force drop is also proportional to the force produced when the feedback is turned off (Slifkin et al. 2000; Vaillancourt and Russell 2002; Ambike et al 2015, 2016a). In future, we plan to investigate if the synergies survive higher initial forces: It is possible that the ME component would also increase with the initial force value. The negative co-variation of the difference variables {ΔRFT; ΔCFT} points at the short-time force-stabilizing synergy. This process ensures that the local fluctuations in the {RFT; CFT} space are mostly confined to the UCM associated with the current RCs.
These observations also suggest that the unintentional processes leading to the force drift do not interfere with the synergic organization responsible for the large inter-trial variability in the data points, which keeps all the points close to the UCM. In other words, the shifting RC was an input into a hierarchically lower system responsible for the synergy. The synergy was likely organized based on within-the-CNS back-coupling loops as suggested earlier (Latash et al. 2005). It was unlikely to be based on signals from sensory receptors, because the force-sensitive receptors were clearly unable to prevent the force drift and, hence, are also unlikely to play a central role in force-stabilizing synergies.
One of our exploratory goals was to quantify synergies and their changes with force drift between two fingers, the index finger and the ring finger, selected as those showing minimal and maximal dependence on forces produced by other fingers of the hand (enslaving, Zatsiorsky et al. 1998, 2000). The ring finger displayed greater apparent stiffness (CFT) than the index finger (Figure 8B), and also generated more force variance than the index finger (compatible with Gorniak et al. 2008). The two findings are consistent if one assumes that most finger force variance comes from variance in RFT.
Concluding Comments
Several assumptions of our study have to be validated better. These include the linear behavior of the fingertip force, extrapolation of the force-displacement data, and the verification that our subjects indeed “did not intervene” during the perturbation. These concerns have been addressed in some detail in Ambike et al (2016b).
We also point out the modifications made to the traditional ME-nME analysis. In the past, this analysis has been conducted (1) in input-variable spaces where all axes have the same units, and (2) with a linear or linearized UCM. Therefore, we first normalized the {RFT; CFT} variables and expressed them both in NFU: RFT-NEW = RFT × mean(CFT), and CFT-NEW = CFT × mean(RFT). This yields the UCM for perfect performance as: RFT-NEW × CFT-NEW = 0.09 NFU2 , since with perfect performance, mean(RFT) × mean(CFT) = −0.3. Second, the non-motor-equivalent (nME) component cannot be computed along a unique, linear or non-linear manifold. The unique normal to the hyperbola at the projected point (e.g., segment A-AP in Figure 3), however, represents the direction corresponding to no movement (locally) along the hyperbolic UCM. Therefore, the nME components were computed as signed sums of the normal distances.
Finally, we note that all our data were collected across trials. The across-trial design magnifies the within-UCM variance via different initial conditions. These differences may magnify as time progresses, given the nonlinear nature of the system. We assume that this sampling technique provides a reasonable account of processes that function within individual trials. However, development of experimental techniques that will sample these processes within a single trial is not only desirable, but it remains a significant challenge. The difficulty stems from trying to maintain “non-intervention” by the subject over multiple perturbations.
Despite the mentioned limitations, we believe that this paper represents a significant step toward utilizing the theoretical frameworks of the UCM and referent configuration hypotheses to analyze motor phenomena such as unintentional drifts in performance.
ACKNOWLEDGMENT
The study was in part supported by NIH Grants NS-035032 and AR-048563.
REFERENCES
- Ambike S, Mattos D, Zatsiorsky VM, Latash ML. The nature of constant and cyclic force production: unintentional force-drift characteristics. Exp Brain Res. 2016a;234:197–208. doi: 10.1007/s00221-015-4453-z. [DOI] [PubMed] [Google Scholar]
- Ambike S, Mattos D, Zatsiorsky VM, Latash ML. Synergies in the space of control variables within the equilibrium-point hypothesis. Neurosci. 2016b;315:150–161. doi: 10.1016/j.neuroscience.2015.12.012. [DOI] [PMC free article] [PubMed] [Google Scholar]
- Ambike S, Zatsiorsky VM, Latash ML. Processes underlying unintentional finger-force changes in the absence of visual feedback. Exp Brain Res. 2015;233:711–721. doi: 10.1007/s00221-014-4148-x. [DOI] [PubMed] [Google Scholar]
- Ambike S, Paclet F, Zatsiorsky VM, Latash ML. Factors affecting grip force: anatomy, mechanics, and referent configurations. Exp Brain Res. 2014;232:1219–1231. doi: 10.1007/s00221-014-3838-8. [DOI] [PMC free article] [PubMed] [Google Scholar]
- Babinski F. De l'asynergie cerebelleuse. Revue Neurologique. 1899;7:806–816. [Google Scholar]
- Bernstein NA. On the Construction of Movements. Medgiz; Moscow (in Russian): 1947. [Google Scholar]
- Bernstein N. The coordination and regulation of movements. Oxford. Pergamon Press; 1967. [Google Scholar]
- Coombes SA, Corcos DM, Vaillancourt DE. Spatiotemporal tuning of brain activity and force performance. Neuroimage. 2011;54:2226–2236. doi: 10.1016/j.neuroimage.2010.10.003. [DOI] [PMC free article] [PubMed] [Google Scholar]
- Corcos DM, Gottlieb GL, Latash ML, Almeida GL, Agarwal GC. Electromechanical delay: An experimental artifact. J Electromyography Kinesiology. 1992;2:59–68. doi: 10.1016/1050-6411(92)90017-D. [DOI] [PubMed] [Google Scholar]
- d'Avella A, Saltiel P, Bizzi E. Combinations of muscle synergies in the construction of a natural motor behavior. Nature Neurosci. 2003;6:300–308. doi: 10.1038/nn1010. [DOI] [PubMed] [Google Scholar]
- DeWald JP, Pope PS, Given JD, Buchanan TS, Rymer WZ. Abnormal muscle coactivation patterns during isometric torque generation at the elbow and shoulder in hemiparetic subjects. Brain. 1995;118:495–510. doi: 10.1093/brain/118.2.495. [DOI] [PubMed] [Google Scholar]
- Feldman AG. Referent control of action and perception: challenging conventional theories in behavioral science. Springer; NY: 2015. [Google Scholar]
- Feldman AG. Superposition of motor programs. I. Rhythmic forearm movements in man. Neurosci. 1980;5:81–90. doi: 10.1016/0306-4522(80)90073-1. [DOI] [PubMed] [Google Scholar]
- Feldman AG. Once more on the equilibrium-point hypothesis (λ-model) for motor control. J Mot Behav. 1986;18:17–54. doi: 10.1080/00222895.1986.10735369. [DOI] [PubMed] [Google Scholar]
- Feldman AG. Functional tuning of the nervous system with control of movement or maintenance of a steady posture. II. Controllable parameters of the muscle. Biophysics. 1966;11:565–578. [Google Scholar]
- Gelfand IM, Latash ML. On the problem of adequate language in motor control. Mot Control. 1998;2(4):306–313. doi: 10.1123/mcj.2.4.306. [DOI] [PubMed] [Google Scholar]
- Goldman-Rakic PS. Topography of cognition: parallel distributed networks in primate association cortex. Ann Rev Neurosci. 1988;11:137–156. doi: 10.1146/annurev.ne.11.030188.001033. [DOI] [PubMed] [Google Scholar]
- Gorniak SL, Duarte M, Latash ML. Do synergies improve accuracy? A study of speed-accuracy trade-offs during finger force production. Mot Control. 2008;12:151–172. doi: 10.1123/mcj.12.2.151. [DOI] [PMC free article] [PubMed] [Google Scholar]
- Hollerbach JM. Computers, brains and the control of movement. Trends Neurosci. 1982;6:189–192. [Google Scholar]
- Heijnen MJ, Romine NL, Stumpf DM, Rietdyk S. Memory-guided obstacle crossing: more failures were observed for the trail limb versus lead limb. Exp Brain Res. 2014;232:2131–2142. doi: 10.1007/s00221-014-3903-3. [DOI] [PubMed] [Google Scholar]
- Heijnen MJ, Muir BC, Rietdyk S. Factors leading to obstacle contact during adaptive locomotion. Exp Brain Res. 2012;223:219–231. doi: 10.1007/s00221-012-3253-y. [DOI] [PubMed] [Google Scholar]
- Ivanenko YP, Poppele RE, Lacquaniti F. Five basic muscle activation patterns account for muscle activity during human locomotion. J Physiol. 2004;556:267–82. doi: 10.1113/jphysiol.2003.057174. [DOI] [PMC free article] [PubMed] [Google Scholar]
- Kawato M. Internal models for motor control and trajectory planning. Curr Opin Neurobiol. 1999;9:718–727. doi: 10.1016/s0959-4388(99)00028-8. [DOI] [PubMed] [Google Scholar]
- Latash ML. Reconstruction of equilibrium trajectories and joint stiffness patterns during single-joint voluntary movements under different instructions. Biol Cybern. 1994;71:441–450. doi: 10.1007/BF00198920. [DOI] [PubMed] [Google Scholar]
- Latash ML. Synergy. Oxford University Press; New York: 2008. [Google Scholar]
- Latash ML. Motor synergies and the equilibrium point hypothesis. Mot Control. 2010;14:294–322. doi: 10.1123/mcj.14.3.294. [DOI] [PMC free article] [PubMed] [Google Scholar]
- Latash ML. The bliss (not the problem) of motor abundance (not redundancy). Exp Brain Res. 2012;217:1–5. doi: 10.1007/s00221-012-3000-4. [DOI] [PMC free article] [PubMed] [Google Scholar]
- Latash ML, Scholz JP, Schöner G. Motor control strategies revealed in the structure of motor variability. Exercise and Sport Sci Rev. 2002;30:26–31. doi: 10.1097/00003677-200201000-00006. [DOI] [PubMed] [Google Scholar]
- Latash ML, Scholz JP, Schoner G. Towards a new theory of motor synergies. Mot Control. 2007;11:276–308. doi: 10.1123/mcj.11.3.276. [DOI] [PubMed] [Google Scholar]
- Latash ML, Shim JK, Smilga AV, Zatsiorsky VM. A central back-coupling hypothesis on the organization of motor synergies: A physical metaphor and a neural model. Biol Cybern. 2005;92:186–191. doi: 10.1007/s00422-005-0548-0. [DOI] [PMC free article] [PubMed] [Google Scholar]
- Latash ML, Zatsiorsky VM. Biomechanics and Motor Control: Defining Central Concepts. Academic Press; New York, NY: 2016. [Google Scholar]
- Martin JR, Budgeon MK, Zatsiorsky VM, Latash ML. Stabilization of the total force in multi-finger pressing tasks studied with the ‘inverse piano’ technique. Hum Mov Sci. 2011a;30:446–458. doi: 10.1016/j.humov.2010.08.021. [DOI] [PMC free article] [PubMed] [Google Scholar]
- Martin JR, Zatsiorsky VM, Latash ML. Multi-finger interaction during involuntary and voluntary single finger force changes. Exp Brain Res. 2011b;208:423–435. doi: 10.1007/s00221-010-2492-z. [DOI] [PMC free article] [PubMed] [Google Scholar]
- Mattos D, Latash ML, Park E, Kuhl J, Scholz JP. Unpredictable elbow joint perturbation during reaching results in multijoint motor equivalence. J Neurophysiol. 2011;106:1424–1436. doi: 10.1152/jn.00163.2011. [DOI] [PMC free article] [PubMed] [Google Scholar]
- Mattos D, Schoner G, Zatsiorsky VM, Latash ML. Motor equivalence during multi-finger force production. Exp Brain Res. 2014;233:487–502. doi: 10.1007/s00221-014-4128-1. [DOI] [PMC free article] [PubMed] [Google Scholar]
- Muller H, Sternad D. A randomization method for the calculation of co-variation in multiple nonlinear relations: illustrated with the example of goal-directed movements. Biol Cybern. 2003;89:22–33. doi: 10.1007/s00422-003-0399-5. [DOI] [PubMed] [Google Scholar]
- Ostry DJ, Feldman AG. A critical evaluation of the force control hypothesis in motor control. Exp Brain Res. 2003;153:275–288. doi: 10.1007/s00221-003-1624-0. [DOI] [PubMed] [Google Scholar]
- Poon C, Chin-Cottongim LG, Coombes SA, Corcos DM, Vaillancourt DE. Spatiotemporal dynamics of brain activity during the transition from visually guided to memory-guided force control. J Neurophysiol. 2012;108:1335–1348. doi: 10.1152/jn.00972.2011. [DOI] [PMC free article] [PubMed] [Google Scholar]
- Reschechtko S, Zatsiorsky VM, Latash ML. Task-specific stability of multifinger steady-state action. J Mot Behav. 2015;47:365–377. doi: 10.1080/00222895.2014.996281. [DOI] [PMC free article] [PubMed] [Google Scholar]
- Scholz JP, Schoner G. The uncontrolled manifold concept: Identifying control variables for a functional task. Exp Brain Res. 1999;126:289–306. doi: 10.1007/s002210050738. [DOI] [PubMed] [Google Scholar]
- Schoner G. Recent developments and problems in human movement science and their conceptual implications. Ecological Psychology. 1995;8:291–314. [Google Scholar]
- Selemon LD, Goldman-Rakic PS. Common cortical and subcortical targets of the dorsolateral prefrontal and posterior parietal cortices in the rhesus monkey: evidence for a distributed neural network subserving spatially guided behavior. J Neurosci. 1988;8:4049–4068. doi: 10.1523/JNEUROSCI.08-11-04049.1988. [DOI] [PMC free article] [PubMed] [Google Scholar]
- Slifkin AB, Vaillancourt DE, Newell KM. Intermittency in the control of continuous force production. J Neurophysiol. 2000;84:1708–1718. doi: 10.1152/jn.2000.84.4.1708. [DOI] [PubMed] [Google Scholar]
- Ting LH, Macpherson JM. A limited set of muscle synergies for force control during a postural task. J Neurophysiol. 2005;93:609–613. doi: 10.1152/jn.00681.2004. [DOI] [PubMed] [Google Scholar]
- Vaillancourt DE, Russell DM. Temporal capacity of short-term visuomotor memory in continuous force production. Exp Brain Res. 2002;145:275–285. doi: 10.1007/s00221-002-1081-1. [DOI] [PubMed] [Google Scholar]
- Vaillancourt DE, Thulborn K, Corcos DM. Neural Basis for the Processes That Underlie Visually Guided and Internally Guided Force Control in Humans. J Neurophysiol. 2003;90:3330–3340. doi: 10.1152/jn.00394.2003. [DOI] [PubMed] [Google Scholar]
- Wilhelm L, Zatsiorsky VM, Latash ML. Equifinality and its violations in a redundant system: multi-finger accurate force production. J Neurophysiol. 2013;110:1965–1973. doi: 10.1152/jn.00461.2013. [DOI] [PMC free article] [PubMed] [Google Scholar]
- Zatsiorsky VM, Li ZM, Latash ML. Enslaving effects in multi-finger force production. Exp Brain Res. 2000;131:187–195. doi: 10.1007/s002219900261. [DOI] [PubMed] [Google Scholar]
- Zatsiorsky VM, Li Z-M, Latash ML. Coordinated force production in multi-finger tasks. Finger interaction and neural network modeling. Biol Cybern. 1998;79:139–150. doi: 10.1007/s004220050466. [DOI] [PubMed] [Google Scholar]
- Zhou T, Solnik S, Wu Y-H, Latash ML. Unintentional movements produced by back-coupling between actual and referent body configurations: Violations of equifinality in multi-joint positional tasks. Exp Brain Res. 2014;232:3847–3859. doi: 10.1007/s00221-014-4059-x. [DOI] [PMC free article] [PubMed] [Google Scholar]
- Zhou T, Zhang L, Latash ML. Intentional and unintentional multi-joint movements: their nature and structure of variance. Neurosc. 2015;289:181–193. doi: 10.1016/j.neuroscience.2014.12.079. [DOI] [PMC free article] [PubMed] [Google Scholar]


