Abstract
The objective of this study was to investigate the spatial and temporal variations of water content in intervertebral discs during degeneration and repair processes. We hypothesized that the patterns of water content distribution in the discs are related to the intensity patterns observed in T2-weighted MRI images. Water content distributions in the mildly (e.g., 80% viable cells in the disc, 2.3% decrease in disc height) and moderately (e.g., 40% viable cells in the disc, 9.3% decrease in disc height) degenerated discs were predicted using a finite element model. The variation of water content in the degenerated discs treated with three biological therapies [i.e., increasing the cell density in the NP (Case I), increasing glycosaminoglycan synthesis rate in the nucleus pulposus (Case II), and decreasing glycosaminoglycan degradation rate in the nucleus pulposus (Case III)] were also predicted. It was found that two patterns of water content distributions, a horizontal region with lower water content at the mid-axial plane of nucleus pulposus and a spot with higher water content at the posterior region, were shown during the degeneration progress for the disc simulated in this study. These two patterns disappeared after treatment in Case I, but in Case II and Case III. The implication of these patterns for the horizontal gray band and high intensity zone in T2-weighted MRI images was discussed. This study provided new guidance to develop a novel method for diagnosing disc degeneration and assessing outcomes of biological therapies with MRI techniques.
Keywords: Finite element model, Disc repair, Biological therapy, Gray band, High intensity zone
Introduction
The intervertebral disc (IVD) is the largest avascular structure in the human body and it functions to support mechanical loading and to provide flexibility to the spine system. The most common biochemical characteristics of intervertebral disc degeneration are the loss of glycosaminoglycan (GAG) and the decrease of water content.1
The three major causes for disc degenerations are nutrition deprivation, inappropriate mechanical loading, and genetic factors.2 How each of these causal factors leads to the various patterns (e.g., the spatial distributions of matrix components) in discs during degenerative progression remains unknown. That is, it is difficult to correlate a specific disc degeneration pattern to a certain cause. Investigation of these patterns is important for developing a new method to detect disc degeneration at its early stage, as well as for assessing outcomes of disc repair with biological therapies, including implanting cells, enhancing matrix synthesis, and inhibiting matrix degradation.3–5
Magnetic resonance imaging (MRI) techniques (e.g., T1- and T2-weighted images) are widely used in estimating the degeneration stage of human discs. For example, Pfirrmann scoring is a scaling method to grade the disc degeneration stages based on T2-weighted MRI images.6 It is reported that a horizontal gray band (i.e., a band with lower signal intensity near the mid-axial plane in the disc) seen in the T2-weighted MRI images of degenerated discs is an indication for degeneration stages of disc.6 The exact pathology for the ‘band-like’ pattern is unclear. A “bright spot” in the posterior region of the disc seen in T2-weighted MRI images, known as High Intensity Zone (HIZ), is another characteristic of disc degeneration.7–10 Some researchers reported that the HIZ was a reliable marker for annular tears in painful discs,7–9; 11 whereas others found the HIZ also appeared in asymptomatic subjects without annular tears.10; 12 The mechanisms for the occurrence of the HIZ in the degenerated discs with annular tears are generally thought to be caused by inflammation and/or neovascularization into that region.11; 13 However, the occurrence of HIZ in the degenerated discs without annular tears is unclear.
Since the principal source of MRI-sensitive protons in the disc is water, we hypothesized that the patterns of water content distribution in the discs are related to the intensity patterns observed in T2-weighted MRI images. As a first step to test this hypothesis, in this study, we aimed to investigate variations of water content distribution in the disc during degenerative progression and repair processes. Knowledge of water content distribution is important for understanding degenerative patterns seen in MRI images and may provide guidance to develop a new quantitative method for detecting early disc degeneration.
Methods
A finite element model for human lumbar disc was used for this study.14 This finite element method was developed based on the cell-activity-coupled mechano-electrochemical theory for intervertebral discs.14; 15 The details of the finite element model can be found in our previous studies.14–16 Briefly, the disc was modeled as an mixture of solid phase, fluid phase, and solute phase based on the triphasic continuum mixture theory.17 The coupling phenomena among tissue deformation, transport of fluid and solutes, and electro-osmotic effects were modeled. The cell viability was dependent on local glucose level, and the GAG content was dependent on cell density, GAG synthesis rate and degradation rate [see Table 1 of Zhu et al (2015) for details].14; 18 This model is able to predict the distributions of cell density, oxygen tension, glucose concentration, lactate concentration, pH value, GAG content, ion concentrations, fluid pressure, water content, stresses and strains of the solid matrix, and tissue deformation in the disc. Moreover, this model has been validated by comparing model predictions of water content and GAG content distributions with those from experiments.14; 16
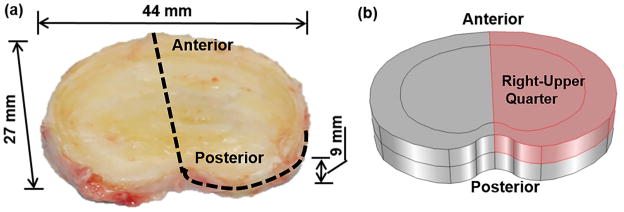
The geometry of the disc was generated based on a human L2-3 disc (41 years old male, non-degenerated,15; 19 Fig. 1a). The disc was modeled as an inhomogeneous structure with two regions: nucleus pulposus (NP) and annulus fibrosus (AF). Due to symmetry, only the upper-right quarter of the disc was simulated (Fig. 1b). The mesh in the model contained 7888 hexahedral elements. The finite element model of the disc was developed with COMSOL (COMSOL 4.3b, COMSOL Inc. MA) based on the method developed by Sun et al. (1999).20 Disc at the healthy state before degeneration was chosen as the reference configuration.
Figure 1.
(a) Geometry of a human lumbar disc (L2-3, male, non-degenerated)19 and (b) its upper-right quarter were used for simulations.
The mechanical properties (Lame constants λ and μ) used in the study were λ=0.39 MPa and μ=0.01 MPa for the NP region, and λ linearly increased from 0.39 to 1.01 MPa and μ linearly increased from 0.01 to 0.29 MPa from the innermost AF region to the outermost AF region.21–23 Cell density was 4000 cells/mm3 in NP and 9000 cells/mm3 in AF, which were taken from experimental data measured in mature, healthy discs.24 Fixed charge density (FCD) and water content in the mature, healthy disc were also extracted from experimental data in the literature:25 that is, fixed charge density was assumed to be homogeneous with a value of 0.34 M in the NP, and linearly decreased from 0.34 to 0.16 M from the innermost AF region to the outermost AF region. Water content (i.e., volume fraction of water) was 0.85 (water volume over tissue volume) in the NP, and linearly decreased from 0.85 to 0.70 from the innermost AF region to the outermost AF region. More information on material properties, initial and boundary conditions can be found in Zhu et al (2014).16
In this study, the effect of cartilage endplate (CEP) on nutrition supply was considered by adjusting the boundary conditions for nutrients at the interface between NP and CEP (to save computational time),16 in order to account for the changes in solute diffusivity and hydraulic permeability in CEP seen in mildly and moderately degenerated discs.26; 27 More specifically, the following nutrition boundary conditions were used for the heathy disc: 3.20 mM for the glucose concentration and 3.60 kPa for the oxygen tension on the NP surface (adjacent to the CEP), and 5.00 mM for the glucose concentration and 5.80 kPa for the oxygen tension on the AF periphery.14; 16; 28 The degenerated disc models (without annular tears) were virtually created by reducing the nutrition levels at the disc boundary. For generating a mildly degenerated disc, the glucose concentration was reduced to 1.12 mM and oxygen tension to 1.25 kPa on the NP surface (adjacent to the CEP), and the glucose concentration was reduced to 1.40 mM, oxygen tension to 1.62 kPa on the AF periphery. For generating a moderately degenerated disc, the glucose concentration was reduced to 0.64 mM and oxygen tension to 0.71 kPa on the NP surface (adjacent to the CEP), and the glucose concentration was reduced to 1.00 mM and oxygen tension to 1.16 kPa on the AF periphery. The degeneration processes for both mildly and moderately degenerated discs due to insufficient nutrient supply were simulated (Figs. 2 and 3).
Figure 2.
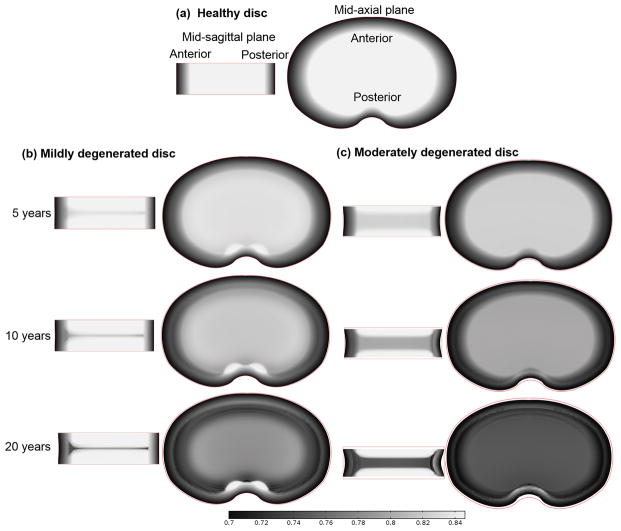
(a) Water content (water volume over tissue volume) distribution in the healthy disc at the mid-sagittal plane (Left) and at the mid-axial plane (Right). Change of water content distribution with time (b) in the mildly degenerated disc and (c) in the moderately degenerated disc (both without therapies). Discs with 10 years of degeneration were treated with biological therapies (see Figs. 4–6) and discs with 20 years of degeneration (last row) served as a control for treated discs (see Figs. 4–6).
Figure 3.
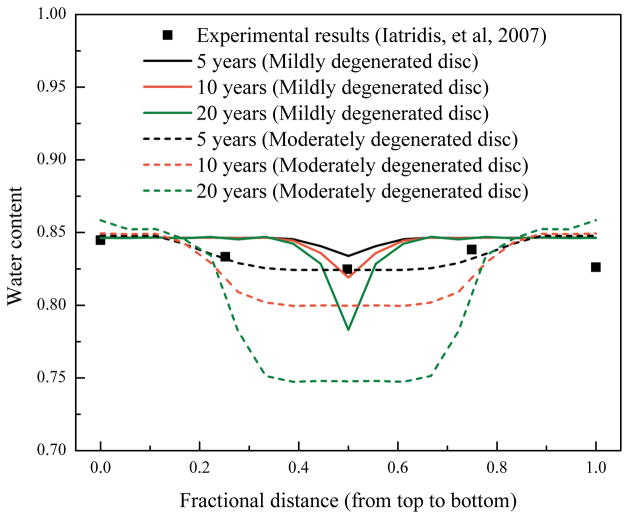
Predicted variations of water content (water volume over tissue volume) distributions along the axial direction at the center of NP, and comparison with an experimental measurement.29
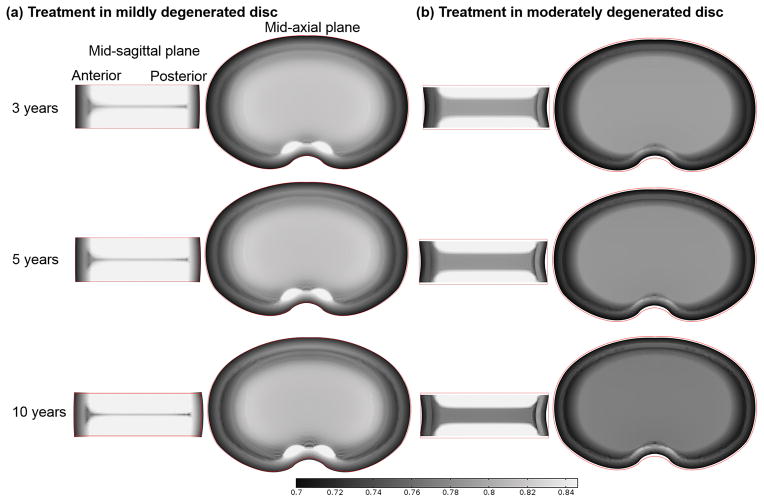
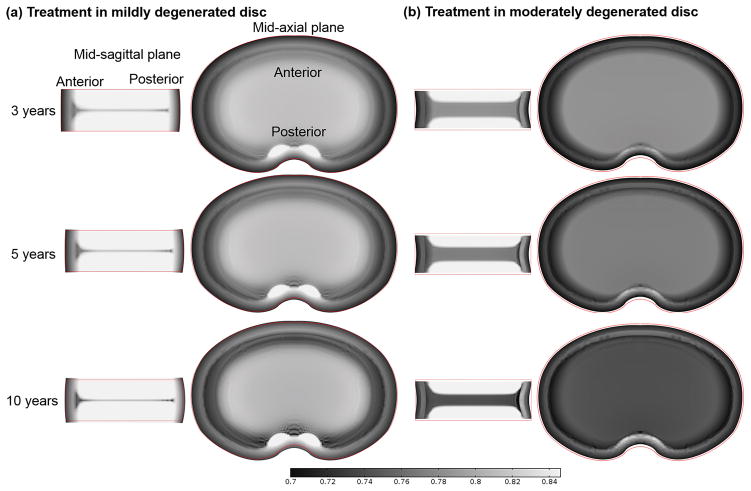
The discs at 10th year of degeneration (Fig. 2) were treated with biological therapies and their repair processes (for another 10 years) were simulated (Figs. 4–6). The discs without treatment (i.e., the discs with 20 years of degeneration in Figure 2) were served as a control. Three types of biological therapies for disc repair were investigated numerically: increasing cell density in the NP (Case I), increasing GAG synthesis rate in the NP (Case II), and decreasing GAG degradation rate in the NP (Case III). For Case I, two different values for cell density in the NP (4000 cells/mm3 and 8000 cells/mm3) were investigated. In Case II, the GAG synthesis rate per cell in the NP was assumed to increase by 100%, i.e., from 0.91×10⁻⁵ mmol/g dry weight/hr to 1.82×10⁻⁵ mmol/g dry weight/hr. In Case III, the relative GAG degradation rate in the NP was assumed to decrease by 50%, i.e., from 2.00×10⁻⁹/s to 1.00×10⁻⁹/s.14 Note that the nutrition level at the disc boundary during the therapy was assumed to be the same as those at the healthy condition.
Figure 4.
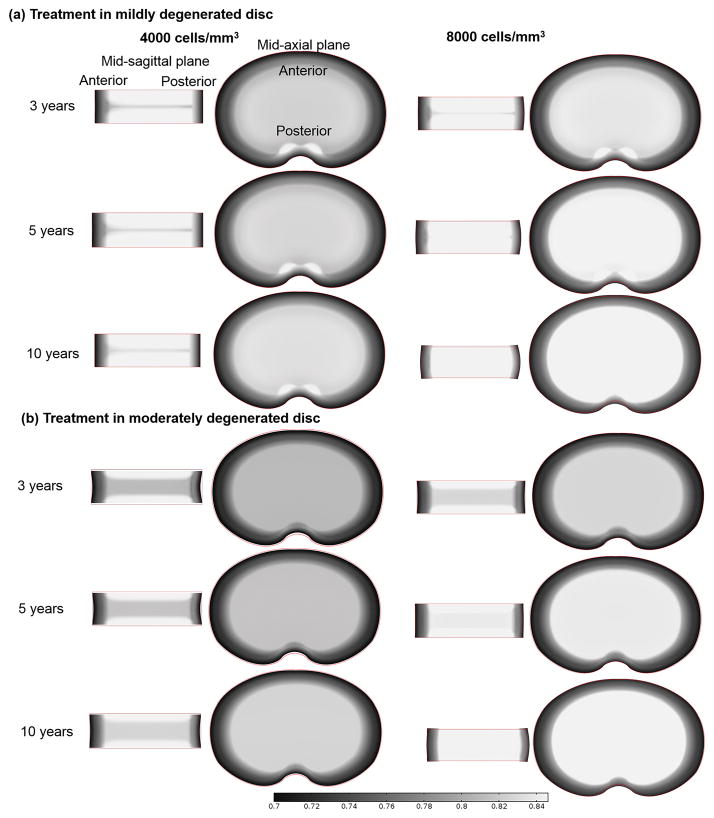
Variation of water content (water volume over tissue volume) distribution with time in the discs treated with a cell density of 4000 or 8000 cells/mm3 (Case I): (a) in the mildly degenerated disc, and (b) in the moderately degenerated disc.
Figure 6.
Variation of water content (water volume over tissue volume) distribution with time in the discs treated with reduced GAG degradation by 50% (Case III): (a) in the mildly degenerated disc, and (b) in the moderately degenerated disc.
Results
Change in water content distribution in the discs with degenerative progression
Water content distribution in the healthy disc (before degeneration) is shown in Figure 2a. With the disc degeneration progression, the water content was predicted to decrease in the disc (Fig. 2b and c). A horizontal region with lower water content appeared at the middle of NP (compared with the rest of the NP region). This region was defined as the degenerated region in this study. This region was wider in the disc with lower nutrition level at the disc boundary (Fig. 2b and c, mid-sagittal plane view). A spot at the posterior region with higher water content was predicted in the mildly degenerated disc (Fig. 2b, mid-axial plane view). However, the spot was not distinctive in the moderately degenerated disc (Fig. 2c). The water content distributions along the axial direction at the center of NP were predicted and compared with an experimental measurement29 (Fig. 3). Disc height (the red line marks the original geometry of the disc before degeneration and repair) decreased slightly in the mildly degenerated disc, but noticeably in the moderately degenerated disc after 10 years of degeneration.
Changes in water content distribution in the degenerated discs after treatment
Before treatment, there were a 20% loss in cell number, 8% decrease in GAG content, 4% decrease in water content, and 2.3% decrease in disc height in the mildly degenerated disc. Whereas in the moderately degenerated disc, there were a 60% loss in cell number, 26% decrease in GAG content, 14% decrease in water content in the disc, and 9.3% decrease in disc height.
After treatment with increased cell density in the NP (i.e., Case I), the water content was predicted to increase in both the mildly and moderately degenerated discs (Fig. 4). The increase rate depended on the cell density in the NP, that is, the higher the cell density was used, the faster the water content would increase in the treated disc. Consequently, the horizontal region with lower water content (mid-sagittal view) disappeared faster in the degenerated disc treated with a higher value of cell density. Similarly, the spot with relatively higher water content (mid-axial view) disappeared faster in the degenerated disc treated with a cell density of 8000 cells/mm3, compared to that treated with a cell density of 4000 cells/mm3. Disc height increased after the treatment (Fig. 4).
In Case II, the water content was predicted to further decrease in the degenerated region and to increase in the non-degenerated region (Fig. 5). The overall water content increased in the mildly degenerated disc after treatment, resulting in an increase in the disc height (Fig. 5a), while there was no significant increase in overall water content or disc height in the moderately degenerated disc after treatment (Fig. 5b). The spot with higher water content in the posterior region at mid-axial plane remained after treatment (Fig. 5). The results predicted by our model for Case III were similar to those for Case II (Fig. 6).
Figure 5.
Variation of water content (water volume over tissue volume) distribution with time in the discs treated with increased GAG synthesis rate by 100% (Case II): (a) in the mildly degenerated disc, and (b) in the moderately degenerated disc.
Discussion
The first goal of this study was to numerically investigate the temporal and spatial variations of water content during disc degeneration process. The predicted variation of water content distribution along the axial direction at the center of NP in the degenerated discs is consistent with experimental findings reported by Iatridis et al,29 see Figure 3, indicating that the water content distribution predicted by our model is realistic.
Two patterns of water content distributions, a horizontal region with lower water content and a spot with higher water content at the posterior region, were predicted to appear during the degenerative progression. The horizontal region with lower water content appeared at the mid-axial plane of NP is due to the fact that nutrition levels are lowest,14; 30 and more cells die in this region when nutrient concentrations at the disc boundaries reduce to a level below the critical level (defined as the minimum nutrition level at the disc boundary to maintain the viability of all the cells within the disc), resulting in a lower GAG content in this region.14 Since lower GAG content corresponds to lower osmolarity (or swelling pressure),16; 31 less water is retained at the mid-axial plane of NP.16 The water content distribution in the disc depends not only on the GAG distribution, but also on the tissue deformation (i.e., dilation)32 which is related to the disc geometry and tissue mechanical properties. It seems that the appearance of the bright spot in the posterior region (Fig. 2b) may be related to the nutrition level in this particular region33, where the change in relative tissue volume (i.e., dilation) is found to be small (data not shown) and there is no cell death for the nutrition boundary condition in the case of mildly degenerated disc. This may be partially attributed to the relatively short diffusion distance between this region and nutrition supply source at the disc edge.
The predicted patterns of water content distributions in degenerated discs were similar to those observed in T2-weighted MRI images (e.g., Fig. 1B and C in Pfirrmann et al., 2001; Fig. 1a and b in Peng et al., 2006).6–8 It is reported that the intensity of T2-weighted MRI images depends on three factors (a) collagen concentration, (b) tissue anisotropy (orientation of collagen), and (c) water content in the tissue;34–36 and water is the main source of MRI-sensitive protons in the tissue.35 During disc degeneration, variation of water content and collagen structure might occur simultaneously. Thus, it is not surprising to see a correlation in patterns between water content distribution (Fig. 2) and the intensity of T2-weighted MRI images.6–10 More investigation is needed to further confirm this correlation. Incidentally, our results indicate that the nutrition level at disc boundary is a factor influencing the pattern of water content distribution in the degenerated disc (Fig. 2b and c), which may be used for the diagnosis of disc degeneration.
The second goal of this study was to numerically investigate the variation of water content distribution with biological therapies. Our predicted results indicate that increasing cell density (such as by cell implantation) may be the only therapy (among the three therapies investigated in this study) which is effective for eliminating the two patterns of water content distribution appeared in the degenerated discs. Therapies with increasing the GAG synthesis rate (Case II) or decreasing the GAG degradation rate (Case III) may be effective for increasing the overall water content and the disc height in the mildly degenerated discs, but not in the moderately degenerated discs (Figs. 4 and 5). Therapies in Cases II and III are not effective for eliminating the two patterns. The difference in treatment outcomes between mildly and moderately degenerated discs in Case II and Case III may be due to the difference in viable cell number remaining in the NP. As the number of viable cells in the NP of the moderately degenerated disc (40% of the normal value) is much lower than that in the mildly degenerated disc (80% of the normal value) in this study, the amount of GAG synthesized by the viable cells in the NP of the moderately degenerated disc could not exceed the amount of GAG breakdown, even though the GAG synthesis rate (per cell) for the remaining cells in the NP is doubled (Case II), or the GAG degradation rate is reduced by half (Case III). This results in no improvement in GAG content or water content within the treated NP of the moderately degenerated disc. Results from these two Cases indicate that the number of viable cells in degenerated discs is crucial for the success of therapies in Case II and Case III. These results are helpful to assess the therapy outcome with MRI techniques.
There are some limitations in this study. The solid matrix of the tissue was assumed to be isotropic and linearly elastic, which may not be able to accurately describe the large deformation of the disc. This would affect the value of the water content predicted, but may not affect the patterns of water content distribution significantly, as the predict patterns in the degenerated discs were consistent with those experiment findings.14; 29 For a more realistic simulation, the anisotropic and nonlinear model should be considered.37 The other limitation of this study is that only one disc geometry was studied. Since the shape and size of discs are important factors affecting the diffusion of nutrients and deformation, more disc geometries will be studied in the future.
In conclusion, the change in water content distribution with disc degenerative progression and repair process has been investigated with a finite element model. The horizontal region with lower water content at the mid-axial plane of NP and the spot with higher water content at the posterior region may imply the gray band and HIZ observed on T2-weighted MRI images. This study provides new guidance to develop a novel method for diagnosing disc degeneration and assessing outcomes of biological therapies with MRI techniques.
Acknowledgments
Research reported in this publication was supported by the National Institute of Arthritis and Musculoskeletal and Skin Diseases of the National Institutes of Health under Award Number AR066240. The content is solely the responsibility of the authors and does not necessarily represent the official views of the National Institutes of Health.
Footnotes
Author Contributions Statement: W.G. designed research, Q.Z. and X.G. performed research, M.D.B. and H.T.T. contributed to the research.
References
- 1.Lyons G, Eisenstein SM, Sweet MB. Biochemical changes in intervertebral disc degeneration. Biochim Biophys Acta. 1981;673:443–453. doi: 10.1016/0304-4165(81)90476-1. [DOI] [PubMed] [Google Scholar]
- 2.Urban JP, Roberts S. Degeneration of the intervertebral disc. Arthritis research & therapy. 2003;5:120–130. doi: 10.1186/ar629. [DOI] [PMC free article] [PubMed] [Google Scholar]
- 3.Sakai D, Andersson GB. Stem cell therapy for intervertebral disc regeneration: obstacles and solutions. Nature reviews Rheumatology. 2015;11:243–256. doi: 10.1038/nrrheum.2015.13. [DOI] [PubMed] [Google Scholar]
- 4.Benneker LM, Andersson G, Iatridis JC, et al. Cell therapy for intervertebral disc repair: advancing cell therapy from bench to clinics. European cells & materials. 2014;27:5–11. doi: 10.22203/ecm.v027sa02. [DOI] [PMC free article] [PubMed] [Google Scholar]
- 5.Hudson KD, Alimi M, Grunert P, et al. Recent advances in biological therapies for disc degeneration: tissue engineering of the annulus fibrosus, nucleus pulposus and whole intervertebral discs. Curr Opin Biotechnol. 2013;24:872–879. doi: 10.1016/j.copbio.2013.04.012. [DOI] [PubMed] [Google Scholar]
- 6.Pfirrmann CWA, Metzdorf A, Zanetti M, et al. Magnetic resonance classification of lumbar intervertebral disc degeneration. Spine. 2001;26:1873–1878. doi: 10.1097/00007632-200109010-00011. [DOI] [PubMed] [Google Scholar]
- 7.Peng B, Hou S, Wu W, et al. The pathogenesis and clinical significance of a high-intensity zone (HIZ) of lumbar intervertebral disc on MR imaging in the patient with discogenic low back pain. Eur Spine J. 2006;15:583–587. doi: 10.1007/s00586-005-0892-8. [DOI] [PMC free article] [PubMed] [Google Scholar]
- 8.Aprill C, Bogduk N. High-intensity zone: a diagnostic sign of painful lumbar disc on magnetic resonance imaging. The British journal of radiology. 1992;65:361–369. doi: 10.1259/0007-1285-65-773-361. [DOI] [PubMed] [Google Scholar]
- 9.Sugiura K, Tonogai I, Matsuura T, et al. Discoscopic findings of high signal intensity zones on magnetic resonance imaging of lumbar intervertebral discs. Case reports in orthopedics. 2014;2014:245952. doi: 10.1155/2014/245952. [DOI] [PMC free article] [PubMed] [Google Scholar]
- 10.Carragee EJ, Paragioudakis SJ, Khurana S. 2000 Volvo Award Winner in Clinical Studies - Lumbar high-intensity zone and discography in subjects without low back problems. Spine. 2000;25:2987–2992. doi: 10.1097/00007632-200012010-00005. [DOI] [PubMed] [Google Scholar]
- 11.Lam KS, Carlin D, Mulholland RC. Lumbar disc high-intensity zone: the value and significance of provocative discography in the determination of the discogenic pain source. Eur Spine J. 2000;9:36–41. doi: 10.1007/s005860050006. [DOI] [PMC free article] [PubMed] [Google Scholar]
- 12.Ricketson R, Simmons JW, Hauser BO. The prolapsed intervertebral disc. The high-intensity zone with discography correlation. Spine (Phila Pa 1976) 1996;21:2758–2762. doi: 10.1097/00007632-199612010-00010. [DOI] [PubMed] [Google Scholar]
- 13.Ren DF, Hou SX, Wu WW, et al. The expression of tumor necrosis factor-alpha and CD68 in high-intensity zone of lumbar intervertebral disc on magnetic resonance image in the patients with low back pain. Spine. 2011;36:E429–E433. doi: 10.1097/BRS.0b013e3181dfce9e. [DOI] [PubMed] [Google Scholar]
- 14.Gu W, Zhu Q, Gao X, et al. Simulation of the progression of intervertebral disc degeneration due to decreased nutritional supply. Spine (Phila Pa 1976) 2014;39:E1411–1417. doi: 10.1097/BRS.0000000000000560. [DOI] [PMC free article] [PubMed] [Google Scholar]
- 15.Zhu Q, Jackson AR, Gu WY. Cell viability in intervertebral disc under various nutritional and dynamic loading conditions: 3d finite element analysis. Journal of biomechanics. 2012;45:2769–2777. doi: 10.1016/j.jbiomech.2012.08.044. [DOI] [PMC free article] [PubMed] [Google Scholar]
- 16.Zhu Q, Gao X, Gu W. Temporal changes of mechanical signals and extracellular composition in human intervertebral disc during degenerative progression. Journal of biomechanics. 2014;47:3734–3743. doi: 10.1016/j.jbiomech.2014.09.004. [DOI] [PMC free article] [PubMed] [Google Scholar]
- 17.Lai WM, Hou JS, Mow VC. A triphasic theory for the swelling and deformation behaviors of articular cartilage. Journal of biomechanical engineering. 1991;113:245–258. doi: 10.1115/1.2894880. [DOI] [PubMed] [Google Scholar]
- 18.Zhu Q, Gao X, Temple HT, et al. Simulation of biological therapies for degenerated intervertebral discs. Journal of orthopaedic research : official publication of the Orthopaedic Research Society. 2016;34:699–708. doi: 10.1002/jor.23061. [DOI] [PMC free article] [PubMed] [Google Scholar]
- 19.Jackson AR, Huang CY, Brown MD, et al. 3D finite element analysis of nutrient distributions and cell viability in the intervertebral disc: effects of deformation and degeneration. Journal of biomechanical engineering. 2011;133:091006. doi: 10.1115/1.4004944. [DOI] [PMC free article] [PubMed] [Google Scholar]
- 20.Sun DN, Gu WY, Guo XE, et al. A mixed finite element formulation of triphasic mechano-electrochemical theory for charged, hydrated biological soft tissues. Int J Numer Meth Eng. 1999;45:1375–1402. [Google Scholar]
- 21.Perie D, Iatridis JC, Demers CN, et al. Assessment of compressive modulus, hydraulic permeability and matrix content of trypsin-treated nucleus pulposus using quantitative MRI. Journal of biomechanics. 2006;39:1392–1400. doi: 10.1016/j.jbiomech.2005.04.015. [DOI] [PubMed] [Google Scholar]
- 22.Iatridis JC, Setton LA, Foster RJ, et al. Degeneration affects the anisotropic and nonlinear behaviors of human anulus fibrosus in compression. Journal of biomechanics. 1998;31:535–544. doi: 10.1016/s0021-9290(98)00046-3. [DOI] [PubMed] [Google Scholar]
- 23.Perie D, Korda D, Iatridis JC. Confined compression experiments on bovine nucleus pulposus and annulus fibrosus: sensitivity of the experiment in the determination of compressive modulus and hydraulic permeability. Journal of biomechanics. 2005;38:2164–2171. doi: 10.1016/j.jbiomech.2004.10.002. [DOI] [PubMed] [Google Scholar]
- 24.Maroudas A, Stockwell RA, Nachemson A, et al. Factors involved in the nutrition of the human lumbar intervertebral disc: cellularity and diffusion of glucose in vitro. Journal of anatomy. 1975;120:113–130. [PMC free article] [PubMed] [Google Scholar]
- 25.Urban JPG, Maroudas A. The measurement of fixed charge density in the intervertebral disc. Biochim Biophys Acta. 1979;586:166–178. [Google Scholar]
- 26.Rajasekaran S, Babu JN, Arun R, et al. ISSLS prize winner: A study of diffusion in human lumbar discs: A serial magnetic resonance imaging study documenting the influence of the endplate on diffusion in normal and degenerate discs. Spine. 2004;29:2654–2667. doi: 10.1097/01.brs.0000148014.15210.64. [DOI] [PubMed] [Google Scholar]
- 27.DeLucca JF, Cortes DH, Jacobs NT, et al. Human cartilage endplate permeability varies with degeneration and intervertebral disc site. Journal of biomechanics. 2016 doi: 10.1016/j.jbiomech.2016.01.007. [DOI] [PMC free article] [PubMed] [Google Scholar]
- 28.Selard E, Shirazi-Adl A, Urban JP. Finite element study of nutrient diffusion in the human intervertebral disc. Spine. 2003;28:1945–1953. doi: 10.1097/01.BRS.0000087210.93541.23. [DOI] [PubMed] [Google Scholar]
- 29.Iatridis JC, MacLean JJ, O’Brien M, et al. Measurements of proteoglycan and water content distribution in human lumbar intervertebral discs. Spine. 2007;32:1493–1497. doi: 10.1097/BRS.0b013e318067dd3f. [DOI] [PMC free article] [PubMed] [Google Scholar]
- 30.Urban JP, Smith S, Fairbank JC. Nutrition of the intervertebral disc. Spine. 2004;29:2700–2709. doi: 10.1097/01.brs.0000146499.97948.52. [DOI] [PubMed] [Google Scholar]
- 31.Urban JPG, Mcmullin JF. Swelling pressure of the lumbar intervertebral disks - influence of age, spinal level, composition, and degeneration. Spine. 1988;13:179–187. doi: 10.1097/00007632-198802000-00009. [DOI] [PubMed] [Google Scholar]
- 32.Lai WM, Hou JS, Mow VC. A triphasic theory for the swelling and deformation behaviors of articular cartilage. Journal of biomechanical engineering. 1991;113:245–258. doi: 10.1115/1.2894880. [DOI] [PubMed] [Google Scholar]
- 33.Zhu Q, Gao X, Levene HB, et al. Influences of nutrition supply and pathways on the degenerative patterns in human intervertebral disc. Spine (Phila Pa 1976) 2016;41:568–576. doi: 10.1097/BRS.0000000000001292. [DOI] [PMC free article] [PubMed] [Google Scholar]
- 34.Xia Y. Magic-angle effect in magnetic resonance imaging of articular cartilage - A review. Invest Radiol. 2000;35:602–621. doi: 10.1097/00004424-200010000-00007. [DOI] [PubMed] [Google Scholar]
- 35.Mwale F, Iatridis JC, Antoniou J. Quantitative MRI as a diagnostic tool of intervertebral disc matrix composition and integrity. European Spine Journal. 2008;17:S432–S440. doi: 10.1007/s00586-008-0744-4. [DOI] [PMC free article] [PubMed] [Google Scholar]
- 36.Brayda-Bruno M, Tibiletti M, Ito K, et al. Advances in the diagnosis of degenerated lumbar discs and their possible clinical application. European Spine Journal. 2014;23:S315–S323. doi: 10.1007/s00586-013-2960-9. [DOI] [PubMed] [Google Scholar]
- 37.Gao X, Zhu Q, Gu W. An Anisotropic Multiphysics Model for Intervertebral Disk. Journal of Applied Mechanics. 2016;83:021011. doi: 10.1115/1.4031793. [DOI] [PMC free article] [PubMed] [Google Scholar]


