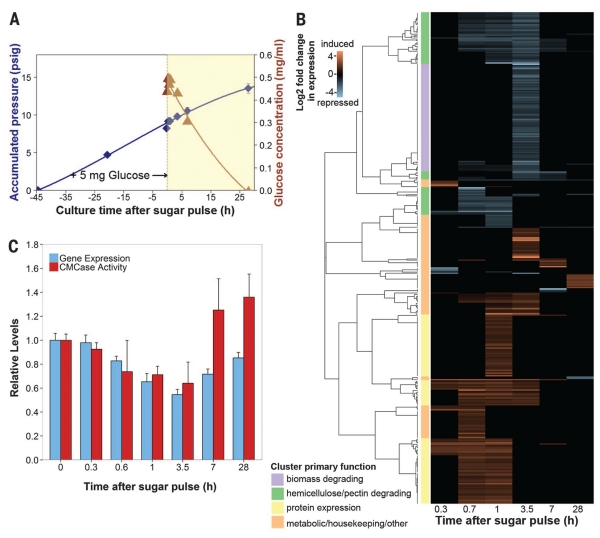
Fig. 3. Anaerobic fungal biomass-degrading machinery is catabolically repressed.
(A) Glucose consumption in fungal cultures. Exponential cultures of Piromyces were pulsed with 5 mg of glucose, and mRNA and secretome samples were collected during glucose depletion (yellow region). Blue diamonds, accumulated pressure; brown triangles, glucose concentration. Error bars indicate SEM. (B) Cluster analysis of genes strongly regulated by glucose. Transcript abundance data were compared to uninduced samples at time t = 0 to calculate the log2 fold change in expression.Transcripts with large, significant regulation are displayed (P ≤ 0.01, negative binomial distribution, ≥twofold change). Clusters were manually annotated based on the most common protein domains and/or BLAST (Basic Local Alignment Search Tool) hits. (C) Relative expression [fragments per kilobase of transcript per million mapped reads (FPKM)] of biomass-degrading enzymes (table S1) and their corresponding activity (cellulosome fraction) on CMC (21). Data represent the mean ± SEM (error bars) of at least two replicates.

