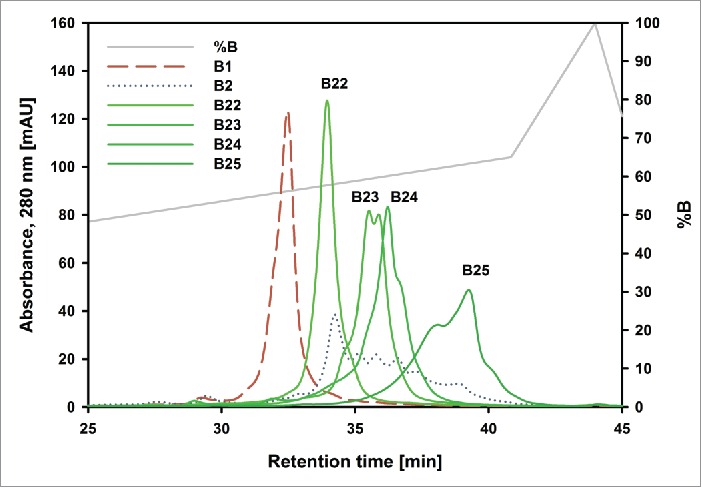
Figure 7.

Overlay of analytical chromatograms of “Newton” basic charge variants. The dashed red trace is fraction B1. The dotted blue trace is fraction B2. B22-B25 are the further separated variants from B2. The gray trace shows the % of buffer B. Insufficient material from B21 made it impossible to analyze it.
