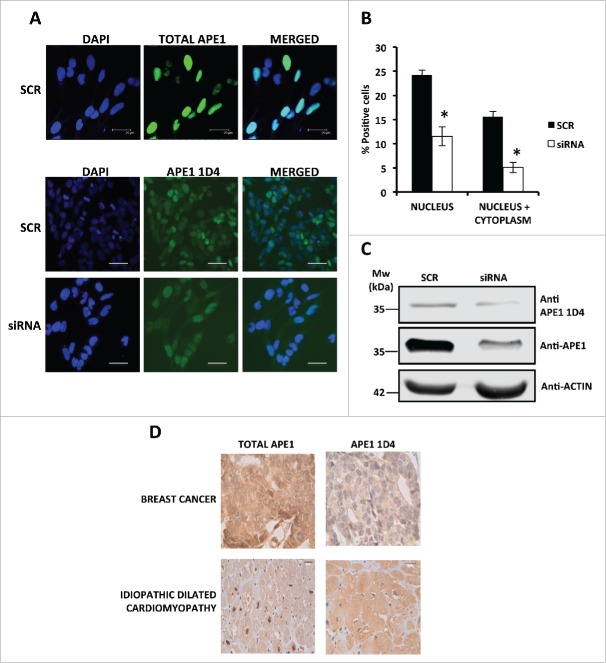
Figure 5.
(A) Representative immunofluorescence on HeLa cells scramble and APE1 siRNA-treated cells shows the efficiency of APE1 knock-down and a distribution of AcAPE1 mainly in the cytoplasm respect to total APE1. Bars 25 μm. (B) Histogram reporting the average of positive cells for acetylated APE1 in the nucleus and in the cytoplasm. The experiment was done in triplicate counting 1000 total cells for each condition. Asterisks represent a significant difference respect to control (SCR).* P < 0.05. (C) Western blotting analysis on whole cell extracts from scramble siRNA- or APE1 siRNA-treated cells showing APE1 protein and its acetylated form. Actin was used as loading control. (D) Immuno-histochemistry on samples obtained by a patient affected by breast cancer and by a patient affected by idiopathic dilated cardiomyopathy (the study was approved by the ethics committee of Udine University). The representative images demonstrate a predominantly distribution of acetylated APE1 in the cytoplasm with respect to total APE1.

