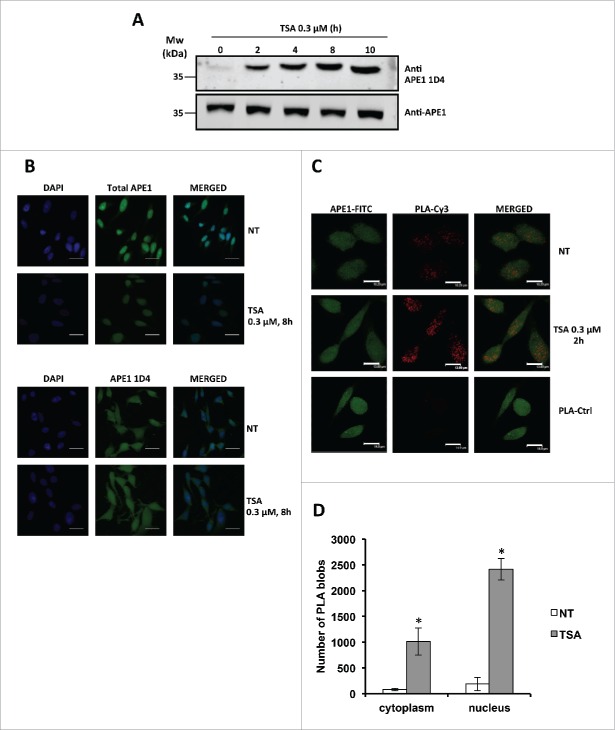
Figure 6.
(A) Western blotting analysis on whole cell extracts from HeLa cells treated with TSA 0.3 µM, showing time-dependent increase of APE1 acetylation. (B) Representative immunofluorescence on HeLa cells treated with TSA 0.3 µM for 8 h stained with total APE1 and AcAPE1 (1D4) antibody showing increased distribution of the acetylated APE1 form in the cytoplasm compared to total APE1 upon TSA treatment. NT, non-treated. Bars 50 μm. (C) Nucleoplasmic interaction between APE1 N-terminal and Ac-APE1 (1D4) antibody after TSA treatment. HeLa cells were seeded on a glass coverslip and treated with TSA 0.3 µM for 2h. PLA reaction was carried out using anti-APE1 N-terminal21,27 and anti-acetylated APE1 1D4 antibodies. APE1 expression was detected by using the anti-APE1 N-terminal antibody and was used as a reference for the nuclei. PLA control was performed omitting the primary antibody for Ac-APE1 (1D4) (PLA-Ctrl). (D) Histogram accounting for the average number of PLA signals of at least 30 randomly selected cells per condition. Asterisks represent a significant difference respective to control (NT). * P < 0.05. NT, non-treated cells. Bars 14 μm.

