

Abstract
Chronic alcohol consumption causes alcoholic liver disease, which is associated with the initiation of dysregulated lipid metabolism. Recent evidences suggest that dysregulated cholesterol metabolism plays an important role in the pathogenesis of alcoholic fatty liver disease. Ecklonia stolonifera (ES), a perennial brown marine alga that belongs to the family Laminariaceae, is rich in phlorotannins. Many studies have indicated that ES has extensive pharmacological effects, such as antioxidative, hepatoprotective, and antiinflammatory effects. However, only a few studies have investigated the protective effect of ES in alcoholic fatty liver. Male Sprague-Dawley rats were randomly divided into normal diet (ND) (fed a normal diet for 10 weeks) and ethanol diet (ED) groups. Rats in the ED group were fed a Lieber-DeCarli liquid diet (containing 5% ethanol) for 10 weeks and administered ES extract (50, 100, or 200 mg/kg/day), silymarin (100 mg/kg/day), or no treatment for 4 weeks. Each treatment group comprised of eight rats. The supplementation with ES resulted in decreased serum levels of triglycerides (TGs), total cholesterol, alanine aminotransferase, and aspartate aminotransferase. In addition, there were decreases in hepatic lipid and malondialdehyde levels. Changes in liver histology, as analyzed by Oil Red O staining, showed that the ES treatment suppressed adipogenesis. In addition, the ES treatment increased the expression of fatty acid oxidation-related genes (e.g., PPAR-α and CPT-1) but decreased the expression of SREBP 1, which is a TG synthesis-related gene. These results suggest that ES extract may be useful in preventing fatty acid oxidation and reducing lipogenesis in ethanol-induced fatty liver.
Keywords: Ecklonia stolonifera, Hepatoprotective effect, Fatty liver, PPAR-alpha, SREBP-1, Ethanol
INTRODUCTION
Ecklonia stolonifera Okamura (ES) is a perennial brown marine alga that belongs to the family Laminariaceae. ES is usually found in subtidal zones at depths of 2–10 m and is widely distributed throughout the eastern and southern coasts of Republic of Korea (Park et al., 1994). ES is often used as a foodstuff. In addition, ES has been shown to have both medicinal and pharmaceutical benefits such as strong antioxidative (Kuda et al., 2007), antibacterial (Kuda et al., 2007), antiinflammatory (Kim et al., 2011), hepatoprotective (Kim et al., 2005), angiotensin I-converting enzyme-inhibitory (Jung et al., 2006), anticholinesterase (Yoon et al., 2008a), antiallergic (Shim et al., 2009), antihyperlipidemic (Yoon et al., 2008b), antidiabetic (Moon et al., 2011), anti-skin-aging (Joe et al., 2006), antimutagenic (Lee et al., 1996), and tyrosinase-inhibitory (Kang et al., 2004) activities.
The role of ES in the protection against hepatotoxicity has been previously evaluated (Kim et al., 2005). It has been demonstrated that ES has a hepatoprotective effect against tacrine-induced cytotoxicity in HepG2 cells. The hepatoprotective property of ES results from its downregulation of fatty acid synthase (FAS) and cytochrome c, which results in an antioxidant effect (Lee et al., 2012).
Alcoholic liver disease (ALD) is a major health problem worldwide (Laramée et al., 2013; Shield et al., 2013). Chronic alcohol consumption causes changes in the metabolism of lipoproteins and is therefore a powerful inducer of hyperlipidemia in both animals and humans. Most heavy drinkers develop fatty livers; however, only a minority of these patients experience progression to more severe forms of liver damage, such as alcoholic hepatitis and cirrhosis (Teli et al., 1995). Recent studies have been focusing on reducing oxidation of fatty acids and enhancing de novo lipogenesis. Two important nuclear transcription factors, peroxisome proliferator-activated receptor α (PPAR-α) and sterol regulatory element-binding protein 1 (SREBP-1), which regulate lipid metabolism, have been shown to be involved in ethanol-induced steatosis (Zeng and Xie, 2009). PPAR-α coordinates a number of metabolic pathways that dispose of excess fatty acids (Gearing et al., 1994). The enzymes involved in fatty acid oxidation and the entry of fatty acyl-CoA into mitochondria are affected by ethanol. PPAR-α inhibits the expression of carnitine acyltransferase 1 (CPT-1), which results in a reduction in fatty acid oxidation (Munday and Hemingway, 1999; Lee et al., 2004). SREBPs, which belong to the basic helix-loop-helix-leucine zipper family, are key transcription factors involved in the biosynthesis of cholesterol and fatty acids. SREBP-1 plays an important role in regulating the transcription of genes involved in hepatic triglyceride (TG) synthesis, whereas SREBP-2 is involved in the regulation of genes involved in cholesterol metabolism (Horton et al., 1998).
In vivo studies have shown that chronic ethanol-induced fatty liver is accompanied by a substantial increase in mature SREBP-1 protein levels and the activation of SREBP-1 target hepatic lipogenic genes such as FAS, ATP citrate lyase (ACL), acetyl-CoA carboxylase (ACC), and malic enzyme (ME) (You et al., 2002; Ji and Kaplowitz, 2003; You et al., 2004; You and Crabb, 2004).
In the present study, we determined whether dietary supplementation with an ethanolic extract of ES attenuates the development of Lieber-DeCarli diet-induced fatty liver in rats. Experimental models of ALD are commonly generated by feeding animals the Lieber-DeCarli liquid diet, which is a diet that is rich in unsaturated fatty acids (DeCarli and Lieber, 1967). We also aimed to elucidate the molecular mechanism underlying the antilipogenic effect of the ES extract.
MATERIALS AND METHODS
Plant materials and reagents
ES was collected from along the coast of Busan (Republic of Korea) in August 2012 and a voucher specimen was deposited at the J. S. Choi laboratory (Lee et al., 2012). After washing with seawater and tap water, the samples were air-dried. The dried sample was ground with a hammer mill and stored at −20°C until use.
Preparation of ethanolic extract of ES
The dried ES powder (3 kg) was refluxed with 70% ethanol (27 L) for 9 h. Afterwards, the extract was filtered through a 0.2-μm filter. The filtrate was evaporated to dryness under reduced pressure and then freeze-dried at −47°C. The powder was stored at −80°C until use.
Quantitation of phlorotannins in the ethanolic extract of ES by high-performance liquid chromatography (HPLC)
Standard solutions of eckol were prepared at concentrations of 5–100 μg/mL. A 4-mg sample of the ES extract was dissolved in 1 mL of 20% methanol (in water %v/v). All the standard and sample solutions were filtered through a 0.45-μm syringe filter (Millipore, Bedford, MA, USA) before injection onto the HPLC. The HPLC equipment consisted of an autosampler (model series 225; PerkinElmer, Waltham, MA, USA) and a dual absorbance UV detector (model 200EP, PerkinElmer). The Chromera software (PerkinElmer) was used for the analysis. A Capcell Pak C18 column (250×4.6 mm, 5 μm; Shiseido Co., Ltd., Tokyo, Japan) was used for chromatographic separation.
The samples were analyzed according to a previously reported HPLC method (Goo et al., 2010) but with some slight modifications. The detection wavelength was set at 254 nm. The mobile phase was comprised of water acidified with formic acid (0.1%) (solvent A) and acetonitrile acidified with formic acid (0.1%) (solvent B). The mobile phase was run in gradient mode as follows: 0–7 min, 15% of solvent B; 7–9 min 18% of solvent B; 9–35 min, 20% of solvent B; 35–45 min, 25% of solvent B; 45–60 min, 26% of solvent B; 60–74 min, 28% of solvent B; and 74–79 min, 28% of solvent B. The mobile phase flow rate was set at 0.8 mL/min and the injection volume was 10 μL.
Animals and experimental diets
All the protocols used in the experiments were approved by the Institutional Animal Care and Use Committees (IACUCs) (approval no. KHP-2010-12-2).
Five-week-old male Sprague-Dawley rats were purchased from Central Lab. Animal Inc. (Seoul, Republic of Korea). The animals were individually housed in stainless steel cages at temperature of 22–28°C and under a 12/12 h light/dark cycle. Rats in the ethanol diet (ED) group (n=40) were administered a liquid diet containing ethanol, which provided 36% of energy (Table 1) (Lieber and DeCarli, 1989). Ethanol was introduced into the diet by gradually mixing it with distilled water from 0% (w/v) to 5% (w/v) over a 1-week period for adaptation, and then at a concentration of 5% (w/v) for the next 6 weeks. The normal diet (ND) rats (n=8) received an isocaloric liquid diet containing dextrin-maltose instead of ethanol. After 6 weeks, the ED-fed rats were randomly divided into ED-only, positive (silymarin, 100 mg/kg; ED+S), and ES (50, 100, or 200 mg/kg; ED+ES) groups (n=8 per group). The rats were then administered daily oral doses of the respective treatments for 4 weeks. Body weight was measured once a week during the feeding period.
Table 1.
Composition of the purified liquid diets
| Ingredients | Level (mg/mL) | |||||
|---|---|---|---|---|---|---|
|
| ||||||
| ND | ED | Sil | ESL | ESM | ESH | |
| Casein | 41.4 | 41.4 | 41.4 | 41.4 | 41.4 | 41.4 |
| DL-Methionine | 0.30 | 0.30 | 0.30 | 0.30 | 0.30 | 0.30 |
| L-Cystine | 0.50 | 0.50 | 0.50 | 0.50 | 0.50 | 0.50 |
| Dextrin-Maltosea | 115 | 25.6 | 25.6 | 25.6 | 25.6 | 25.6 |
| Corn Oil | 8.50 | 8.50 | 8.50 | 8.50 | 8.50 | 8.50 |
| Olive Oil | 28.4 | 28.4 | 28.4 | 28.4 | 28.4 | 28.4 |
| Safflower Oil | 2.70 | 2.70 | 2.70 | 2.70 | 2.70 | 2.70 |
| Mineral Mixb | 8.75 | 8.75 | 8.75 | 8.75 | 8.75 | 8.75 |
| Vitamin Mixc | 2.50 | 2.50 | 2.50 | 2.50 | 2.50 | 2.50 |
| Choline Bitartrate | 0.53 | 0.53 | 0.53 | 0.53 | 0.53 | 0.53 |
| Carboxymethyl Cellulose Sodium Salt | 10.0 | 10.0 | 10.0 | 10.0 | 10.0 | 10.0 |
| Sodium Sarragenate | 2.00 | 2.00 | 2.00 | 2.00 | 2.00 | 2.00 |
| Ethanol | - | 50.0 | 50.0 | 50.0 | 50.0 | 50.0 |
ND, normal diet; ED, ethanol diet; Sil, ED plus 100 mg/kg silymarin (positive control group); ESL/ESM/ESH, ED plus 50, 100 and 200 mg/kg Ecklonia stolonifera ethanol extract various doses group.
Dextrin:Maltose=80:20,
Mineral Mix (in g/kg of mix): CaHPO4, 500; NaCl, 74; K2H6O7H2O, 220; K2SO4, 52; MgO, 24; MnCO3, 3.57; Fe(C6H5O7)·6H2O, 6; ZnCO3, 1.6; CuCO3, 0.3; KIO3, 0.01; Na2SeO3·5H2O, 0.01; CrK(SO4)2, 0.55; sucrose (finely powdered), 118.
Vitamin Mix (in g/kg of mix): thiamine·HCl, 0.6; riboflavin, 0.6; nicotinamide, 25; pyridoxine·HCl, 0.7; nicotinic acid, 3; d-calcium pantothenate, 1.6; folic acid, 0.2; d-biotin, 0.02; cyanocobalamin (vitamin B12), 0.001; retinyl palmitate (250,000 IU/g), 1.6; dl-a-tocopherol acetate (250 IU/g), 20; cholecalciferol (vitamin D3), 0.25; menaquinone (vitamin K2), 0.05; sucrose (finely powdered), 972.9.
Collection of blood samples and hepatic tissues
At the end of the experiments, the mice were anesthetized with CO2 gas after depriving them of food for 12 h. Blood samples were drawn from the tail vein and serum was obtained by centrifuging the blood at 3,000 rpm for 15 min at 4°C. In addition, the liver was immediately removed after collecting the blood, rinsed with phosphate-buffered saline, and weighed. The liver and serum samples were stored at −80°C until use.
Biochemical analysis
Serum and liver concentrations of TG, total cholesterol (TC), and high-density lipoprotein cholesterol (HDL-C) were determined using the appropriate enzyme kits (ASAN PHARM., CO., LTD., Hwaseong, Republic of Korea). Free fatty acid (FFA) was determined by an enzymatic colorimetric method (AA kit; Wako Chemicals, Richmond, VA, USA). Hepatic lipids were extracted by the Folch method (Folch et al., 1957), using a chloroform-methanol mixture (2:1, v/v).
Serum alanine aminotransferase (ALT) and aspartate aminotransferase (AST) levels were measured using commercial reagents (ASAN PHARM., CO., LTD.).
Liver histology
Liver samples were fixed in 10% buffered formalin, sequentially dehydrated with increasing concentrations of ethanol, cleared in xylene, and embedded in paraffin. The samples were then sectioned into 8-μm pieces, stained with Oil Red O, viewed with an optical microscope (BX51; Olympus, Tokyo, Japan), and then photographed at a final magnification of ×400.
Determination of malondialdehyde (MDA) levels in the hepatic tissues
The degree of lipid peroxidation in the liver tissues was assessed by measuring MDA levels using the thiobarbituric acid test (Buege and Aust, 1978).
Quantitative real-time polymerase chain reaction (PCR)
Total RNA was isolated using TRIzol reagent (Invitrogen, Carlsbad, CA, USA) according to the manufacturer’s instructions. The isolated RNA was dissolved in diethylpyrocarbonate-H2O in a final volume 50 μL. The concentration of the total RNA was estimated by measuring absorbance at 260 nm/280 nm. cDNA was synthesized from 5 μg of RNA using M-MLV reverse transcriptase, oligo(dT) (Promega Co., Madison, WI, USA), and 25 mM deoxynucleotide triphosphate (Takara Co., Ltd., Shiga, Japan). After cDNA synthesis, quantitative realtime PCR was performed in 2 μL of SYBR premix EX Taq (Takara Co., Ltd.) using a StepOnePlusTM Real-Time PCR System with a thermal cycling block (Applied Biosystems, Foster City, CA, USA). Reaction mixtures were incubated for initial denaturation at 95°C for 10 min, followed by 35 cycles of 95°C for 5 s, 60°C for 60 s, and 72°C for 20 s. A comparative cycle of threshold method was employed, using β-actin as an internal control. The primer sequences are shown in Table 2. Values are expressed as fold change over control.
Table 2.
The sequence of primers which used for quantitative real-time PCR
| Name | Reverse | Forward |
|---|---|---|
| PPAR-alpha | CCACAAGCGTCTTCTCAGCCATG | CCCTCTCTCCAGCTTCCAGCCC |
| CPT-1 | AGGTGATGGACTTGTCAAACC | GGAGACAGACACCATCCAACATA |
| SREBP-1c | TGCAGCCTTCATTCTGACAC | AGACTCCAGCCTCACTGGAA |
| β-actin | AGCTCAGTAACAGTCCGCCTAGA | TGTCCACCTTCCAGCAGATGT |
Statistical analysis
Results are expressed as mean ± standard deviation. Statistically significant differences between groups were determined by one-way analysis of variance. SPSS software (version 21.0; SPSS Inc., Chicago, IL, USA) was used for the analysis. Multiple comparisons were performed using Tukey’s test. Data were considered statistically significant at p<0.05 or p<0.01.
RESULTS
Calibration curves for quantifying phlorotannins in ES extract
Calibration curves were constructed from methanolic stock solutions of eckol, dieckol, and phlorofucofuroeckol A, each diluted to an appropriate concentration (Fig. 1). The coefficient of determination (r2) was 0.999. The linearity in this range was sufficient to ensure accurate assays of eckol, dieckol, and phlorofucofuroeckol A in the samples. The precision of the HPLC method for assaying each standard was determined from triplicate measurements. The relative standard deviation (RSD) was <5.0% (Table 3).
Fig. 1.

HPLC chromatogram of eckol, dieckol, phlorofucofuroeckol A, and the ethanolic extract of Ecklonia stolonifera. HPLC, high-performance liquid chromatography.
Table 3.
The regression data, recision and quantification of standard from the ethanolic extract of Ecklonia stolonifera
| Compound | Regression equation | R2 | Linear range (μg/ml) | RSD (%) (n=3) | Contents of phlorotannin in ethanolic extract (μg/g) |
|---|---|---|---|---|---|
| Eckol | y=9606x+572.4 | 0.9999 | 5–100 | 0.2–5.0 | 12.59 ± 0.52 |
| Dieckol | y=16436x−29993 | 0.9999 | 25–500 | 0.1–2.8 | 147.44 ± 2.27 |
| Phlorofuco-furoeckol-A | y=38609x−33773 | 0.9999 | 5–100 | 0.3–1.7 | 12.48 ± 1.06 |
Amounts of phlorotannins in the ethanolic extract of ES
A representative HPLC chromatogram of the ES extract is shown in Fig. 1. Eckol, dieckol, and phlorofucofuroeckol A were successfully analyzed as their peaks were distinct from other peaks in the chromatograms. Using the calibration curves, the amounts of eckol, dieckol, and phlorofucofuroeckol in the extract were determined (Table 3). The eckol, dieckol, and phlorofucofuroeckol A contents in the extract were obtained as 12.0–13.0 g/g, 145–149 g/g, and 11.3–13.5 g/g, respectively.
Body weight gain and fatty liver index
The ED group showed a higher and significant reduction (33%) in body weight than the ND group did. However, body weights were higher in the ED+S and ED+ES groups than in the ED group (Table 4). The ethanol diet increased liver weight and liver-to-body weight ratio regardless of the dietary fat sources. The fatty liver index in the ED group increased by 4% and was higher than that in the ND group. The silymarin and ES treatments improved the ethanol-induced increase in fatty liver index. In particular, the fatty liver index in the rats that were treated with the highest amount of ES (200 mg/kg) was lower than that in the ND group.
Table 4.
Body weight gain and plasma biochemistries of rats fed experimental diets
| ND | ED | Sil | ESL | ESM | ESH | |
|---|---|---|---|---|---|---|
| Body Weight Gain (g/6 weeks) | 106.20 ± 57.95 | 71.00 ± 26.20 | 85.80 ± 43.30* | 71.00 ± 46.66 | 77.30 ± 21.40 | 78.50 ± 33.93 |
| Liver Index (g/100 g body weight) | 2.38 ± 0.21 | 2.47 ± 0.18 | 2.39 ± 0.08 | 2.41 ± 0.17 | 2.39 ± 0.07 | 2.35 ± 0.09 |
| Serum | ||||||
| Free fatty acid (mEq/ml) | 81.00 ± 7.00 | 11.80 ± 8.00 | 86.00 ± 8.00 | 10.30 ± 7.00 | 83.00 ± 17.00 | 76.00 ± 10.00 |
| Triglyceride (g/ml) | 8.43 ± 0.42 | 19.61 ± 2.25** | 12.05 ± 1.48# | 15.77 ± 1.37# | 12.13 ± 1.67# | 11.19 ± 1.05# |
| Total cholesterol (g/ml) | 10.79 ± 1.82 | 18.92 ± 1.72** | 13.64 ± 1.28# | 16.98 ± 2.81# | 13.89 ± 1.84# | 12.56 ± 2.90# |
| HTR(%)‡ | 71.64 ± 11.36 | 30.78 ± 2.21** | 53.54 ± 5.78# | 34.89 ± 4.50# | 50.39 ± 7.24# | 59.80 ± 12.8# |
Data are presented as mean ± standard error mean(SEM) values (n=8).
p<0.05 and
p<0.01 indicates significant differences from ND group;
p<0.01 indicates significant differences from ED group. ND, normal diet; ED, ethanol diet; Sil, ED plus 100 mg/kg silymarin (positive control group); ESL/ESM/ESH, ED plus 50, 100 and 200 mg/kg Ecklonia stolonifera ethanol extract various doses group.
HDL cholesterol to total cholesterol ratio (HTR) = [HDL cholesterol (in mg/dl)=total cholesterol (in mg/dl)]×100.
Levels of serum and hepatic lipids
As shown in Table 4, serum TG and TC levels were significantly (p<0.01) increased and higher in the ED group than in the ND group. However, serum TG and TC levels significantly (p<0.01) decreased in the silymarin and ES treatment groups in a dose-dependent manner, compared with ED group. Additionally, serum FFA levels were decreased by the ES treatment; however, the differences were not statistically significant. Interestingly, FFA levels in the ES-treated (100 and 200 mg/kg/day) groups were similar to those in the ND- and silymarin-treated groups. The HDL-C-to-TC ratio tended to be higher in the ES- and silymarin-treated groups than in the ED group (p<0.01).
Fig. 2 shows that hepatic TC (Fig. 2A) and TG (Fig. 2B) concentrations were 136.4% and 90.7%, respectively, higher (p<0.01) in the ED rats than in the ND rats. During the experimental periods, hepatic TC and TG levels decreased in the ES-treated groups in a dose-dependent manner and were lower than the respective levels in the ED group. Hepatic TC and TG levels in the group administered 100 mg/kg/day of ES were similar to the respective levels in the ED+S group but were significantly decreased in the group administered 200 mg/kg/day of ES (p<0.05).
Fig. 2.
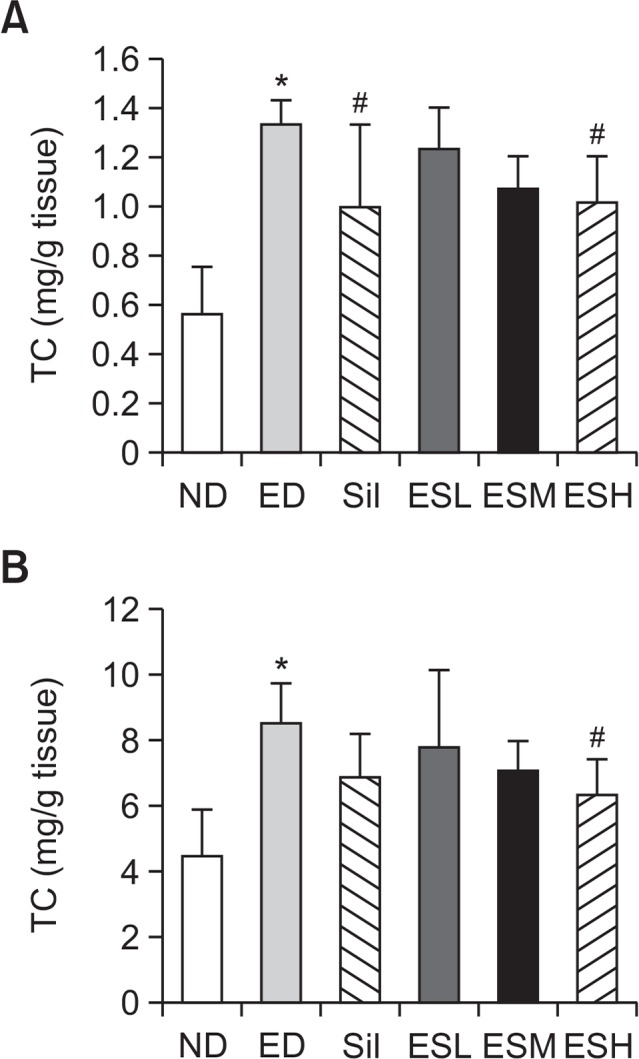
Total cholesterol (A) and triglycerides (B) in the livers of alcohol-fed rats. Hepatic concentrations (mg/dL) of total cholesterol (per g of liver tissue) and triglycerides (per g of liver tissue) were determined. Data are presented as mean ± standard error mean (SEM) (n=8). * indicates p<0.01, comparing with the ND group. # indicates p<0.05, comparing with the ED group. ND, normal diet; ED, ethanol diet; Sil, ED+100 mg/kg silymarin (positive control group); ESL, ESM, and ESH indicate ED+50, 100, or 200 mg/kg, respectively, of the ethanolic extract of Ecklonia stolonifera.
Serum concentrations of AST and ALT
Serum AST (Fig. 3A) and ALT (Fig. 3B) levels increased in the ED, ED+S, and ED+ES groups. The ED group exhibited significantly (p<0.001) higher serum AST and ALT levels than the ND group did. Elevated serum AST and ALT levels in the ED group were significantly decreased by all the administered concentrations of ES (p<0.001).
Fig. 3.
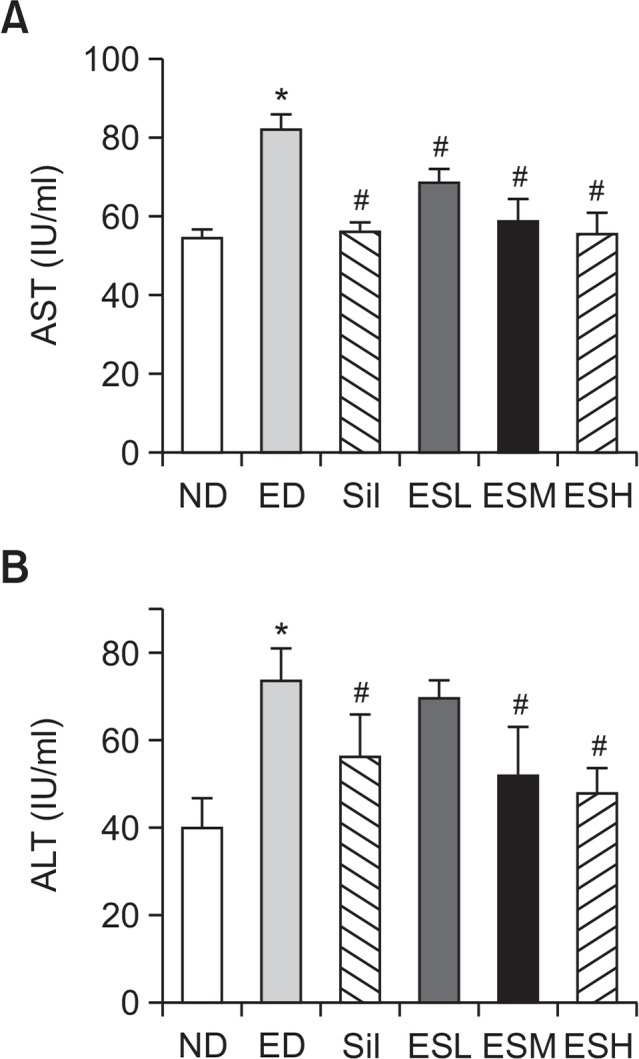
Serum AST (A) and ALT (B) levels in alcohol-fed rats. Data are presented as mean ± standard error mean (SEM) (n=8). * indicates p<0.01, comparing with the ND group. # indicates p<0.01, comparing with the ED group. ALT, alanine aminotransferase; AST, aspartate aminotransferase; ND, normal diet; ED, ethanol diet; Sil, ED+100 mg/kg silymarin (positive control group); ESL, ESM, and ESH indicate ED+50, 100, or 200 mg/kg, respectively, of the ethanolic extract of Ecklonia stolonifera.
Histopathological changes in the livers of ED-fed rats
As shown in Fig. 4, hepatic lipid accumulation was assessed by Oil Red O staining of neutral lipids. The ethanol diet induced a remarkable accumulation of lipid droplets in the liver; however, this was inhibited by ES and silymarin. Especially, ES at concentrations of 100 and 200 mg/kg was more effective in inhibiting the lipid accumulation than did silymarin.
Fig. 4.

Effect of the ethanolic extract of Ecklonia stolonifera on Oil Red O staining of the livers of alcohol-fed rats. ND, normal diet; ED, ethanol diet; Sil, ED+100 mg/kg silymarin (positive control group); ESL, ESM, and ESH indicate ED+50, 100, or 200 mg/kg, respectively, of the ethanolic extract of Ecklonia stolonifera.
Effect of ES on ethanol-induced formation of hepatic MDA
Fig. 5 shows that hepatic MDA levels increased (2.2-fold) after the rats were administered the ethanol diet. The ES treatment protected against chronic ethanol-induced liver damage via inhibition of hepatic MDA production. The 50, 100, and 200 mg/kg doses of the ES extract inhibited hepatic MDA production by 37.2, 47.5, and 45.9%, respectively.
Fig. 5.
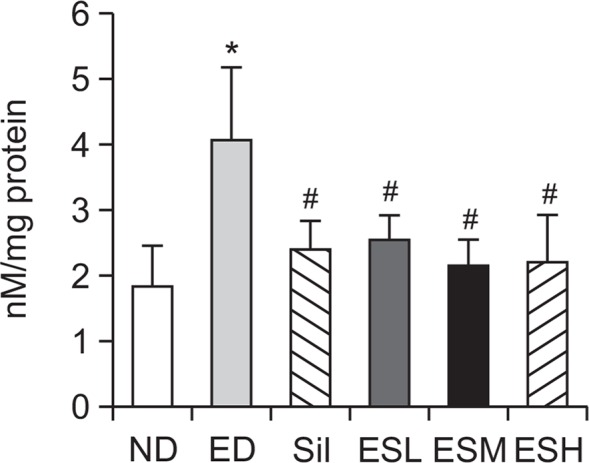
Effect of the ethanolic extract of Ecklonia stolonifera on MDA levels in the livers of alcohol-fed rats. Data are presented as mean ± standard error mean (SEM) (n=8). * indicates p<0.01, comparing with the ND group. # indicates p<0.01, comparing with the ED group. ND, normal diet; ED, ethanol diet; Sil, ED+100 mg/kg silymarin (positive control group); ESL, ESM, and ESH indicate ED+50, 100, or 200 mg/kg, respectively, of the ethanolic extract of Ecklonia stolonifera; MDA, malondialdehyde.
Effect of ES on the expression levels of PPAR-α, CPT-1, and SREBP-1c in ethanol-induced hepatotoxicity
The mRNA expression levels of PPAR-α and CPT-1 in the hepatic tissues were significantly decreased by the ethanol diet (Fig. 6). However, the expression levels of the genes were increased by the ES treatment in a dose-dependent manner. SREBP-1c levels were significantly (p<0.01) higher in the ED group than in the ND group, but significantly (p<0.05 or p<0.01) lower in the ED+ES groups than in the ED group.
Fig. 6.

PPAR-α, CPT-1, and SREBP-1c gene expression levels in the livers of alcohol-fed rats. Data are presented as mean ± standard error mean (SEM) (n=8). * indicates p<0.05 and ** indicates p<0.01, comparing with the ND group. # indicates p<0.05 and ## indicates p<0.01, comparing with the ED group. ND, normal diet; ED, ethanol diet; Sil, ED+100 mg/kg silymarin (positive control group); ESL, ESM, and ESH indicate ED+50, 100, or 200 mg/kg, respectively, of the ethanolic extract of Ecklonia stolonifera; PPAR-α, peroxisome proliferator-activated receptor α; CPT-1, carnitine acyl transferase 1; SREBP-1c, sterol regulatory element-binding protein 1.
DISCUSSION
In previous studies (Kim et al., 2005, 2009), several antioxidative phlorotannins, including dioxinodehydroeckol and phlorofucofuroeckol, isolated from ES have shown hepatoprotective effects against tacrine-induced cytotoxicity in HepG2 cells. Phlorotannins are a group of marine algal polyphenols found only in brown algae. They are polymers of phloroglucinol (1,3,5-trihydroxybenzene) (Ragan and Glombitza, 1986). Phlorotannins have been shown to possess diverse biological activities, including antioxidant (Zou et al., 2008) and antimelanogenetic (Yoon et al., 2009) effects. Triphlorethol-A and eckol, which are isolated from Ecklonia cava, have been reported to protect cells against oxidative damage by reducing reactive oxygen species (ROS) production or by enhancing cellular antioxidant activity (Kang et al., 2005). Recently, a study demonstrated the antioxidant and antiinflammatory properties of phlorotannins (Kim et al., 2011).
In the current study, we investigated the hepatoprotective effect of the ethanolic extract of ES against fatty liver induced by chronic alcohol feeding to rats.
With regard to alcoholic fatty liver disease, a change in NADH/NAD+ redox potential in the liver due to excessive or chronic alcohol consumption results in a decrease in mitochondria β-oxidation of fatty acids. This further results in a reduction in lipid expenditure (Wu et al., 2011). In the present study, consumption of the Lieber-DeCarli liquid diet for 6 weeks stunted the normal growth of the rats. This was evidenced by minimal body weight gain and increased fatty liver index in the ED group. Serum and hepatic lipid levels (Table 4, Fig. 2), AST and ALT activities (Fig. 3), liver histology, and results of the Oil Red O staining (Fig. 3) indicated that ethanol diet-induced alcoholic fatty liver was ameliorated by ES and silymarin treatments. Chronic alcohol consumption increases mobilization of fatty acids from adipose tissues (Feigelson et al., 1961) or fatty acid synthesis in the liver. The presence of fatty acids in the liver facilitates the formation of TGs and phospholipids (Abrams and Cooper, 1976; Cairns and Peters, 1983). Moreover, alcohol feeding increases cholesterol synthesis (Lefevre et al., 1972), decreases fatty acid oxidation in the liver, and attenuates lipid secretion into serum or bile (Blomstrand and Kager, 1973).
The metabolism of ethanol by CYP2E1, a member of the P450 family with generalized tissue expression and high catalytic activity toward ethanol, generates a large amount of ROS (Lieber, 1997). This process plays a central role in how ethanol causes oxidative stress in the liver (Lieber, 1997; Cederbaum, 2010). The expression level of CYP2E1 in the liver is high because nearly 80% of ingested ethanol is metabolized in the liver. As a result, the liver is highly vulnerable to ethanol-induced oxidative damage (Lieber, 1997; Bailey and Cunningham, 2002). Chronic ethanol consumption causes liver damage, which is evidenced by an increase in hepatic MDA levels (Chiu et al., 2011). In a previous study, increase in lipid peroxidation was ‘restored’ in ethanol-fed CYP2E1 KI mice (2.8-fold increase in MDA) (Cederbaum, 2010). In the present study, the increase in lipid peroxidation in the rat livers suggested that the Lieber-DeCarli liquid diet increased ROS production, which then resulted in oxidative damage (Fig. 4, 5). Alcohol consumption causes downregulation of PPAR-α and CPT-1 genes and upregulation of SREBP-1c gene in the rat liver (Horton et al., 2002; You et al., 2004). As shown in Fig. 6, PPAR-α and CPT-1 were downregulated in the ED group but upregulated in the ED+ES and ED+S groups. Furthermore, treatment of the rats with the highest dose of ES (200 mg/kg) normalized alcohol-induced changes in hepatic gene expression, which is implicated in fatty acid synthesis, such as SREBP-1c (Fig. 6).
In conclusion, the ethanolic extract of ES has a protective effect against alcohol-induced fatty liver in rats. The mechanisms underlying the hepatoprotective effect of the ES extract may be related to inhibition of SREBP-1c expression, increased expression of fatty acid oxidation-related genes (e.g., PPAR-α and CPT-1), and alleviation of lipid peroxidation (e.g., via reduced hepatic MDA levels) through scavenging of free radicals.
Acknowledgments
This study was supported by the Fisheries Commercialization Technology Development Program (Project No. 811001-3) from the Ministry for Food, Agriculture, Forestry, and Fisheries, Republic of Korea.
REFERENCES
- Abrams MA, Cooper C. Quantitative analysis of metabolism of hepatic triglyceride in ethanol-treated rats. Biochem J. 1976;156:33–46. doi: 10.1042/bj1560033. [DOI] [PMC free article] [PubMed] [Google Scholar]
- Bailey SM, Cunningham CC. Contribution of mitochondria to oxidative stress associated with alcoholic liver disease. Free Radic Biol Med. 2002;32:11–16. doi: 10.1016/S0891-5849(01)00769-9. [DOI] [PubMed] [Google Scholar]
- Blomstrand R, Kager L. The combustion of triolein-1-14C and its inhibition by alcohol in man. Life Sci. 1973;13:113–123. doi: 10.1016/0024-3205(73)90186-0. [DOI] [PubMed] [Google Scholar]
- Buege JA, Aust SD. Microsomal lipid peroxidation. Methods Enzymol. 1978;52:302–310. doi: 10.1016/S0076-6879(78)52032-6. [DOI] [PubMed] [Google Scholar]
- Cairns SR, Peters TJ. Biochemical analysis of hepatic lipid in alcoholic and diabetic and control subjects. Clin Sci. 1983;65:645–652. doi: 10.1042/cs0650645. [DOI] [PubMed] [Google Scholar]
- Cederbaum AI. Role of CYP2E1 in ethanol-induced oxidant stress, fatty liver and hepatotoxicity. Dig Dis. 2010;28:802–811. doi: 10.1159/000324289. [DOI] [PMC free article] [PubMed] [Google Scholar]
- Chiu PY, Lam PY, Leung HY, Leong PK, Ma CW, Tang QT, Ko KM. Co-treatment with Shengmai San-derived herbal product ameliorates chronic ethanol-induced liver damage in rats. Rejuvenation Res. 2011;14:17–23. doi: 10.1089/rej.2010.1041. [DOI] [PubMed] [Google Scholar]
- DeCarli LM, Lieber CS. Fatty liver in the rat after prolonged intake of ethanol with a nutritionally adequate new liquid diet. J Nutr. 1967;91:331–336. doi: 10.1093/jn/91.3_Suppl.331. [DOI] [PubMed] [Google Scholar]
- Feigelson EB, Pfaff WW, Karmen A, Steinberg D. The role of plasma free fatty acids in development of fatty liver. J Clin Invest. 1961;40:2171–2179. doi: 10.1172/JCI104443. [DOI] [PMC free article] [PubMed] [Google Scholar]
- Folch J, Lees M, Sloane-Stanley G. A simple method for the isolation and purification of total lipids from animal tissues. J Biol Chem. 1957;226:497–509. [PubMed] [Google Scholar]
- Gearing KL, Göttlicher M, Widmark E, Banner CD, Tollet P, Strömstedt M, Rafter JJ, Berge RK, Gustafsson JA. Fatty acid activation of the peroxisome proliferator activated receptor, a member of the nuclear receptor gene superfamily. J Nutr. 1994;124:1284S–1288S. doi: 10.1093/jn/124.suppl_8.1284S. [DOI] [PubMed] [Google Scholar]
- Goo HR, Choi JS, Na DH. Quantitative determination of major phlorotannins in Ecklonia stolonifera. Arch Pharm Res. 2010;33:539–544. doi: 10.1007/s12272-010-0407-y. [DOI] [PubMed] [Google Scholar]
- Horton JD, Goldstein JL, Brown MS. SREBPs: activators of the complete program of cholesterol and fatty acid synthesis in the liver. J Clin Invest. 2002;109:1125–1131. doi: 10.1172/JCI0215593. [DOI] [PMC free article] [PubMed] [Google Scholar]
- Horton JD, Shimomura I, Brown MS, Hammer RE, Goldstein JL, Shimano H. Activation of cholesterol synthesis in preference to fatty acid synthesis in liver and adipose tissue of transgenic mice overproducing sterol regulatory element-binding protein-2. J Clin Invest. 1998;101:2331–2339. doi: 10.1172/JCI2961. [DOI] [PMC free article] [PubMed] [Google Scholar]
- Ji C, Kaplowitz N. Betaine decreases hyperhomocysteinemia, endoplasmic reticulum stress, and liver injury in alcohol-fed mice. Gastroenterology. 2003;124:1488–1499. doi: 10.1016/S0016-5085(03)00276-2. [DOI] [PubMed] [Google Scholar]
- Joe MJ, Kim SN, Choi HY, Shin WS, Park GM, Kang DW, Kim YK. The inhibitory effects of eckol and dieckol from Ecklonia stolonifera on the expression of matrix metalloproteinase-1 in human dermal fibroblasts. Biol Pharm Bull. 2006;29:1735–1739. doi: 10.1248/bpb.29.1735. [DOI] [PubMed] [Google Scholar]
- Jung HA, Hyun SK, Kim HR, Choi JS. Angiotensin-converting enzyme I inhibitory activity of phlorotannins from Ecklonia stolonifera. Fisheries Sci. 2006;72:1292–1299. doi: 10.1111/j.1444-2906.2006.01288.x. [DOI] [Google Scholar]
- Kang HS, Kim HR, Byun DS, Son BW, Nam TJ, Choi JS. Tyrosinase inhibitors isolated from the edible brown alga Ecklonia stolonifera. Arch Pharm Res. 2004;27:1226–1232. doi: 10.1007/BF02975886. [DOI] [PubMed] [Google Scholar]
- Kang KA, Lee KH, Chae S, Koh YS, Yoo BS, Kim JH, Ham YM, Baik JS, Lee NH, Hyun JW. Triphlorethol-A from Ecklonia cava protects V79-4 lung fibroblast against hydrogen peroxide induced cell damage. Free Radic Res. 2005;39:883–892. doi: 10.1080/10715760500161165. [DOI] [PubMed] [Google Scholar]
- Kim AR, Lee MS, Shin TS, Hua H, Jang BC, Choi JS, Byun DS, Utsuki T, Ingram D, Kim HR. Phlorofucofuroeckol A inhibits the LPS-stimulated iNOS and COX-2 expressions in macrophages via inhibition of NF-κB, Akt, and p38 MAPK. Toxicol. In vitro. 2011;25:1789–1795. doi: 10.1016/j.tiv.2011.09.012. [DOI] [PubMed] [Google Scholar]
- Kim AR, Shin TS, Lee MS, Park JY, Park KE, Yoon NY, Kim JS, Choi JS, Jang BC, Byun DS, Park NK, Kim HR. Isolation and identification of phlorotannins from Ecklonia stolonifera with antioxidant and anti-inflammatory properties. J Agric Food Chem. 2009;57:3483–3489. doi: 10.1021/jf900820x. [DOI] [PubMed] [Google Scholar]
- Kim YC, An RB, Yoon NY, Nam TJ, Choi JS. Hepatoprotective constituents of the edible brown alga Ecklonia stolonifera on tacrine-induced cytotoxicity in HepG2 cells. Arch Pharm Res. 2005;28:1376–1380. doi: 10.1007/BF02977904. [DOI] [PubMed] [Google Scholar]
- Kuda T, Kunii T, Goto H, Suzuki T, Yano T. Varieties of antioxidant and antibacterial properties of Ecklonia stolonifera and Ecklonia kurome products harvested and processed in the Noto peninsula, Japan. Food Chem. 2007;103:900–905. doi: 10.1016/j.foodchem.2006.09.042. [DOI] [Google Scholar]
- Laramée P, Kusel J, Leonard S, Aubin HJ, François C, Daeppen JB. The economic burden of alcohol dependence in Europe. Alcohol Alcohol. 2013;48:259–269. doi: 10.1093/alcalc/agt004. [DOI] [PubMed] [Google Scholar]
- Lee GY, Kim NH, Zhao ZS, Cha BS, Kim YS. Peroxisomal-proliferator-activated receptor alpha activates transcription of the rat hepatic malonyl-CoA decarboxylase gene: a key regulation of malonyl-CoA level. Biochem J. 2004;378:983–990. doi: 10.1042/bj20031565. [DOI] [PMC free article] [PubMed] [Google Scholar]
- Lee JH, Oh HY, Choi JS. Preventive effect of Ecklonia stolonifera on the frequency of benzo(a)pyrene-induced chromosomal aberrations. J Food Sci Nutr. 1996;1:64–68. [Google Scholar]
- Lee MS, Shin T, Utsuki T, Choi JS, Byun DS, Kim HR. Isolation and identification of phlorotannins from Ecklonia stolonifera with antioxidant and hepatoprotective properties in tacrine-treated HepG2 cells. J Agric Food Chem. 2012;60:5340–5349. doi: 10.1021/jf300157w. [DOI] [PubMed] [Google Scholar]
- Lefevre AF, DeCarli LM, Lieber CS. Effect of ethanol on cholesterol and bile acid metabolism. J Lipid Res. 1972;13:48–55. [PubMed] [Google Scholar]
- Lieber CS. Cytochrome P-4502E1: its physiological and pathological role. Physiol Rev. 1997;77:517–544. doi: 10.1152/physrev.1997.77.2.517. [DOI] [PubMed] [Google Scholar]
- Lieber CS, Decarli LM. Liquid diet technique of ethanol administration: 1989 update. Alcohol Alcohol. 1989;24:197–211. [PubMed] [Google Scholar]
- Moon HE, Islam MN, Ahn BR, Chowdhury SS, Sohn HS, Jung HA, Choi JS. Protein tyrosine phosphatase 1B and α-glucosidase inhibitory phlorotannins from edible brown algae, Ecklonia stolonifera and Eisenia bicyclis. Biosci Biotechnol Biochem. 2011;75:1472–1480. doi: 10.1271/bbb.110137. [DOI] [PubMed] [Google Scholar]
- Munday MR, Hemingway CJ. The regulation of acetyl-CoA carboxylase-a potential target for the action of hypolipidemic agents. Adv Enzyme Regul. 1999;39:205–234. doi: 10.1016/S0065-2571(98)00016-8. [DOI] [PubMed] [Google Scholar]
- Park CS, Hwang EK, Lee SJ, Roh KW, Sohn CH. Age and Growth of Ecklonia stolonzfera Okamura in Pusan Bay, Korea. Bull Korean Fish Soc. 1994;27:390–396. doi: 10.1007/s11814-010-0083-0. [DOI] [Google Scholar]
- Ragan MA, Glombitza KW. Phlorotannins, brown algal polyphenols. Prog Phycol Res. 1986;4:129–241. [Google Scholar]
- Shield KD, Rylett M, Gmel G, Gmel G, Kehoe-Chan TA, Rehm J. Global alcohol exposure estimates by country, territory and region for 2005-a contribution to the Comparative Risk Assessment for the 2010 Global Burden of Disease Study. Addiction. 2013;108:912–922. doi: 10.1111/add.12112. [DOI] [PubMed] [Google Scholar]
- Shim SY, Choi JS, Byun DS. Inhibitory effects of phloroglucinol derivatives isolated from Ecklonia stolonifera on FcεRI expression. Bioorg Med Chem. 2009;17:4734–4739. doi: 10.1016/j.bmc.2009.04.050. [DOI] [PubMed] [Google Scholar]
- Teli M, Day C, James O, Burt A, Bennett M. Determinants of progression to cirrhosis or fibrosis in pure alcoholic fatty liver. Lancet. 1995;346:987–990. doi: 10.1016/S0140-6736(95)91685-7. [DOI] [PubMed] [Google Scholar]
- Wu MT, Tzang BS, Chang YY, Chiu CH, Kang WY, Huang CH, Chen YC. Effects of Antrodia camphorata on alcohol clearance and antifibrosis in livers of rats continuously fed alcohol. J Agric Food Chem. 2011;59:4248–4254. doi: 10.1021/jf104561h. [DOI] [PubMed] [Google Scholar]
- Yoon NY, Chung HY, Kim HR, Choi JS. Acetyl- and butyrylcholinesterase inhibitory activities of sterols and phlorotannins from Ecklonia stolonifera. Fisheries Sci. 2008a;74:200–207. doi: 10.1111/j.1444-2906.2007.01511.x. [DOI] [Google Scholar]
- Yoon NY, Eom TK, Kim MM, Kim SK. Inhibitory effect of phlorotannins isolated from Ecklonia cava on mushroom tyrosinase activity and melanin formation in mouse B16F10 melanoma cells. J Agric Food Chem. 2009;57:4124–4129. doi: 10.1021/jf900006f. [DOI] [PubMed] [Google Scholar]
- Yoon NY, Kim HR, Chung HY, Choi JS. Anti-hyperlipidemic effect of an edible brown algae, Ecklonia stolonifera, and its constituents on poloxamer 407-induced hyperlipidemic and cholesterol-fed rats. Arch Pharm Res. 2008b;31:1564–1571. doi: 10.1007/s12272-001-2152-8. [DOI] [PubMed] [Google Scholar]
- You M, Crabb DW. Recent advances in alcoholic liver disease II. Minireview: molecular mechanisms of alcoholic fatty liver. Am J Physiol Gastrointest Liver Physiol. 2004;287:G1–G6. doi: 10.1152/ajpgi.00056.2004. [DOI] [PubMed] [Google Scholar]
- You M, Fischer M, Deeg MA, Crabb DW. Ethanol induces fatty acid synthesis pathways by activation of sterol regulatory element-binding protein (SREBP) J Biol Chem. 2002;277:29342–29347. doi: 10.1074/jbc.M202411200. [DOI] [PubMed] [Google Scholar]
- You M, Matsumoto M, Pacold CM, Cho WK, Crabb DW. The role of AMP-activated protein kinase in the action of ethanol in the liver. Gastroenterology. 2004;127:1798–1808. doi: 10.1053/j.gastro.2004.09.049. [DOI] [PubMed] [Google Scholar]
- Zeng T, Xie KQ. Ethanol and liver: recent advances in the mechanisms of ethanol-induced hepatosteatosis. Arch Toxicol. 2009;83:1075–1081. doi: 10.1007/s00204-009-0457-4. [DOI] [PubMed] [Google Scholar]
- Zou Y, Qian ZJ, Li Y, Kim MM, Lee SH, Kim SK. Antioxidant effects of phlorotannins isolated from Ishige okamurae in free radical mediated oxidative systems. J Agric Food Chem. 2008;56:7001–7009. doi: 10.1021/jf801133h. [DOI] [PubMed] [Google Scholar]