Significance
Glycine-activated ionotropic glutamate receptors (iGluRs) encoded in ctenophore genomes are evolutionary precursors to NMDA receptors, which play important roles in synaptic plasticity. Ctenophore iGluRs feature a distinct interdomain salt bridge in the ligand-binding domain, a molecular lock, that thus far has not been found in iGluRs of other organisms. We use a combination of crystallographic, biochemical, electrophysiological, and computational approaches to elucidate the role of this molecular lock in a ctenophore iGluR. We find that perturbations to the lock can tune receptor kinetics and thermodynamics over very broad ranges. We also find that the strategic location of the lock may be the basis for the ligand-binding domain's extraordinarily high affinity for glycine.
Keywords: glutamate receptors, X-ray crystallography, electrophysiology, molecular dynamics simulations, free energy calculations
Abstract
The earliest metazoan ancestors of humans include the ctenophore Mnemiopsis leidyi. The genome of this comb jelly encodes homologs of vertebrate ionotropic glutamate receptors (iGluRs) that are distantly related to glycine-activated NMDA receptors and that bind glycine with unusually high affinity. Using ligand-binding domain (LBD) mutants for electrophysiological analysis, we demonstrate that perturbing a ctenophore-specific interdomain Arg-Glu salt bridge that is notably absent from vertebrate AMPA, kainate, and NMDA iGluRs greatly increases the rate of recovery from desensitization, while biochemical analysis reveals a large decrease in affinity for glycine. X-ray crystallographic analysis details rearrangements in the binding pocket stemming from the mutations, and molecular dynamics simulations suggest that the interdomain salt bridge acts as a steric barrier regulating ligand binding and that the free energy required to access open conformations in the glycine-bound LBD is largely responsible for differences in ligand affinity among the LBD variants.
Glutamate receptor ion channels (iGluRs) are membrane proteins that mediate excitatory synaptic transmission in the brain by detecting release of the amino acid glutamate from nerve terminals (1). In combination with GluN2 subunits, which bind glutamate, NMDA subtype iGluRs use glycine as a coagonist, which binds to GluN1, GluN3A, and GluN3B subunits (2–6). NMDA receptors play key roles in synaptic plasticity and memory formation, and mutations of NMDA receptor genes underlie a diverse set of neurological and psychiatric diseases (7). Like all iGluRs, NMDA receptors are assembled from modular subunits containing amino terminal and S1S2 ligand binding domains (LBDs), which can be genetically isolated and expressed as soluble proteins for biochemical and structural analysis (4, 8–10). The LBDs of both the glutamate and glycine binding subunits are clamshell-shaped proteins of molecular mass around 30 kDa in which two lobes are connected by a hinge formed by antiparallel β-strands; in the activated state, ligands are trapped in a cavity formed when the clamshell closes. Strikingly, the volume of the ligand binding cavity for the GluN1, GluN3A, and GluN3B subunits is just large enough to accommodate glycine, whereas iGluR glutamate binding subunits have cavities that are four to five times larger and bind both glutamate and up to six or seven water molecules (4, 10–13).
We recently reported the discovery of glycine-activated iGluRs from the comb jelly Mnemiopsis leidyi and the sea gooseberry Pleurobrachia bachei, candidates for earliest lineage metazoans, for which ML032222a and PbGluR3 glycine complex crystal structures reveal a salt bridge at the perimeter of the ligand binding cleft (14). This salt bridge links the upper and lower lobes of the LBD in the closed cleft glycine-bound conformation. Ctenophore iGluR subunits bind glycine with such high affinity that the ligand cannot be removed by exhaustive dialysis, suggesting an unusually stable ligand-bound closed-cleft conformation, perhaps stabilized by the interdomain salt bridge. Prior electrophysiological and crystallographic studies on vertebrate AMPA and kainate subtype iGluRs revealed that the stability of the closed cleft conformation is determined not only by contacts of the LBD with the neurotransmitter ligand but also by contacts formed between the upper and lower lobes of the clamshell assembly that occur only in the ligand-bound closed-cleft conformation (15, 16). Comparison of crystal structures of ctenophore iGluR LBDs with those of vertebrate NMDA receptor GluN1 and GluN3 subunits that also bind glycine, but for which apo proteins can be prepared without difficulty (4, 10), reveals that the salt bridge is unique to ctenophore iGluRs, further suggesting that it might underlie the high stability of the glycine complex.
To investigate this, we prepared ML032222a mutant proteins and analyzed their ligand binding properties using electrophysiological, biochemical, and crystallographic techniques. To gain further insight into how these mutants perturb large-scale LBD dynamics, we computed conformational free energy landscapes for the apo state and glycine complexes of wild-type (WT) ML032222a and the R703K and E423S mutants, which weaken and break the interdomain salt bridge, respectively. This analysis reveals that, similar to vertebrate GluN1 and GluN3 glycine binding subunits, the apo state for ML032222a can access closed cleft conformations, although it is more stable in slightly open conformations. The R703K and E423S mutants destabilize closed cleft conformations for the glycine complex. Conformational dynamics inferred from the free energy landscapes suggest that the interdomain salt bridge is positioned at the most likely point of ligand entry to (and exit from) the binding pocket and thus acts as a steric barrier regulating the binding and dissociation of glycine.
Results
Interdomain Salt Bridge Mutants Regulate Recovery from Desensitization.
ML032222a from the comb jelly M. leidyi forms a homomeric glycine-activated ion channel with rapid onset but extremely slow recovery from desensitization (14). We hypothesized that the unusually slow recovery from desensitization for ML032222a, which lasts for several minutes, occurs because the glycine bound LBD is trapped in a closed cleft conformation by a lock at the entrance to the binding site (Fig. 1A) and that the receptor cannot recover from desensitization until the clamshell opens and glycine dissociates. In the ML032222a LBD crystal structure, this lock is formed by an interdomain salt bridge between Glu423 in lobe 1 and Arg703 in lobe 2 (Fig. 1B). To weaken this interaction we prepared two mutants, ML032222a R703K and ML032222a E423S, and expressed them in Xenopus oocytes for electrophysiological analysis. Twin pulse applications of glycine for WT ML032222a revealed that recovery from desensitization required several minutes (Fig. 1C), with progressively faster recovery for the R703K (Fig. 1D) and E423S mutants (Fig. 1E); when fit with exponential functions, the rate constant for recovery from desensitization increased 4-fold for the R703K mutant and 61-fold for the E423S mutant (Fig. 1F) [rate constant: 0.016 ± 0.003 s−1 for WT (n = 4), 0.061 ± 0.003 s−1 for R703K (n = 3), and 0.96 ± 0.06 s−1 for E423S (n = 3)].
Fig. 1.
Salt bridge mutants speed recovery from desensitization. (A) Crystal structure of the WT ML032222a iGluR LBD (PDB ID code 4YKI). Lobe 1 is colored gold and lobe 2 colored pale green; labels indicate secondary structure helix assignments. (B) Zoomed view of the entrance to the WT ML032222a binding site showing the interdomain salt bridge formed by the side chains of Glu423 in lobe 1 (gold) and Arg703 in lobe 2 (pale green). (C) WT ML032222a responses to paired 5-s applications of glycine in which the interval between the first and second application was varied from 10 s to 5 min to measure the rate of recovery from desensitization. (D) ML032222a R703K mutant responses to paired 5-s applications of glycine in which the interval between the first and second pulse was varied from 10 to 90 s. (E) ML032222a E423S mutant responses to paired 5-s applications of glycine in which the interval between the first and second pulse was varied from 2 to 5 s. (F) Bar plot showing the rate constant for recovery from desensitization for WT ML032222a and the R703K and E423S mutants; error bars show SEM for three to four observations.
Interdomain Salt Bridge Mutants Lower Affinity for Glycine.
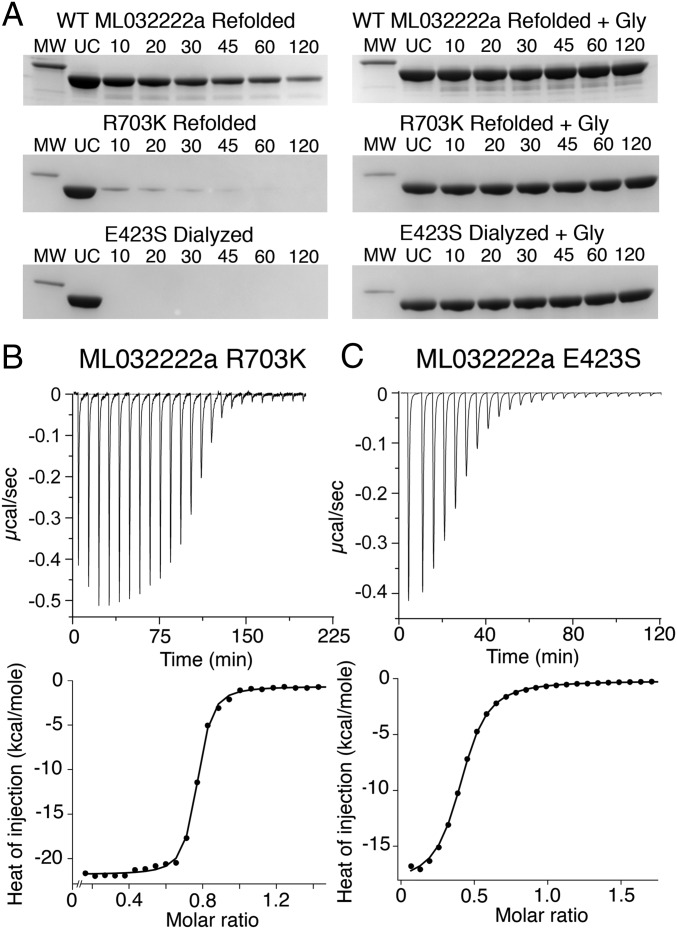
The S1S2 LBD of ML032222a expressed as a soluble protein binds glycine with an affinity of 2.3 nM and is resistant to proteolysis by trypsin unless it is dialyzed in the unfolded state to remove endogenous glycine that remains bound during purification (14). Proteolysis protection assays revealed that similar to the WT protein, unfolding and dialysis in 4 M guanadinium was also required to prepare apo protein for the R703K mutant, whereas by contrast, for the E423S mutant, apo protein could be prepared by exhaustive dialysis without the need for unfolding (Fig. 2A). Similar to WT ML032222a, both mutants became resistant to digestion by trypsin following addition of glycine to the refolded apo protein, indicating that they remain competent to bind glycine (Fig. 2A), consistent with the results of electrophysiological experiments that show activation of ion channel gating by glycine (Fig. 1). Using refolded or dialyzed proteins as appropriate, we then performed isothermal titration calorimetry (ITC) to measure the thermodynamics of ligand binding. In previously published work, we obtained a Kd of 2.7 nM (95% CI: 1.03, 4.95 nM) for WT ML032222a; binding was strongly exothermic (∆G, −11.50 kcal/mol; ∆H, −17.34 kcal/mol; T∆S, −5.84 kcal/mol) (14). For the R703K mutant, the Kd increased 10-fold to 28.3 nM (95% CI: 19.1, 40.9 nM); binding remained exothermic (∆G, −10.12 kcal/mol; ∆H, −21.13 kcal/mol; T∆S, −11.01 kcal/mol) (Fig. 2B). For the E423S mutant, the Kd increased nearly three orders of magnitude to 2.48 µM (95% CI: 2.16, 2.84 µM); binding remained exothermic (∆G, −7.52 kcal/mol; ∆H, −18.11 kcal/mol; T∆S, −10.59 kcal/mol) (Fig. 2C). These results suggest that faster recovery from desensitization for the mutant proteins observed in electrophysiological experiments (Fig. 1) is a direct consequence of disrupting the interdomain salt bridge lock.
Fig. 2.
Salt bridge mutants lower affinity for glycine. (A) Proteolysis protection assays for refolded WT ML032222a S1S2 (Top); refolded R703K mutant (Middle); and exhaustively dialyzed E423S mutant (Bottom). (Left) Coomassie blue stained SDS/PAGE experiments show the time course of digestion by trypsin; (Right) protection by 1 mM glycine; lanes show a 31-kDa marker (MW), uncut protein (UC), and samples at the indicated times in minutes after addition of trypsin. (B) Titration of refolded ML032222a R703K by glycine analyzed by ITC, with raw (Top) and integrated (Bottom) data fit with a binding isotherm of Kd = 28 nM. (C) Titration of ML032222a E423S by glycine analyzed by ITC, with raw (Top) and integrated (Bottom) data fit with a binding isotherm of Kd = 2.5 µM.
Crystal Structures of Interdomain Salt Bridge Mutants.
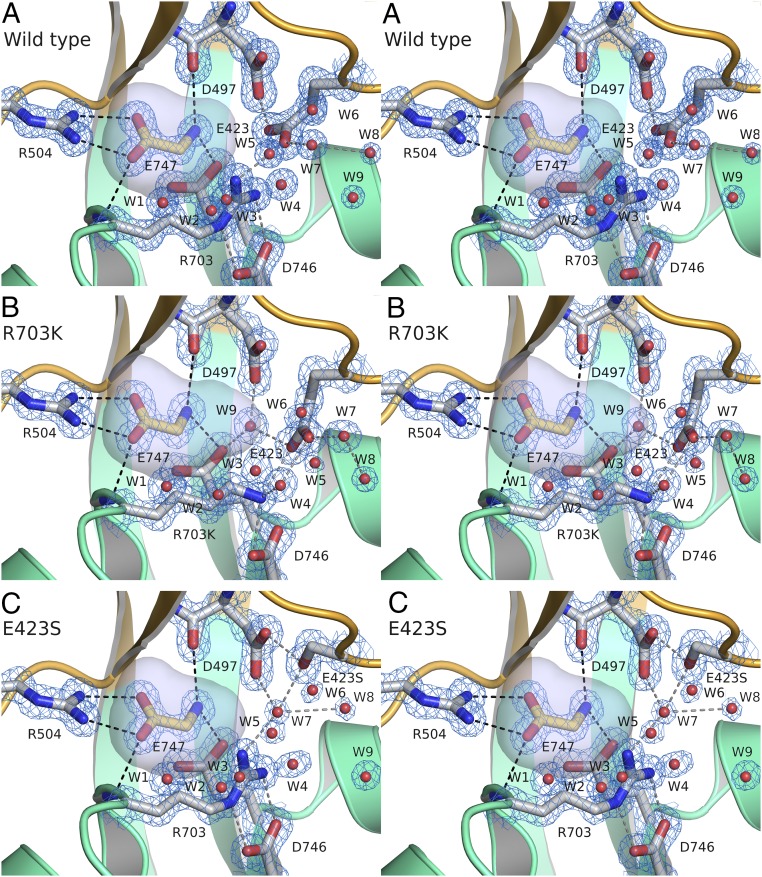
In the presence of glycine, the R703K and E423S mutant S1S2 LBDs crystallized as dimer assemblies in the same space group as the WT protein and diffracted X-rays to Bragg spacings of 1.34 and 1.28 Å, respectively (Table 1); electron density was well resolved for the mutant side chains, the glycine ligand, and the numerous solvent molecules flanking the binding site (Fig. 3). Least squares superpositions using 203 Cα atom coordinates for the R703K and E423S mutants revealed essentially identical conformations to the WT protein (RMSD, 0.26 and 0.20 Å, respectively). In all three structures, glycine binds in a cavity, the sides and top of which are formed by the apposed surfaces of lobes 1 and 2. In the R703K and E423S mutants the bound glycine ligand forms the same series of contacts as occurs in the WT protein; the glycine ligand α-carboxyl group is bound by the main chain amide of Ser499 and the side chain of Arg504 in lobe 1 and by the main chain amide nitrogen of His-505 in lobe 2; the glycine α-amino group is bound by the main chain carbonyl oxygen of Asp497 and the side chain hydroxyl group of Ser499 in lobe 1 and by the side chain of Glu747 in lobe 2 (Fig. 3).
Table 1.
Data collection and refinement statistics
| R703K | E423S | |
| Data collection | ||
| Space group | P21 | P21 |
| Unit cell a, b, c (Å) | 45.7, 123.4, 54.3 | 45.9, 123.1, 54.5 |
| α, β, γ | 90, 112.2, 90 | 90, 111.7, 90 |
| Number per a.u. | 2 | 2 |
| Wavelength (Å) | 1.0000 | 1.0000 |
| Resolution (Å)* | 40.0–1.34 | 40–1.28 (1.30) |
| Unique observations | 124,471 | 144,111 |
| Mean redundancy† | 4.4 (2.6) | 4.5 (3.3) |
| Completeness (%)† | 97.8 (72.9) | 96.6 (81.9) |
| Rmerge†,‡, | 0.045 (0.365) | 0.040 (0.323) |
| Rpim†,§ | 0.024 (0.261) | 0.021 (0.201) |
| I/σ(I)† | 31.1 (2.4) | 34.9 (3.5) |
| Refinement | ||
| Resolution (Å) | 39.0–1.34 | 39.1–1.28 |
| Protein atoms (AC)¶ | 4,109 (107) | 4,217 (217) |
| Ligand atoms | 10 | 10 |
| Mg/SO4 ions | 1/1 | 1/1 |
| Water atoms | 780 | 664 |
| Rwork/Rfree (%)|| | 14.3/16.7 | 13.4/15.7 |
| RMSD | ||
| Bond lengths (Å) | 0.009 | 0.027 |
| Bond angles ° | 1.24 | 1.27 |
| Mean B-values (Å2) | ||
| Protein overall | 17.8 | 20.4 |
| MC/SC# | 15.9/19.7 | 19.6/22.1 |
| Ligand | 9.3 | 11.6 |
| Mg/SO4 ions | 8.9/47.4 | 17.4/55.6 |
| Water | 31.0 | 30.7 |
| Ramachandran %** | 97.7/0.60 | 98.8/1.3 |
Values in parentheses indicate the low-resolution limit for the highest-resolution shell of data.
Values in parentheses indicate statistics for the highest-resolution shell of data.
Rmerge = , where is the mean over symmetry–equivalent reflections.
Rpim = , where is the mean over symmetry-equivalent reflections.
Alternate conformations.
Rwork = , where and denote observed and calculated structure factors, respectively; 5% of the reflections were set aside for the calculation of the Rfree value.
Main chain/side chain.
Preferred/disallowed conformations.
Fig. 3.
Salt bridge mutant crystal structures. (A) Crystal structure stereoview of the WT ML032222a binding pocket, with a 1.21-Å resolution 2mFo-DFc electron density map contoured at 2σ for ligand and protein, and 3σ for water molecules; secondary structure elements for the S1 and S2 segments are colored gold and green, respectively; side chains involved in ligand binding and interdomain contacts are drawn in stick representation, with ion pair and hydrogen bond contacts drawn as dashed lines; water molecules flanking the entrance to the binding site are shown as red spheres; note the hydrogen bond contact of W9 with the Glu423 side chain; the surface of the ligand binding pocket is shaded in gray. (B) Crystal structure stereoview of the ML032222a R703K mutant binding pocket colored as above with a 1.34-Å resolution 2mFo-DFc electron density map contoured at 2σ; note the change in side chain torsion angle for Glu423, movement of water molecules W7 and W8, and interposition of W9 between the side chains of Glu747 and Asp497. (C) Crystal structure stereoview of the ML032222a E423S mutant binding pocket colored as above with a 1.28-Å resolution 2mFo-DFc electron density map contoured at 2σ for ligand and protein and 2.5σ for water molecules; note movement of W7 into the position occupied by the E423 γ-COOH group in the WT receptor and the accompanying movement of W8.
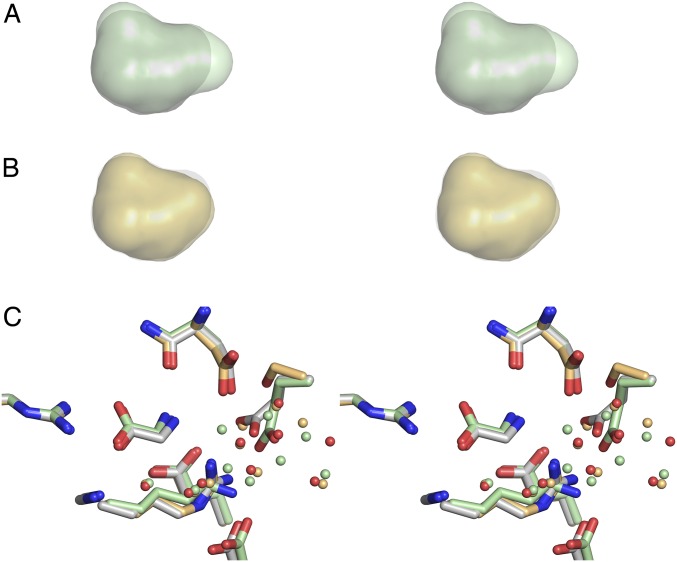
Calculation of solvent accessible cavity volumes, with a probe radius of 1.4 Å, gave similar values for WT ML032222a and for the R703K and E423S mutants (58.8 ± 0.01, 56.6 ± 0.1, and 59.0 ± 0.03 Å3, respectively; mean ± SEM; n = 3); however, close inspection of the cavity volumes revealed subtle changes in shape due to movements resulting from introduction of the mutant side chains (Fig. S1). As a result, in lobe 2, the binding site surfaces for the mutant structures are distinct from those for WT ML032222a (Fig. 3A). In the R703K mutant, the side chain of Glu423 rotates 43° around Chi2 and 31° around Chi3 such that the Glu OE2 carboxyl group oxygen atom moves 1.8 Å away from the glycine ligand to form an ion pair contact with the R703K mutant side chain, breaking the carboxylate-carboxylate contact with Asp497 found in the WT structure (Fig. 3B). This movement creates a bulge occupied by a water molecule (W9), which is coordinated by the Glu423, Asp497, and Glu747 side chains (Fig. 3B). In the E423S mutant (Fig. 3C), a pair of water molecules equivalent to W7 and W8 in the WT structure moves down toward the glycine ligand such that W7 is positioned exactly at the location of the Glu423 OE1 carboxyl group oxygen atom in the WT protein and makes hydrogen bond contacts with the mutant Ser423, Asp497, and Arg703 side chains (Fig. 3C).
Fig. S1.
Comparison of LBD cavity sizes and water molecule networks in the WT, R703K, and E423S mutants. (A) Stereoview of a superposition of the LBD cavity for WT (gray) and R703K (pale green). (B) Stereoview of a superposition of the LBD cavity for WT (gray) and E423S (pale orange). (C) Stereoview of superpositions using domain 1 main chain coordinates for residues forming the glycine binding site, with carbon atoms and water molecules colored pale green for R703K and pale orange for E423S, respectively; for WT, carbon atoms are gray with water molecules colored red.
Conformational Dynamics of the LBD.
To gain further insight into the structural thermodynamics of the ML032222a LBD, we computed the conformational free energy landscapes, or potentials of mean force (PMFs), of the WT S1S2 LBD and the R703K and E423S mutants for both apo- and glycine-bound forms. The PMFs were computed using umbrella sampling molecular dynamics (MD) simulations in which a 2D order parameter (ξ1, ξ2) was used to characterize large-scale conformational changes in the LBD, where ξ1 and ξ2 are center of mass distances between atom selections in lobes 1 and 2 (Fig. 4A). Umbrella sampling using an analogous order parameter was used previously to characterize conformational transitions in AMPA and NMDA receptor LBDs, and the results were found to be consistent with small-angle X-ray scattering (SAXS), ligand-binding affinity, and single-molecule FRET (smFRET) studies (17–21). Because in the crystal structures the side chains of Glu423 and Asp497 are in close proximity, pKa calculations were carried out using PROPKA (22) to determine which protonation states of these two residues to use in our simulations. On the basis of these calculations, Glu423 was not protonated in the WT and R703K simulations, whereas Asp497 was protonated. For the E423S LBD, the pKa calculations suggested that Asp497 should not be protonated in the glycine complex but should be protonated in the apo state. These protonation states were therefore used in the E423S simulations.
Fig. 4.
Conformational free energy landscapes. (A) The order parameter (ξ1, ξ2) used to describe large-scale conformational transitions in the ML032222a LBD. ξ1 and ξ2 each represent the distance (dashed line) between the upper and lower lobes of the protein at the centers of mass of the highlighted atoms. Disulfide bonds are shown in red. (B) Free energy landscapes for the WT apo state (Top) and glycine complex (Bottom) plotted as 2D PMFs (Left) and 1D PMFs (Right). Contour lines correspond to a difference of 1 kcal/mol, with cooler colors being lower in free energy (see the color bar). Fig. S3 shows the SDs for the 2D PMFs, as determined by block averaging. For the 1D PMFs, the red-shaded region indicates the SD of the free energy. The locations of crystal structures are indicated by yellow dots. (C) Free energy landscapes for the R703K LBD. (D) Free energy landscapes for the E423S LBD.
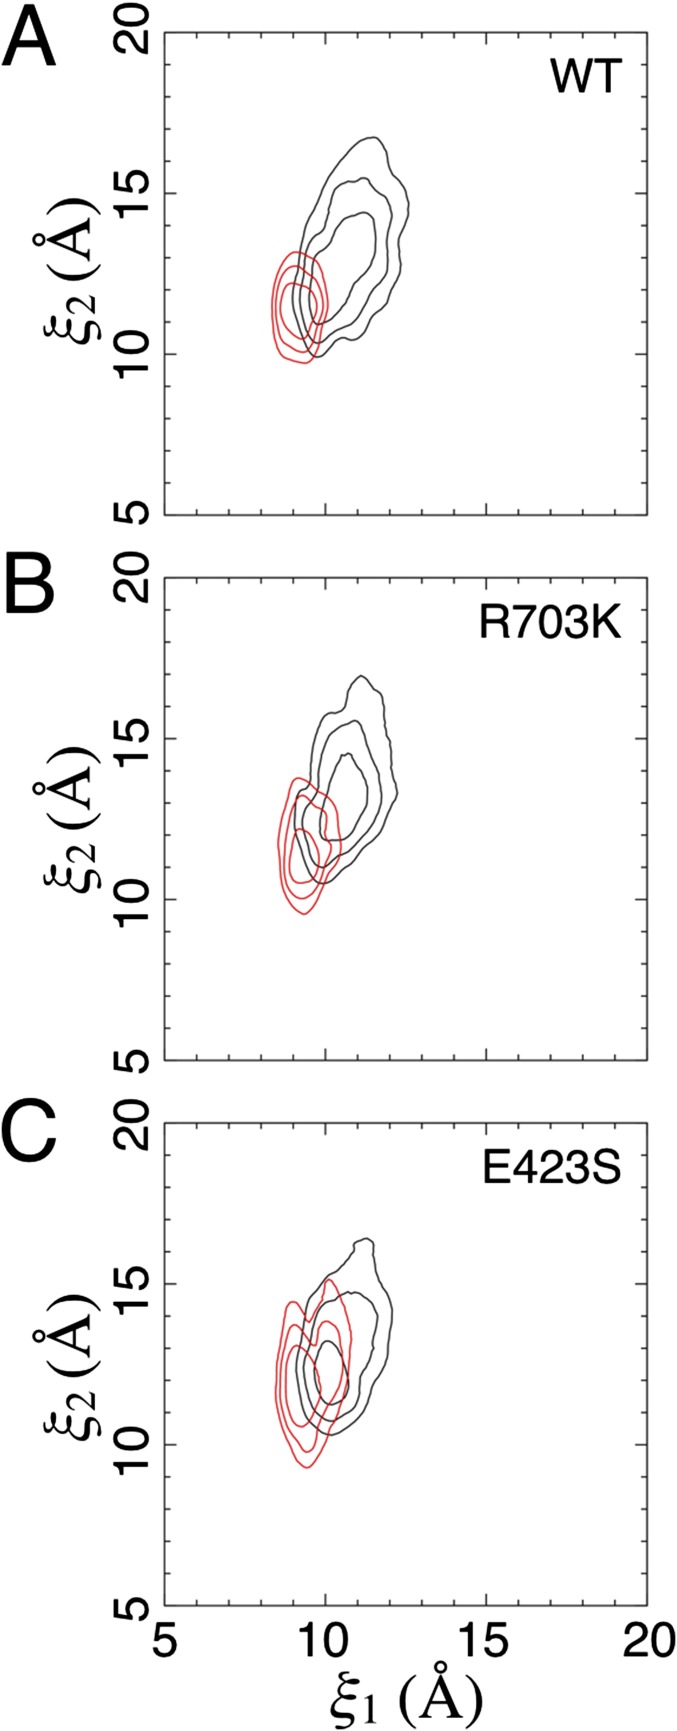
The WT apo LBD PMF features a broad free energy basin, indicating conformational flexibility in the absence of ligands (Fig. 4B). The global free energy minimum is located at (ξ1, ξ2) = (10.7, 13.3 Å). As expected, the WT glycine-bound LBD PMF features an energy basin that is narrower, indicating stabilized closed cleft conformations. The global free energy minimum is located at (ξ1, ξ2) = (9.0, 11.3 Å). In the glycine complex crystal structure, the LBDs in the dimer assembly have nearly identical conformations, which are located nearby at (ξ1, ξ2) = (8.7, 10.7 Å) and (8.7, 10.8 Å) for chains A and B, respectively. Although there is some overlap in the free energy basins between the apo- and glycine-bound LBD PMFs, these LBDs populate distinct conformational ensembles (Fig. S2). Within 1 kcal/mol of the minimum, the WT, apo LBD is able to access more open conformations, ranging from (ξ1, ξ2) = (9.8, 11 Å) to (ξ1, ξ2) = (11.2, 14.2 Å), whereas the WT, glycine-bound LBD occupies more closed conformations, from (ξ1, ξ2) = (8.6, 10.3 Å) to (ξ1, ξ2) = (9.6, 11.1 Å). Interestingly, the apo ML032222a LBD exhibits a single conformational free energy minimum, which is observed in glutamate-binding LBDs from the iGluRs GluA2 and GluN2A rather than multiple conformational free energy minima, as seen in glycine-binding LBDs from the iGluRs GluN1 and GluN3A (19).
Fig. S2.
Comparison of free energy basins for the apo and glycine complex LBDs. (A) The lowest three contour lines from the 2D PMFs in Fig. 4 are shown for the WT LBD. Apo is shown in black, and the glycine complex is shown in red. (B) Contours for the R703K LBD. (C) Contours for the E423S LBD.
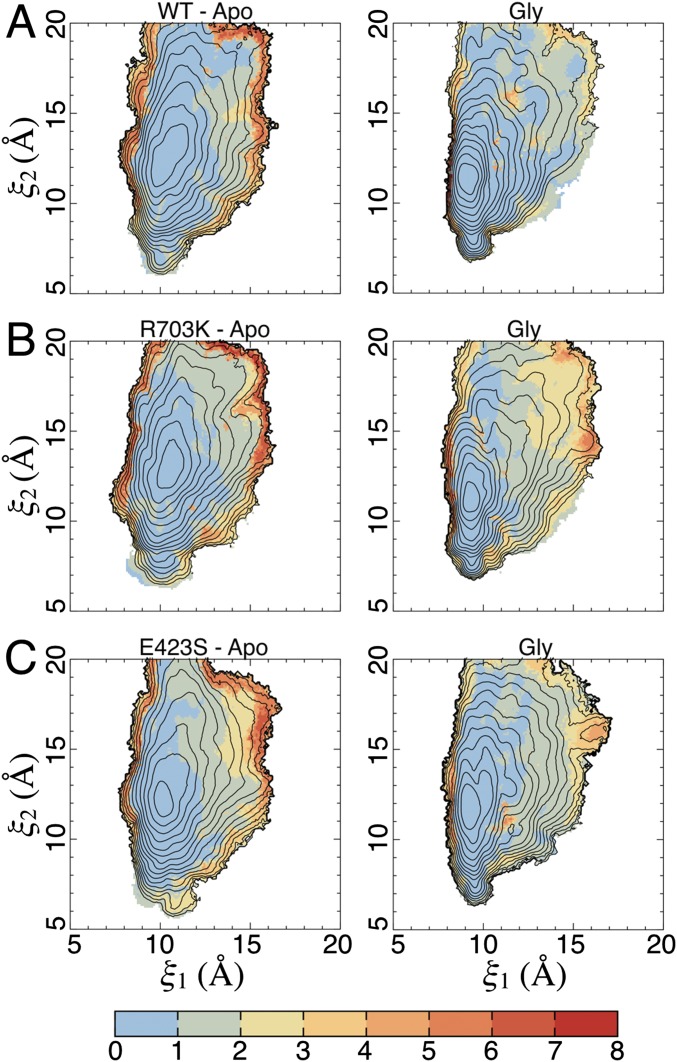
For both the R703K and E423S mutants, the apo LBD PMFs exhibit slightly narrowed free energy basins compared with the WT protein (Fig. 4 C and D), although all three PMFs are fairly similar. The glycine-bound LBD PMFs, however, exhibit shallower free energy funnels, indicating that open LBD conformations are easier to access. For apo R703K, the global free energy minimum is located at (ξ1, ξ2) = (10.5, 12.7 Å), and for apo E423S, it is located at (ξ1, ξ2) = (10.1, 12.0 Å). For glycine-bound R703K, the global free energy minimum is located at (ξ1, ξ2) = (9.4, 11.3 Å), and for glycine-bound E423S, it is located at (ξ1, ξ2) = (9.3, 12.2 Å). Perhaps due to crystal lattice packing effects, the structures of the R703K and E423S mutant glycine complexes adopt slightly more closed conformations, (ξ1, ξ2) = (8.8, 10.4 Å) and (8.7, 10.6 Å), and (ξ1, ξ2) = (8.7, 10.6 Å) and (8.7, 10.7 Å), for chains A and B, respectively. Fig. S3 shows the SDs for the 2D PMFs, as determined by block averaging.
Fig. S3.
The SD of the 2D PMFs (Fig. 4). (A) SD in Fig. 4B. (Left) The apo state. (Right) The glycine complex. SDs are shown in kcal/mol (see the color bar), as determined by block averaging. The contour lines are taken from the 2D PMFs (Fig. 4). (B) SD in Fig. 4C. (C) SD in Fig. 4D.
Stability of the Interdomain Salt Bridge.
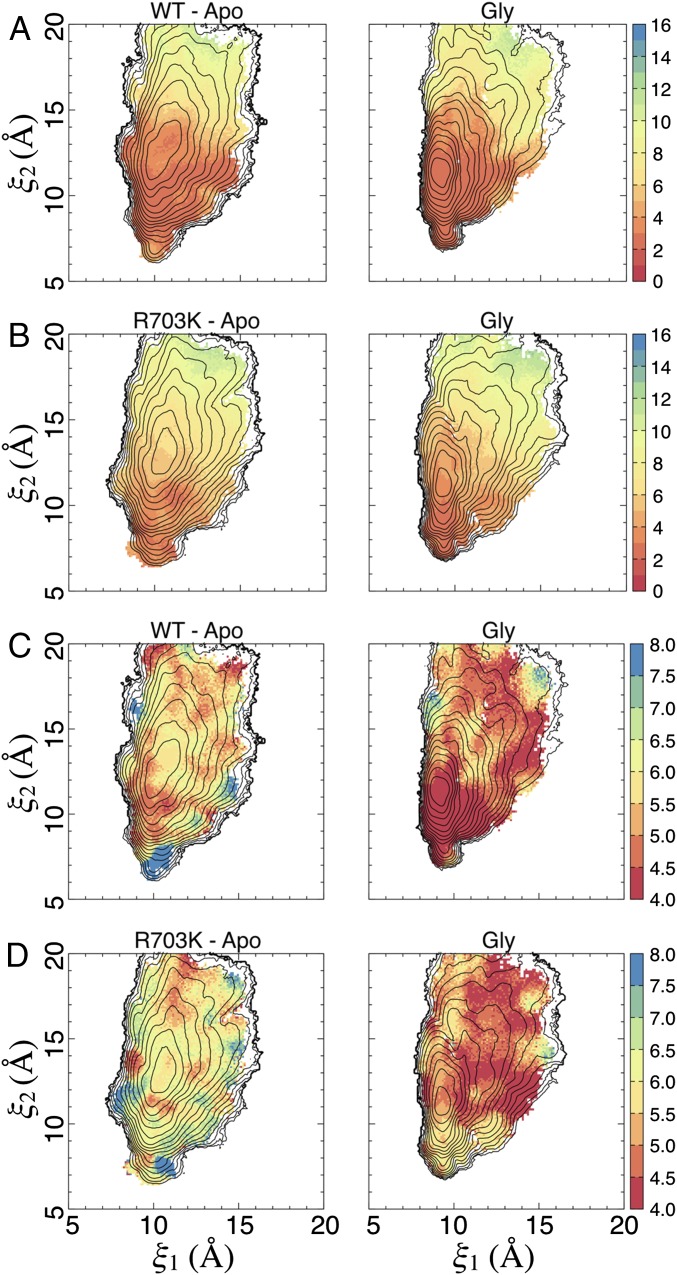
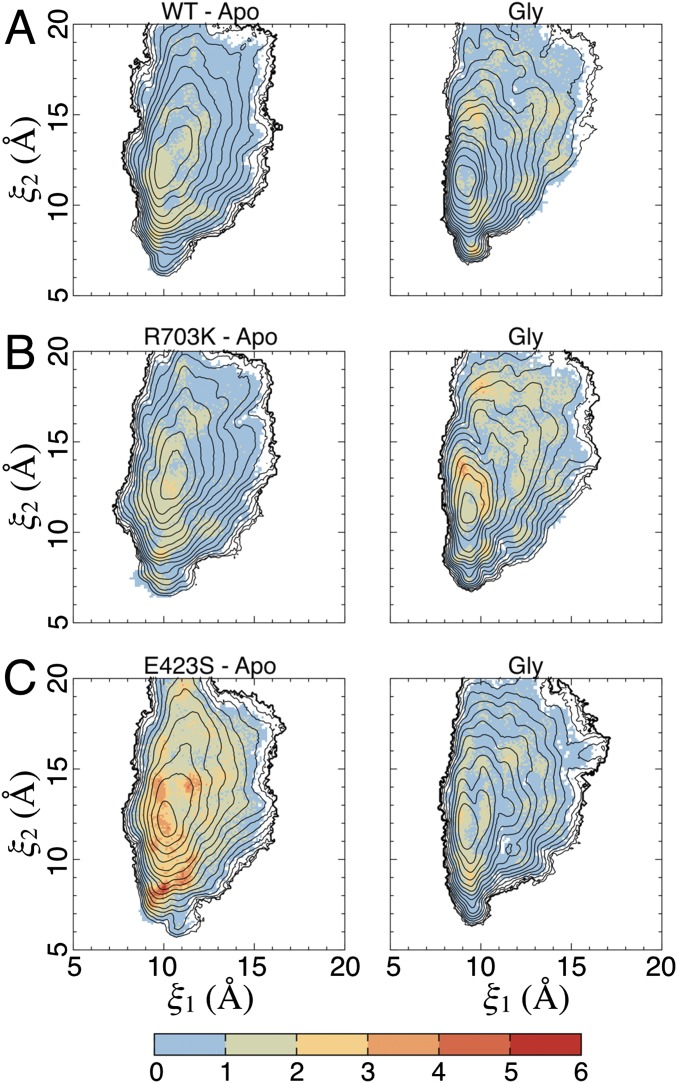
How stable is the salt bridge formed by Glu423 with the Arg or Lys residue at position 703? To examine the structural stability of this salt bridge in the WT and R703K mutant LBDs as a function of LBD conformation in our simulations, we plotted side chain distances between residues 703 and 423 vs. (ξ1, ξ2) (Fig. 5 A and B and Fig. S4 A and B). The statistics for the WT glycine complex and apo systems were calculated using ∼180,000 observations (snapshots extracted from the simulations) for each state. The statistics for each of the R703K systems were calculated using ∼190,000 observations. Average distances (and their SDs) were calculated between the closest nitrogen and oxygen atoms in the side chains of either Arg703 or Lys703 and Glu423, respectively. The distribution of average distances is not dramatically different between the apo LBD and the glycine complex for either the WT or R703K LBD. Residues 703 and 423, however, tend to stay in closer proximity for the WT LBD than for the R703K variant, reflecting, unsurprisingly, a stronger interaction for an arginine-glutamate pair than for a lysine-glutamate pair. The SDs of the average distances, however, are greater in the WT LBD, especially for the glycine complex, than for the R703K LBD. These results indicate that the Arg703-Glu423 bridge is able to remain intact over a larger range of LBD conformations than the Lys703-Glu423 bridge. The regions of large fluctuations in the Arg703-Glu423 distance, i.e., the SDs, indicate LBD conformations for which this salt bridge is strained.
Fig. 5.
Salt bridge conformational dynamics. (A) Interactions between Arg703 and Glu423 for the WT LBD as a function of cleft closure. (Left) The apo state. (Right) The glycine complex. Average distances are shown in Ångstroms (see the color bar); SDs are shown in Fig. S4 A and B. The contour lines are taken from the 2D PMFs (Fig. 4). (B) Interactions between Lys703 and Glu423 for the R703K mutant LBD. (C) Distance between the Glu423 Cδ atom and the Asp497 Cγ atom for the WT LBD as a function of cleft closure. (Left) The apo state. (Right) The glycine complex. Average distances are shown in Ångstroms; SDs are shown in Fig. S4 C and D. The contour lines are taken from the 2D PMFs (Fig. 4). (D) Distance between Glu423 and Asp497 for the R703K mutant LBD.
Fig. S4.
The SD of distance measurements involving the salt bridge residues (Fig. 5). (A) SD in Fig. 5A. (Left) The apo state. (Right) The glycine complex. SDs are shown in Ångstroms (see the color bars). The contour lines are taken from the 2D PMFs (Fig. 4). (B) SD in Fig. 5B. (C) SD in Fig. 5C. (D) SD in Fig. 5D.
The rotation of the Glu423 side chain away from Asp497 observed in the crystal structure of the R703K glycine complex LBD is also seen in the simulations of both WT and R703K proteins. Interestingly, this rotation occurs much more in the apo LBDs than in the glycine complexes (Fig. 5 C and D and Fig. S4 C and D). Although the bound glycine ligand does not directly contact Glu423, the ligand may stabilize the binding pocket residues in such a way that disfavors rotation of Glu423 out of the pocket. It is also possible that the orientation of Glu423 could impact stability of the Arg/Lys703-Glu423 salt bridge. If so, this would imply that the salt bridge “locks” apo and glycine-bound LBDs to different extents. The similarity in the PMFs for the apo WT, R703K, and E423S LBDs suggests the salt bridge conformationally restricts the glycine-bound LBD more than the apo state.
Occupancy of Binding Pocket Waters W9 and W7.
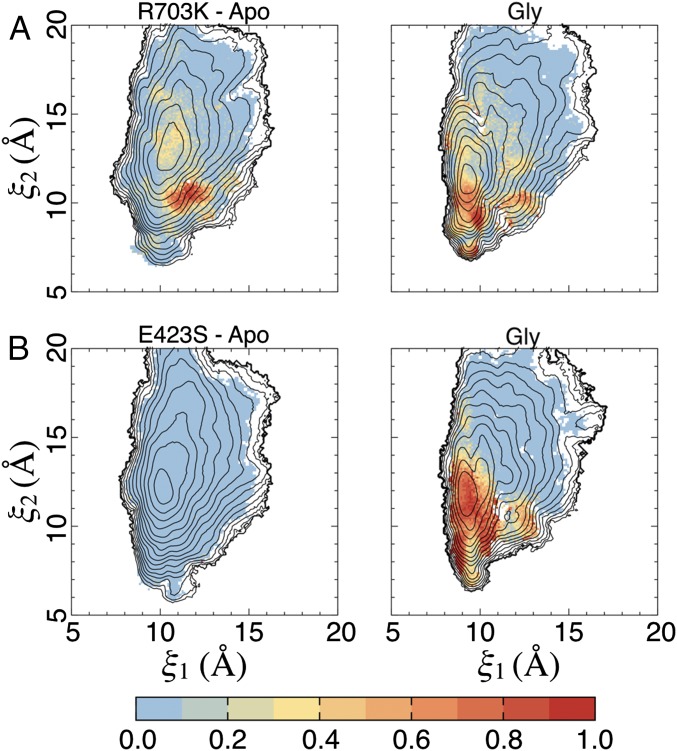
Specific water molecules in the binding pocket of the crystal structures for the R703K and E423S LBDs, i.e., waters W9 and W7, respectively, have been described above. How stable is the positioning of these waters, and what role might they play in stabilizing these structures? To examine water stability as a function of LBD conformation in our simulations, we plotted average occupancies of the water coordination sites vs. (ξ1, ξ2) (Fig. 6). For the R703K LBD, W9 is coordinated by the side chains of Glu423, Asp497, and Glu747. For the E423S LBD, W7 is coordinated by the side chains of Ser423, Asp497, and Arg703. In our simulation trajectories, a coordination site is considered occupied if a water's oxygen atom is within 3.2 Å of a nitrogen or oxygen atom belonging to each of the three coordinating side chains. For the R703K LBD, W9 is coordinated with high probability in certain closed-cleft conformations, especially (ξ1, ξ2) ∼ (11.5, 10.5 Å) for the apo state and (ξ1, ξ2) ∼ (10.0, 9.0 Å) for the glycine complex. For the E423S LBD, W7 is coordinated with high probability in a subset of closed-cleft conformations for the glycine complex, but it is coordinated with very low probability in the apo state in any conformation. The water occupancies for the glycine complex simulations are consistent with the observation of bound waters W7 and W9 observed in the crystal structures (see the locations of the crystal structures in Fig. 4 C and D). The computed water occupancies also reveal other LBD conformations that give rise to side chain arrangements favorable to the coordination of W9 and W7, suggesting an important role in the ligand-binding mechanism. The statistics for each of the R703K systems and the apo E423S system were calculated using ∼190,000 observations (snapshots extracted from the simulations); the statistics for the glycine-bound E423S system were calculated using ∼132,000 observations.
Fig. 6.
Occupancy of binding pocket water molecules as a function of cleft closure. (A) For the R703K mutant LBD, the binding pocket water corresponds to W9 in Fig. 3B and is coordinated by Glu423, Asp497, and Glu747. (Left) The apo state. (Right) The glycine complex. Cooler colors indicate lower occupancy. The contour lines are taken from the 2D PMFs (Fig. 4). (B) For the E423S mutant LBD, the water corresponds to W7 in Fig. 3C and is coordinated by Ser423, Asp497, and Arg703.
The Conformational Free Energy Associated with Ligand Binding.
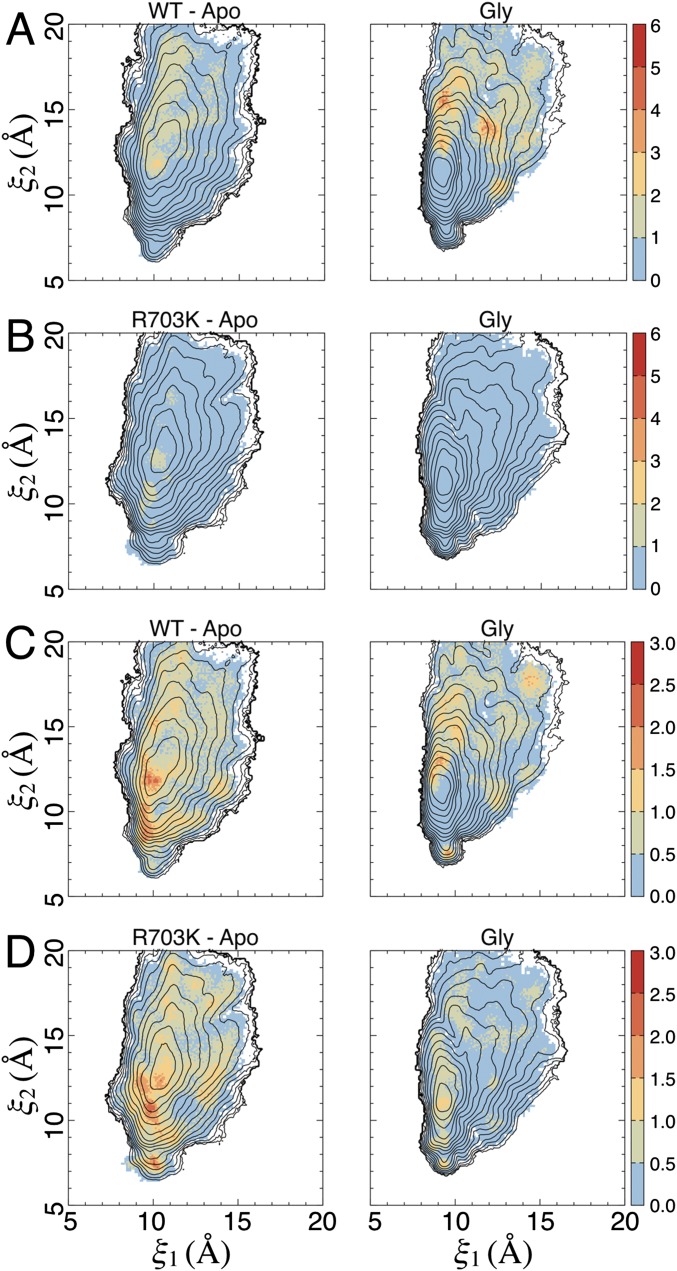
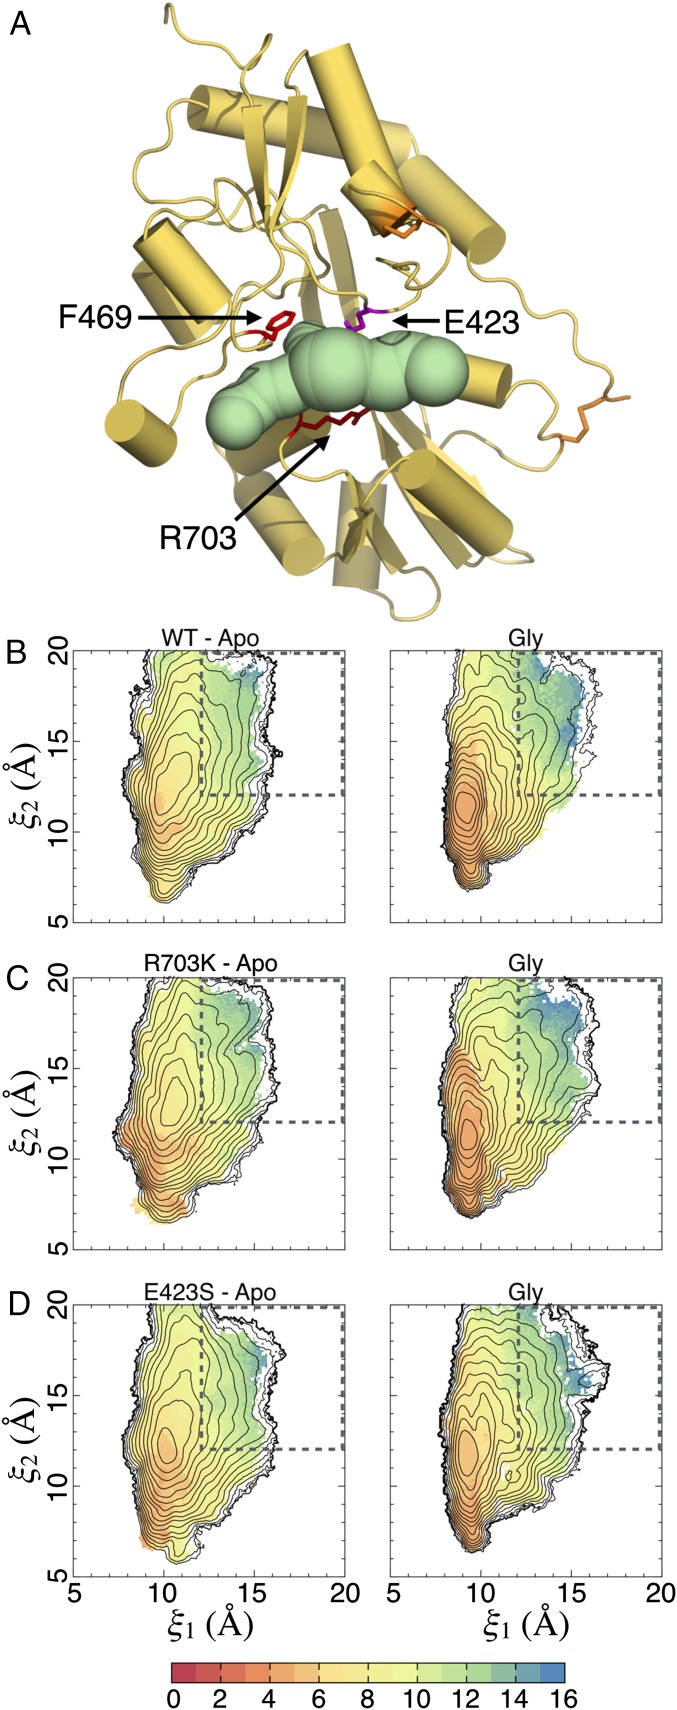
The total free energy of ligand binding into an LBD can be broadly decomposed into free energy contributions resulting from ligand docking into the binding pocket and contributions resulting from large-scale LBD conformational changes, i.e., domain closure (18). To compute the LBD conformational free energy associated with glycine binding, the extent to which the LBD has to open to allow glycine entry (and exit) must first be determined. Access tunnels into the binding pocket were analyzed using CAVER Analyst (23) for a selection of LBD conformations extracted from our simulations (Fig. 7A). The residues forming the bottleneck for the passage of a glycine molecule, which was estimated to have a minimum van der Waals radius of 2.62 Å, are Phe469 in lobe 1 and Arg/Lys703 in lobe 2, with Glu/Ser423 (in lobe 1) also lining the passageway. The minimum distance between the side chains of residues 469 and 703 that allows glycine passage is ∼10 Å, as measured between Cγ atoms. To examine glycine accessibility as a function of LBD conformation, we plotted average distances (and their SDs) between residues 469 and 703 vs. (ξ1, ξ2) (Fig. 7 B–D and Fig. S5 A–C). Statistics for the WT glycine complex and apo systems were calculated using ∼180,000 observations (snapshots extracted from the simulations) for each state, ∼190,000 observations for the R703K systems, and 132,000 and ∼190,000 observations for the E423S glycine complex and apo systems, respectively.
Fig. 7.
Glycine accessibility as a function of cleft closure. (A) Tunnels that allow a glycine ligand to access its binding pocket from bulk solvent, found using CAVER Analyst, are shown in green. The primary access tunnel to the pocket is in the center; the lateral tunnels are crevices that feed into the central tunnel. Bottleneck residues for the central tunnel are Phe469 and Arg703, shown in red. Glu423 also lines the central tunnel and is shown in magenta. A minimum distance of ∼10 Å between the side chains of residues 469 and 703, measured at Cγ atoms, is required for glycine passage. Disulfide bonds are shown in orange. The example LBD conformation shown corresponds to (ξ1, ξ2) ∼ (13, 16 Å). In this conformation, the Arg703-Glu423 salt bridge is broken. (B) Distance between the side chains of Phe469 and Arg703, measured as described in A, for the WT BD. (Left) The apo state. (Right) The glycine complex. Average distances are shown in units of Ångstroms (see the color bar); SDs are shown in Fig. S5. The dashed box indicates the region of integration for open LBD conformations. The contour lines are taken from the 2D PMFs (Fig. 4). (C) Distance between the side chains of Phe469 and Lys703 for the R703K mutant LBD. (D) Distance between the side chains of Phe469 and Arg703 for the E423S mutant LBD.
Fig. S5.
The SD of distance measurements between Phe469 and Arg/Lys703 (Fig. 7). (A) SD in Fig. 7B. (Left) The apo state. (Right) The glycine complex. SDs are shown in Ångstroms (see the color bar). The contour lines are taken from the 2D PMFs (Fig. 4). (B) SD in Fig. 7C. (C) SD in Fig. 7D.
The relative probability for the LBD to adopt open conformations (allows glycine access) vs. closed conformations (disallows glycine access) can be computed as follows:
where Ω is the partition function for the LBD's conformational state, Open indicates the region of integration in the PMF, written as , that corresponds to values of (ξ1, ξ2) in which the average distance between residues 469 and 703 ≥10 Å; Closed indicates all other regions in the PMF; is Boltzmann's constant, and T is temperature. The equation above can be related to the free energy difference between the open and closed state ensembles as follows:
Finally, the difference in ∆Gconf between glycine-bound and apo LBDs is given by
∆∆Gconf represents the difference in conformational free energy between the glycine-bound and apo LBDs for adopting open vs. closed states. In other words, ∆∆Gconf is the conformational free energy gained by the system on glycine binding for accessing open states. It is important to note that ∆∆Gconf does not correspond to the total binding free energy because free energy contributions associated with, for example, translation of the ligand from bulk solvent into the binding site have not been taken into account in this calculation. ∆∆Gconf alone, therefore, cannot be directly compared with experimentally measured binding free energies. If the differences in glycine binding affinity among the WT, R703K, and E423S proteins are dominated by changes in LBD conformational free energies, however, then the trend in calculated ∆∆Gconf values should follow the measured affinities. ∆Gconf were computed for each PMF, using an integration region of {ξ1 ≥ 12 Å and ξ2 ≥ 12 Å} for open conformations. The results are provided in Table 2. The trend ∆∆Gconf,WT > ∆∆Gconf,R703K > ∆∆Gconf,E423S is consistent with the measured affinities, although ∆∆Gconf,WT – ∆∆Gconf,R703K is larger than expected from the measured affinities and ∆∆Gconf,R703K – ∆∆Gconf,E423S is smaller. These discrepancies might be due to possible electrostatic interactions between the glycine ligand and residues 703 and/or 423, which were not examined in this study. Varying the region of integration by ±1 Å in either ξ1 or ξ2 does not change the trend or the ∆∆G values significantly. ∆Gconf,Apo is ∼3 kcal/mol for all three proteins, so ∆Gconf,Gly therefore appears to be driving the changes in glycine affinity for the LBD variants; the presence of glycine in the binding pocket makes it more difficult for the WT LBD to adopt open conformations compared with the mutants.
Table 2.
Free energy of conformational change in the LBD
| WT (kcal/mol) | R703K (kcal/mol) | E423S (kcal/mol) | |
| 9.474 | 5.966 | 4.977 | |
| −2.543 | −2.862 | −2.848 | |
| 6.931 | 3.104 | 2.129 |
Discussion
Multiple glycine-activated iGluR subunits have recently been discovered by genome sequencing of ctenophore species (24), including the comb jelly M. leidyi (14, 25). A special feature of these subunits is an interdomain salt bridge that has not been found in iGluR subunits encoded in the genomes of a wide range of other organisms, including mammals. Using a combination of crystallographic, biochemical, functional, and computational approaches, we probed the effects of mutations in the salt bridge to try to understand its role in ctenophore iGluRs. The mutants R703K and E423S, which progressively weaken the interaction between residues 423 and 703, which form the salt bridge in the WT protein, result in increased rates of recovery from desensitization. This observation is consistent with our biochemical measurements that demonstrate that the mutations decrease LBD affinity for glycine, thus establishing that the lifetime of the desensitized state is determined in part by stability of the agonist receptor complex. Crystal structures of the mutant LBDs show that rearrangements in the binding cleft are mostly limited to residues 703 and 423 and a surrounding network of water molecules. Computational studies of the interdomain salt bridge indicate that, in the WT LBD, the Arg703-Glu423 bridge is stable over a wider range of LBD conformations than the Lys703-Glu423 counterpart present in the R703K mutant. The crystallographic waters W9 and W7, which form part of a hydrogen bonding network in the binding pockets of the R703K and E423S glycine-complex LBDs, respectively, are also found to be stably coordinated in the simulations.
Prior studies on GluA2, GluK2, and the NMDA receptor GluN1 and GluN2 subunits revealed only modest tuning of ligand apparent affinity by direct lobe 1–lobe 2 interactions (15, 16, 26–29). The 1,000-fold stabilization of glycine binding by the ML032222a salt bridge demonstrates that much stronger modulation is possible for the LBD clamshell assembly. Functionally, a very high affinity for glycine has severe consequences: ML032222a desensitizes rapidly and takes many minutes to recover before it can respond to glycine again. On the other hand, the glycine-binding subunits of vertebrate NMDA receptors do not function as conventional ligand-gated ion channel subunits, which sense the pulsatile release of neurotransmitter at synapses, but instead are likely to be continually bound by glycine or d-serine (30, 31). Our functional and biochemical analyses of perturbations to the salt bridge show how interdomain contacts can tune receptor kinetics and thermodynamics over a very broad range.
Based on the electrophysiological and biochemical data reported in this paper, as well as prior studies of ML032222a and an iGluR LBD from another ctenophore, the sea gooseberry P. bachei (14), we had expected the salt bridge to simply stabilize a closed conformation for an open/closed transition. It was unclear, however, whether this would be enough to confer the extraordinarily high stability observed for the glycine complex. The results of our simulations reveal a surprisingly more complex situation than we had previously envisioned. The conformational free energy analysis reveals that the energy required to open the apo LBD sufficiently to allow glycine binding is similar among the WT and mutant proteins. Opening the glycine-bound LBD enough to allow glycine to exit, however, is energetically more expensive for the WT protein than for the mutants. Because the salt bridge, in particular Arg703, is positioned at what appears to be the likely point of entry into the binding pocket, it serves as a barrier to incoming ligands. The salt bridge also blocks ligand egress from the pocket if the binding pathways are assumed to be reversible. The effects of the interdomain salt bridge may therefore be twofold: it restricts conformational flexibility of the glycine-bound LBD while impeding the passage of glycine in and out of the pocket. It is also possible that the strength of the salt bridge might be tuned by the rotameric state of Glu423. The rotameric state appears roughly bimodal with respect to whether the LBD is apo or glycine bound. Combined with the effects mentioned above, a stronger salt bridge for the liganded complex would contribute to the LBD's high affinity for glycine. At a cleft opening of (ξ1, ξ2) = (13, 16 Å), which is sufficient to allow entry of a glycine ligand, the side chains of Arg703 and Glu423 are separated by ∼8 Å. Is it possible that the glycine might transiently interact with the guanidine of Arg703 and/or the carboxylate of Glu423 during ligand entry or exit? Thus far, we have been unsuccessful in simulating glycine binding and unbinding, using approaches free of biasing potentials, to directly address this question, but we speculate that the LBDs for other iGluR subtypes may be similarly complex in terms of strategically positioned barriers.
The emerging structural biology of iGluR LBD conformational ensembles reveals that, although agonist binding results in the free energy landscapes adopting a single-minimum topology, apo LBDs can exhibit either single minima (as seen for ML032222a, GluA2, and GluN2A) or multiple minima (as seen for GluN1 and GluN3A) (17–19). Glutamine-binding protein (GlnBP) is an example of a periplasmic binding protein (PBP) that exhibits a single stable conformational state for the apo protein (32), whereas maltose-binding protein (MBP) is an example of a PBP that exhibits metastable states for both open and closed conformations for the apo protein (33, 34). It should be noted that the iGluR LBD observations are based on studies of isolated LBDs. In future work, we plan to calculate LBD PMFs in the context of intact receptor tetramers containing the amino-terminal and transmembrane domains. Although computationally expensive to perform, we anticipate that results of these experiments will likely add to the complexity reported here.
Materials and Methods
Expression in Xenopus Oocytes and Functional Analysis.
Full-length cDNAs for ML032222a, with R703K and E423S mutations created by overlap PCR, were sequenced and cloned into pGEMHE (35), linearized with PmeI, and used for cRNA expression using T7 polymerase (Ambion mMessage mMachine transcription kit). Defolliculated stage 5–6 Xenopus oocytes obtained from Ecocyte Bioscience were injected with between 0.1 and 1 ng cRNA and incubated at 18 °C in ND96 (96 mM NaCl, 2 mM KCl, 1.8 mM CaCl2, 1 mM MgCl2, 5 mM Hepes, 2.5 mM sodium pyruvate, gentamycin at 50 μg/mL, pH 7.6). Two electrode voltage-clamp recordings at a holding potential of −60 mV, with 3 M KCl agarose tipped electrodes of resistance 0.1–0.8 MΩ, were performed 3–5 d after injection of cRNAs. The bath solution contained 100 mM NaCl, 1 mM KCl, and 5 mM Hepes, pH 7.5, to which CaCl2 and MgCl2 were added as required. Amino acids were dissolved in recording solution and applied by computer-operated solenoid valves essentially as reported previously (36).
Protein Expression and X-Ray Crystallography.
Synthetic genes with codon optimization for expression in Escherichia coli for the ML032222a LBD S1S2 construct with point mutations were created by overlap PCR, expressed as soluble proteins, purified to homogeneity using metal affinity and ion exchange chromatography, and crystallized as described previously (12, 14). X-ray diffraction data collected at Southeast Regional Collaborative Access Team (SER-CAT) Advanced Photon Source (APS) was used to solve structures for the glycine bound complexes of the R703K and E423S mutant LBDs by Fourier synthesis, using the WT structure with mutant side chains truncated to CB atoms, and with alternate conformations, ligand atoms, and solvent removed from the starting model. Iterative cycles of model building and crystallographic refinement were carried out using COOT (37) and PHENIX (38) until the Rfree value converged and Fo-Fc maps contained no interpretable features.
Proteolysis Protection and Binding Assays.
Purified ML032222a S1S2 and the ML032222a R703K S1S2 mutant were denatured in 4 M guanidinium, dialyzed to remove endogenous glycine, and then refolded using buffers made with HPLC grade water; apo protein for the E423S mutant was successfully prepared by dialysis without unfolding. Digestions were performed with trypsin at a ratio of 1:20 (wt/wt) at room temperature and then run on polyacrylamide gels. ITC experiments with a VP-ITC calorimeter (MicroCal) were performed at 20 °C as described previously (14).
Free Energy Landscapes.
The protein conformational free energy landscapes (ξ1, ξ2), or PMFs, were computed using an umbrella sampling simulation strategy. A 2D order parameter, (ξ1, ξ2), is used to describe large-scale conformational transitions in the LBD. ξ1 and ξ2 each specify the distance between the center of mass (COM) of an atom selection in lobe 1 and the COM of an atom selection in lobe 2. ξ1 is the distance between the atoms N, CA, CB, C, and O of residues 498–500 (residues 92–94 of PDB ID codes 4YKI, 5CMB, and 5CMC) in lobe 1 and residues 704–705 (residues 145–146 of PDB ID codes 4YKI, 5CMB, and 5CMC) in lobe 2; ξ2 is the distance between the same atoms of residues 423–425 (residues 17–19 of PDB ID codes 4YKI, 5CMB, and 5CMC) in lobe 1 and residues 730–731 (residues 171–172 of PDB ID codes 4YKI, 5CMB, and 5CMC) in lobe 2.
The umbrella sampling windows consist of LBD conformations positioned in 1-Å increments along ξ1 and ξ2. These coordinates were obtained via targeted MD simulations using CHARMM (39) initiated from the following crystal structures: 4YKI (glycine-bound WT LBD), 5CMB (glycine-bound R703K LBD), and 5CMC (glycine-bound E423S LBD). Chain B was used; residue isomer A was used from the entries where multiple options exist. Missing residues were built using the MODLOOP server (40). During the targeted MD simulations, RMSD restraints were applied separately to each lobe to minimize intralobe structural distortions, and the glycine ligand was restrained to remain docked to Arg131 in lobe 1.
One hundred ten umbrella sampling windows were used to compute each of the PMFs. All simulations were performed using CHARMM and NAMD (41) with explicit solvent at 300 K. The all-atom potential-energy function PARAM27 for proteins (42, 43) and the TIP3P potential energy function for water (44) were used. The total simulation time for each of the apo WT, glycine-bound WT, apo R703K, glycine-bound R703K, and apo E423S PMFs is ∼400 ns. The total simulation time for the glycine-bound E423S PMF is ∼260 ns. A time step of 2 fs was used in the simulations. The number of atoms in each simulation system is ∼31,000. Crystallographic waters in each ligand-binding cleft were included in our models. Na+ and Cl– ions were added in the bulk solution to give 150 mM NaCl and an electrically neutral system. Periodic boundary conditions were used with an orthorhombic cell with approximate dimensions 88 × 64 × 56 Å. Harmonic biasing potentials with a force constant of 2 kcal/mol/Å2 centered on (ξ1, ξ2) were used. Each PMF, (ξ1, ξ2), was computed using the weighted histogram analysis method (WHAM) (45, 46) to unbias and recombine the sampled distribution functions in (ξ1, ξ2) from all windows. A timestep of 20 fs was used in the WHAM calculations. To safeguard against ligand dissociation in open LBD conformations, an asymmetric harmonic potential (force constant of 10 kcal/mol/Å2) was applied to the distance between the α-carboxylate oxygen atoms of the ligand and the guanidinium nitrogen atoms of Arg131. The asymmetric potential resulted in the restraint being active only when the distance exceeded 3.2 Å. This restraint is not expected to adversely affect conformational sampling because dissociation events were never observed in test simulations involving open LBD conformations.
Block Averaging.
The statistical uncertainty in each PMF was evaluated using the approach of block averaging (47). For each PMF, the time series in (ξ1, ξ2) was divided into 10 blocks, WHAM was used to calculate a PMF from the data in each block, and then the SD in the 10 PMFs was calculated. Using 5–15 blocks all gave qualitatively similar results.
Acknowledgments
We thank Carla Glasser for technical assistance and Drs. Joy Zhao and Peter Schuck for help with analysis of ITC experiments. Data were collected at SER-CAT 22-ID beamline at the APS, Argonne National Laboratory. Use of the APS was supported by the US Department of Energy, Office of Science, Office of Basic Energy Sciences, under Contract W-31-109-Eng-38. This study used the high-performance computational capabilities of the Biowulf Linux cluster at the NIH and resources provided by the Maryland Advanced Research Computing Center at Johns Hopkins University. This work was supported by the intramural research program of The Eunice Kennedy Shriver National Institute of Child Health and Human Development, NIH, Department of Health and Human Services (M.L.M.) and NIH Grant R01GM094495 (to A.Y.L.).
Footnotes
The authors declare no conflict of interest.
This article is a PNAS Direct Submission. B.R. is a Guest Editor invited by the Editorial Board.
Data deposition: The atomic coordinates and structure factors have been deposited in the Protein Data Bank, www.pdb.org (PDB ID codes 5CMB and 5CMC).
This article contains supporting information online at www.pnas.org/lookup/suppl/doi:10.1073/pnas.1607010113/-/DCSupplemental.
References
- 1.Traynelis SF, et al. Glutamate receptor ion channels: Structure, regulation, and function. Pharmacol Rev. 2010;62(3):405–496. doi: 10.1124/pr.109.002451. [DOI] [PMC free article] [PubMed] [Google Scholar]
- 2.Karakas E, Furukawa H. Crystal structure of a heterotetrameric NMDA receptor ion channel. Science. 2014;344(6187):992–997. doi: 10.1126/science.1251915. [DOI] [PMC free article] [PubMed] [Google Scholar]
- 3.Lee C-H, et al. NMDA receptor structures reveal subunit arrangement and pore architecture. Nature. 2014;511(7508):191–197. doi: 10.1038/nature13548. [DOI] [PMC free article] [PubMed] [Google Scholar]
- 4.Yao Y, Harrison CB, Freddolino PL, Schulten K, Mayer ML. Molecular mechanism of ligand recognition by NR3 subtype glutamate receptors. EMBO J. 2008;27(15):2158–2170. doi: 10.1038/emboj.2008.140. [DOI] [PMC free article] [PubMed] [Google Scholar]
- 5.Monyer H, et al. Heteromeric NMDA receptors: Molecular and functional distinction of subtypes. Science. 1992;256(5060):1217–1221. doi: 10.1126/science.256.5060.1217. [DOI] [PubMed] [Google Scholar]
- 6.Moriyoshi K, et al. Molecular cloning and characterization of the rat NMDA receptor. Nature. 1991;354(6348):31–37. doi: 10.1038/354031a0. [DOI] [PubMed] [Google Scholar]
- 7.Burnashev N, Szepetowski P. NMDA receptor subunit mutations in neurodevelopmental disorders. Curr Opin Pharmacol. 2015;20:73–82. doi: 10.1016/j.coph.2014.11.008. [DOI] [PubMed] [Google Scholar]
- 8.Kumar J, Mayer ML. Functional insights from glutamate receptor ion channel structures. Annu Rev Physiol. 2013;75:313–337. doi: 10.1146/annurev-physiol-030212-183711. [DOI] [PMC free article] [PubMed] [Google Scholar]
- 9.Furukawa H, Singh SK, Mancusso R, Gouaux E. Subunit arrangement and function in NMDA receptors. Nature. 2005;438(7065):185–192. doi: 10.1038/nature04089. [DOI] [PubMed] [Google Scholar]
- 10.Furukawa H, Gouaux E. Mechanisms of activation, inhibition and specificity: crystal structures of the NMDA receptor NR1 ligand-binding core. EMBO J. 2003;22(12):2873–2885. doi: 10.1093/emboj/cdg303. [DOI] [PMC free article] [PubMed] [Google Scholar]
- 11.Armstrong N, Gouaux E. Mechanisms for activation and antagonism of an AMPA-sensitive glutamate receptor: Crystal structures of the GluR2 ligand binding core. Neuron. 2000;28(1):165–181. doi: 10.1016/s0896-6273(00)00094-5. [DOI] [PubMed] [Google Scholar]
- 12.Mayer ML. Crystal structures of the GluR5 and GluR6 ligand binding cores: Molecular mechanisms underlying kainate receptor selectivity. Neuron. 2005;45(4):539–552. doi: 10.1016/j.neuron.2005.01.031. [DOI] [PubMed] [Google Scholar]
- 13.Mayer ML. Glutamate receptors at atomic resolution. Nature. 2006;440(7083):456–462. doi: 10.1038/nature04709. [DOI] [PubMed] [Google Scholar]
- 14.Alberstein R, Grey R, Zimmet A, Simmons DK, Mayer ML. Glycine activated ion channel subunits encoded by ctenophore glutamate receptor genes. Proc Natl Acad Sci USA. 2015;112(44):E6048–E6057. doi: 10.1073/pnas.1513771112. [DOI] [PMC free article] [PubMed] [Google Scholar]
- 15.Robert A, Armstrong N, Gouaux JE, Howe JR. AMPA receptor binding cleft mutations that alter affinity, efficacy, and recovery from desensitization. J Neurosci. 2005;25(15):3752–3762. doi: 10.1523/JNEUROSCI.0188-05.2005. [DOI] [PMC free article] [PubMed] [Google Scholar]
- 16.Weston MC, Gertler C, Mayer ML, Rosenmund C. Interdomain interactions in AMPA and kainate receptors regulate affinity for glutamate. J Neurosci. 2006;26(29):7650–7658. doi: 10.1523/JNEUROSCI.1519-06.2006. [DOI] [PMC free article] [PubMed] [Google Scholar]
- 17.Lau AY, Roux B. The free energy landscapes governing conformational changes in a glutamate receptor ligand-binding domain. Structure. 2007;15(10):1203–1214. doi: 10.1016/j.str.2007.07.015. [DOI] [PMC free article] [PubMed] [Google Scholar]
- 18.Lau AY, Roux B. The hidden energetics of ligand binding and activation in a glutamate receptor. Nat Struct Mol Biol. 2011;18(3):283–287. doi: 10.1038/nsmb.2010. [DOI] [PMC free article] [PubMed] [Google Scholar]
- 19.Yao Y, Belcher J, Berger AJ, Mayer ML, Lau AY. Conformational analysis of NMDA receptor GluN1, GluN2, and GluN3 ligand-binding domains reveals subtype-specific characteristics. Structure. 2013;21(10):1788–1799. doi: 10.1016/j.str.2013.07.011. [DOI] [PMC free article] [PubMed] [Google Scholar]
- 20.Landes CF, Rambhadran A, Taylor JN, Salatan F, Jayaraman V. Structural landscape of isolated agonist-binding domains from single AMPA receptors. Nat Chem Biol. 2011;7(3):168–173. doi: 10.1038/nchembio.523. [DOI] [PMC free article] [PubMed] [Google Scholar]
- 21.Dolino DM, et al. Structural dynamics of the glycine-binding domain of the N-methyl-D-aspartate receptor. J Biol Chem. 2015;290(2):797–804. doi: 10.1074/jbc.M114.605436. [DOI] [PMC free article] [PubMed] [Google Scholar]
- 22.Li H, Robertson AD, Jensen JH. Very fast empirical prediction and rationalization of protein pKa values. Proteins. 2005;61(4):704–721. doi: 10.1002/prot.20660. [DOI] [PubMed] [Google Scholar]
- 23.Kozlikova B, et al. CAVER Analyst 1.0: Graphic tool for interactive visualization and analysis of tunnels and channels in protein structures. Bioinformatics. 2014;30(18):2684–2685. doi: 10.1093/bioinformatics/btu364. [DOI] [PubMed] [Google Scholar]
- 24.Moroz LL, et al. The ctenophore genome and the evolutionary origins of neural systems. Nature. 2014;510(7503):109–114. doi: 10.1038/nature13400. [DOI] [PMC free article] [PubMed] [Google Scholar]
- 25.Ryan JF, et al. NISC Comparative Sequencing Program The genome of the ctenophore Mnemiopsis leidyi and its implications for cell type evolution. Science. 2013;342(6164):1242592. doi: 10.1126/science.1242592. [DOI] [PMC free article] [PubMed] [Google Scholar]
- 26.Kalbaugh TL, VanDongen HMA, VanDongen AMJ. Ligand-binding residues integrate affinity and efficacy in the NMDA receptor. Mol Pharmacol. 2004;66(2):209–219. doi: 10.1124/mol.66.2.209. [DOI] [PubMed] [Google Scholar]
- 27.Maier W, Schemm R, Grewer C, Laube B. Disruption of interdomain interactions in the glutamate binding pocket affects differentially agonist affinity and efficacy of N-methyl-D-aspartate receptor activation. J Biol Chem. 2007;282(3):1863–1872. doi: 10.1074/jbc.M608156200. [DOI] [PubMed] [Google Scholar]
- 28.Zhang W, Cho Y, Lolis E, Howe JR. Structural and single-channel results indicate that the rates of ligand binding domain closing and opening directly impact AMPA receptor gating. J Neurosci. 2008;28(4):932–943. doi: 10.1523/JNEUROSCI.3309-07.2008. [DOI] [PMC free article] [PubMed] [Google Scholar]
- 29.MacLean DM, Ramaswamy SS, Du M, Howe JR, Jayaraman V. Stargazin promotes closure of the AMPA receptor ligand-binding domain. J Gen Physiol. 2014;144(6):503–512. doi: 10.1085/jgp.201411287. [DOI] [PMC free article] [PubMed] [Google Scholar]
- 30.Le Meur K, Galante M, Angulo MC, Audinat E. Tonic activation of NMDA receptors by ambient glutamate of non-synaptic origin in the rat hippocampus. J Physiol. 2007;580(Pt. 2):373–383. doi: 10.1113/jphysiol.2006.123570. [DOI] [PMC free article] [PubMed] [Google Scholar]
- 31.Papouin T, et al. Synaptic and extrasynaptic NMDA receptors are gated by different endogenous coagonists. Cell. 2012;150(3):633–646. doi: 10.1016/j.cell.2012.06.029. [DOI] [PubMed] [Google Scholar]
- 32.Bermejo GA, Strub M-P, Ho C, Tjandra N. Ligand-free open-closed transitions of periplasmic binding proteins: The case of glutamine-binding protein. Biochemistry. 2010;49(9):1893–1902. doi: 10.1021/bi902045p. [DOI] [PMC free article] [PubMed] [Google Scholar]
- 33.Tang C, Schwieters CD, Clore GM. Open-to-closed transition in apo maltose-binding protein observed by paramagnetic NMR. Nature. 2007;449(7165):1078–1082. doi: 10.1038/nature06232. [DOI] [PubMed] [Google Scholar]
- 34.Bucher D, Grant BJ, Markwick PR, McCammon JA. Accessing a hidden conformation of the maltose binding protein using accelerated molecular dynamics. PLOS Comput Biol. 2011;7(4):e1002034. doi: 10.1371/journal.pcbi.1002034. [DOI] [PMC free article] [PubMed] [Google Scholar]
- 35.Liman ER, Tytgat J, Hess P. Subunit stoichiometry of a mammalian K+ channel determined by construction of multimeric cDNAs. Neuron. 1992;9(5):861–871. doi: 10.1016/0896-6273(92)90239-a. [DOI] [PubMed] [Google Scholar]
- 36.Panchenko VA, Glasser CR, Mayer ML. Structural similarities between glutamate receptor channels and K(+) channels examined by scanning mutagenesis. J Gen Physiol. 2001;117(4):345–360. doi: 10.1085/jgp.117.4.345. [DOI] [PMC free article] [PubMed] [Google Scholar]
- 37.Emsley P, Lohkamp B, Scott WG, Cowtan K. Features and development of Coot. Acta Crystallogr D Biol Crystallogr. 2010;66(Pt 4):486–501. doi: 10.1107/S0907444910007493. [DOI] [PMC free article] [PubMed] [Google Scholar]
- 38.Adams PD, et al. PHENIX: A comprehensive Python-based system for macromolecular structure solution. Acta Crystallogr D Biol Crystallogr. 2010;66(Pt 2):213–221. doi: 10.1107/S0907444909052925. [DOI] [PMC free article] [PubMed] [Google Scholar]
- 39.Brooks BR, et al. CHARMM: The biomolecular simulation program. J Comput Chem. 2009;30(10):1545–1614. doi: 10.1002/jcc.21287. [DOI] [PMC free article] [PubMed] [Google Scholar]
- 40.Fiser A, Sali A. ModLoop: Automated modeling of loops in protein structures. Bioinformatics. 2003;19(18):2500–2501. doi: 10.1093/bioinformatics/btg362. [DOI] [PubMed] [Google Scholar]
- 41.Phillips JC, et al. Scalable molecular dynamics with NAMD. J Comput Chem. 2005;26(16):1781–1802. doi: 10.1002/jcc.20289. [DOI] [PMC free article] [PubMed] [Google Scholar]
- 42.Mackerell AD, Jr, Feig M, Brooks CL., 3rd Extending the treatment of backbone energetics in protein force fields: Limitations of gas-phase quantum mechanics in reproducing protein conformational distributions in molecular dynamics simulations. J Comput Chem. 2004;25(11):1400–1415. doi: 10.1002/jcc.20065. [DOI] [PubMed] [Google Scholar]
- 43.MacKerell AD, et al. All-atom empirical potential for molecular modeling and dynamics studies of proteins. J Phys Chem B. 1998;102(18):3586–3616. doi: 10.1021/jp973084f. [DOI] [PubMed] [Google Scholar]
- 44.Jorgensen WL, Chandrasekhar J, Madura JD, Impey RW, Klein ML. Comparison of simple potential functions for simulating liquid water. J Chem Phys. 1983;79(2):926–935. [Google Scholar]
- 45.Kumar S, Rosenberg JM, Bouzida D, Swendsen RH, Kollman PA. The weighted histogram analysis method for free-energy calculations on biomolecules. I. The method. J Comput Chem. 1992;13(8):1011–1021. [Google Scholar]
- 46.Souaille M, Roux B. Extension to the weighted histogram analysis method: Combining umbrella sampling with free energy calculations. Comput Phys Commun. 2001;135(1):40–57. [Google Scholar]
- 47.Zhu F, Hummer G. Convergence and error estimation in free energy calculations using the weighted histogram analysis method. J Comput Chem. 2012;33(4):453–465. doi: 10.1002/jcc.21989. [DOI] [PMC free article] [PubMed] [Google Scholar]


