Significance
Although it is commonly accepted that p53-mediated cell-cycle arrest, apoptosis, and senescence all serve as major mechanisms of tumor suppression, accumulating evidence indicates that other activities of p53, such as ferroptosis, are also critical for tumor suppression. However, the molecular mechanisms by which p53-mediated ferroptosis operates are not completely understood. In this study, we discovered that p53 can execute ferroptotic cell-death responses by directly activating its target gene SAT1, coded for the spermidine/spermine N1-acetyltransferase 1. These data indicate a regulatory role of p53 in polyamine metabolism and reveal that p53-mediated activation of SAT1 contributes significantly to ferroptotic responses. Thus, p53 may engage multiple metabolic pathways with ferroptotic cell-death responses for tumor suppression.
Keywords: SAT1, p53, polyamine metabolism, ferroptosis, tumor suppression
Abstract
Although p53-mediated cell-cycle arrest, senescence, and apoptosis remain critical barriers to cancer development, the emerging role of p53 in cell metabolism, oxidative responses, and ferroptotic cell death has been a topic of great interest. Nevertheless, it is unclear how p53 orchestrates its activities in multiple metabolic pathways into tumor suppressive effects. Here, we identified the SAT1 (spermidine/spermine N1-acetyltransferase 1) gene as a transcription target of p53. SAT1 is a rate-limiting enzyme in polyamine catabolism critically involved in the conversion of spermidine and spermine back to putrescine. Surprisingly, we found that activation of SAT1 expression induces lipid peroxidation and sensitizes cells to undergo ferroptosis upon reactive oxygen species (ROS)-induced stress, which also leads to suppression of tumor growth in xenograft tumor models. Notably, SAT1 expression is down-regulated in human tumors, and CRISPR-cas9–mediated knockout of SAT1 expression partially abrogates p53-mediated ferroptosis. Moreover, SAT1 induction is correlated with the expression levels of arachidonate 15-lipoxygenase (ALOX15), and SAT1-induced ferroptosis is significantly abrogated in the presence of PD146176, a specific inhibitor of ALOX15. Thus, our findings uncover a metabolic target of p53 involved in ferroptotic cell death and provide insight into the regulation of polyamine metabolism and ferroptosis-mediated tumor suppression.
The p53 protein is a transcription factor that plays a central role in preventing malignant formation (1–4). Mutations of p53 are present in more than 50% of human cancers, and mice lacking p53 are prone to develop early-onset spontaneous tumors (3, 5). Classically, p53 is activated upon a variety of cellular stresses and functions as a master regulator to control the expression of downstream targets involved in cell growth arrest, apoptosis, and senescence (6, 7). However, characterization of mice deficient in p21, Puma (p53-upregulated modulator of apoptosis), and Noxa, which are key p53 targets in cell-cycle inhibitory and proapoptotic functions, demonstrated that their tumor-suppressing ability is still intact (8). Similar results were obtained in mice harboring the p533KR acetylation-deficient mutation K117/161/162R (p533KR) that fails to induce cell-cycle arrest, apoptosis, and senescence; these mice fully retain the ability to suppress spontaneous tumor formation (9). These studies suggested that the classical functions of p53 are dispensable for p53-mediated tumor suppression. Notably, accumulating evidence has revealed that p53 also regulates a plethora of various cellular functions, such as metabolic regulation, reactive oxygen species (ROS) stress response, and ferroptosis, and these emerging functions are now thought to play critical roles in p53-mediated tumor suppression (10, 11).
It is well known that cancer cells have altered metabolism (12). To support cell growth and proliferation, cancer cells preferentially forgo mitochondrial respiration and become reliant on aerobic glycolysis, which allows the generation of a greater amount of intermediates for de novo biosynthesis (13). In fact, a number of metabolic targets of p53, such as TIGAR (TP53-induced glycolysis and apoptosis regulator), PHGDH (3-phosphoglycerate dehydrogenase), GLUT1/4, and GLS2, have been shown to increase mitochondria respiration and inhibit glycolysis and biosynthesis (14–18). However, how p53-mediated metabolic regulations contribute to tumor suppression remains unclear. Ironically, TIGAR, a p53 metabolic target in regulation of glycolysis and antioxidant defense, has been shown to have tumor-protective functions (19). Cheung et al. (19) reported that TIGAR-knockout mice displayed decreased tumor burden compared with TIGAR wild-type mice in an intestinal adenoma mouse model. These findings further broadened the complexity of the contribution of metabolic regulation to p53-mediated tumor suppression.
Notably, the recent identification of a new p53 target in cystine metabolism has highlighted the importance of ferroptosis in p53-mediated tumor suppression (11). Ferroptosis is an iron-dependent nonapoptotic mode of cell death that can be triggered by the inhibition of cystine uptake, a decrease in glutathione synthesis, and subsequent accumulation of lipid ROS (20). Jiang et al. (11) reported that in response to inappropriate levels of ROS, p53 promotes ferroptosis through down-regulation of SLC7A11, a component of the cystine/glutamate antiporter (system xc−), and thereby provides another layer of defense against cellular injury and tumorigenesis. Nonetheless, it is possible that additional p53 targets also may contribute to this novel p53 response. Therefore, further investigation is required to demonstrate the role of other metabolic targets of p53 in regulating ferroptotic cell death. In this study, we used RNA sequencing to search for metabolic targets of p53 in a p53 wild-type melanoma cell line, A375, treated with Nutlin, a nongenotoxic drug that is commonly used to activate p53 by inhibiting its negative regulator murine double minute 2 (MDM2) (21). Our analysis identified spermidine/spermine N1-acetyltransferase 1 (SAT1), a gene in the polyamine metabolism pathway, that is highly induced by p53.
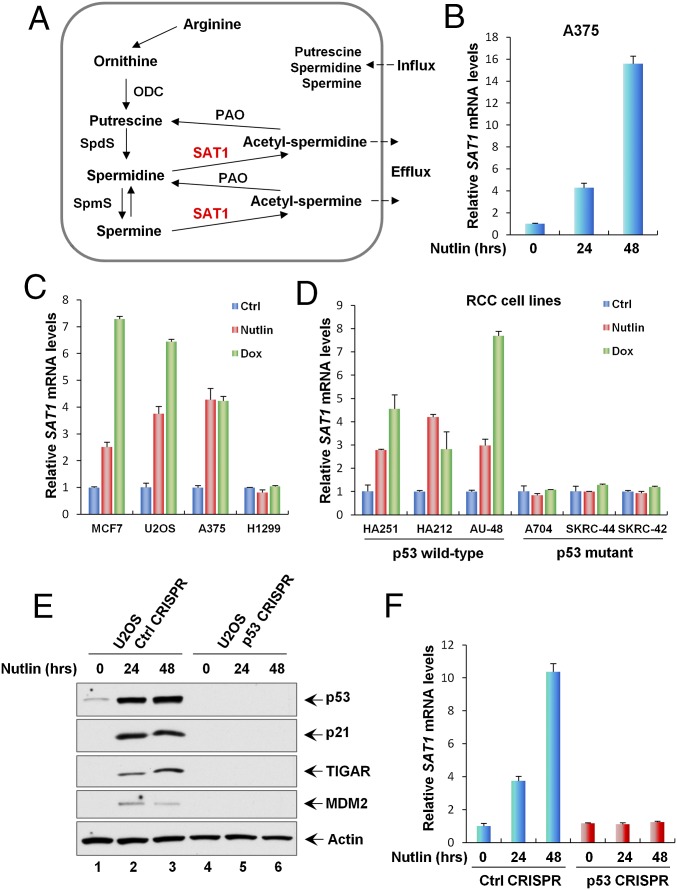
The polyamines are amino acid-derived polycationic alkylamines that are essential for the growth and survival of eukaryotic cells (22). They consist of putrescine, spermidine, and spermine, and their levels are tightly controlled and regulated by enzymes involving polyamine biosynthesis, catabolism, and transport (23). Notably, Scuoppo et al. (24) reported that the deletion of genes in the polyamine–hypusine axis results in increased tumor formation in a mouse lymphoma model, implicating polyamine metabolism as having a role in modulating tumorigenesis. Furthermore, polyamine metabolism is frequently dysregulated in cancers, thus making it an attractive target for therapeutic intervention (23, 25). SAT1 is the rate-limiting enzyme controlling the first intracellular pathway of polyamine catabolism. As shown in Fig. 1A, SAT1 catalyzes the acetylation of spermidine and spermine to form N1-acetylspermidine and N1-acetylspermine, which then are either exported from the cells or converted back to putrescine or spermidine by N1-acetylpolyamine oxidase (26). Therefore, overexpression of SAT1 leads to an overall depletion of spermidine and spermine while increasing the levels of putrescine, N1-acetylspermidine, and N1-acetylspermine (27). In fact, N1, N11-di(ethyl)norspermine (DENSpm), a polyamine analog that is known to induce SAT1, has been applied in several clinical trials in patients with advanced malignancies (28–31). Nonetheless, whether SAT1 has a role in tumor suppression remains largely unknown, nor is the molecular mechanism of polyamine metabolism in modulating tumorigenesis well understood.
Fig. 1.
SAT1 is induced by p53. (A) The polyamine metabolism pathway. ODC, ornithine decarboxylase; PAO, N1-acetylpolyamine oxidase; SAT1, spermine/spermidine N1-acetyltransferase 1; SpdS, spermidine synthase; SpmS, spermine synthase. (B) qRT-PCR analysis of the SAT1 transcript level was performed with total RNAs purified from A375 cells treated with Nutlin (10 μM) for the indicated times. (C) qRT-PCR analysis of the mRNA expression levels of SAT1 in the indicated cancer cell lines (MCF7, U2OS, A375, and H1299) untreated (Ctrl) or treated with Nutlin (10 μM) or Dox (0.2 μg/mL) for 24 h. (D) The indicated RCC cell lines were untreated or treated with Nutlin (10 μM) or Dox (0.2 μg/mL) for 24 h, and SAT1 mRNA levels were measured using qRT-PCR. (E) U2OS control CRISPR and p53 CRISPR cell lines were treated with Nutlin (10 μM) for the indicated times, and total protein lysates were subjected to Western blotting analysis for the expression of p53, p21, TIGAR, MDM2, and Actin. (F) SAT1 transcript levels were measured by qRT-PCR in U2OS control CRISPR and p53 CRISPR cell lines treated with Nutlin (10 μM) for the indicated times. All mRNA expression levels were normalized with GAPDH. Error bars represent the SD from three experiments.
In this study, we identified SAT1 as a p53 metabolic target gene that can be induced by both endogenous and exogenous p53. Expression of SAT1 in xenograft cells significantly impaired tumor growth, indicating that it acts as a tumor suppressor in vivo. Surprisingly, we also discovered that SAT1 is involved in regulating the p53-mediated ROS response and ferroptosis. These findings further broadened our understanding of the complex regulation of ferroptotic cell death and shed light on the role of SAT1 in p53-mediated tumor suppression.
Results
SAT1 Is Induced by p53.
In normal cells, the p53 protein is controlled at extremely low levels by its negative regulator MDM2 (32). Nutlin, a small-molecule antagonist of MDM2, inhibits the interaction between p53 and MDM2 and subsequently activates the transcription of p53 downstream targets (21). To identify metabolic targets of p53, the melanoma cell line A375 expressing wild-type p53 was either untreated or treated with Nutlin, and total RNA derived from these cells was subjected to RNA sequencing. In our previous study, we identified PHGDH from the RNA-sequencing result as a metabolic target of p53 that is critical for inducing the apoptotic response upon serine starvation (15). In addition, we also found that mRNA levels of SAT1 are significantly up-regulated upon p53 activation (Fig. 1B). It is well known that p53 also can be activated by DNA damage. To confirm that SAT1 is regulated by p53, various human cancer cell lines, i.e., MCF7, U2OS, A375, and H1299, were either left untreated or were treated with Nutlin or the DNA-damaging drug doxorubicin (Dox). SAT1 mRNA levels were significantly up-regulated with either Nutlin or Dox treatment in cancer cell lines expressing wild-type p53 (U2OS, MCF7, and A375), but no apparent effects were detected in the p53-null cell line H1299 (Fig. 1C). Similarly, an increase in SAT1 mRNA levels was observed upon Nutlin treatment and upon DNA damage in human renal cell carcinoma (RCC) cell lines expressing wild-type p53 (HA251, HA212, and AU-48) (Fig. 1D). However, SAT1 expression was not affected by either Nutlin or Dox in p53 mutant RCC cell lines (A704, SKRC-44, and SKRC-42) (Fig. 1D). To confirm that the regulation of SAT1 transcription is dependent on p53, we generated a p53-knockout U2OS cell line using CRISPR-cas9 technology. As shown in Fig. 1E, both the p53 protein itself and Nutlin-induced activation of the downstream targets p21, TIGAR, and MDM2 were completely abolished upon p53 knockout (p53 CRISPR). Notably, SAT1 activation also was abrogated in p53-knockout U2OS cells treated with Nutlin (Fig. 1F). Together, these data indicate that SAT1 gene expression is enhanced in the presence of activated p53.
Identification of SAT1 as a p53 Target.
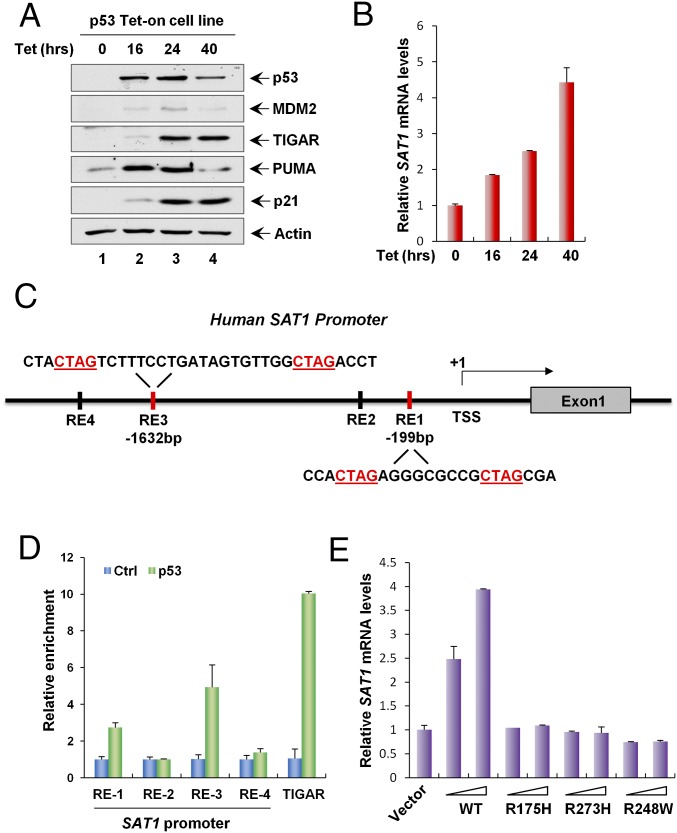
To explore further whether SAT1 can be induced by exogenous p53, we established a H1299 cell line in which p53 expression is inducible by the addition of tetracycline (Tet-on condition). As expected, p53 was able to activate the expression of MDM2, TIGAR, PUMA (also known as “BBC3”), and p21 (also known as “CDKN1A”) (Fig. 2A). Notably, SAT1 mRNA levels were also up-regulated at various time points after p53 induction (Fig. 2B). The promoter region of the human SAT1 gene at chromosome Xp22.1 contains two potential sites that match the consensus p53-binding sequence (Fig. 2C). ChIP analysis of H1299 cells expressing exogenous p53 revealed increased binding of p53 with two indicated binding sites (Fig. 2D). Moreover, overexpression of wild-type p53 by transient transfection increased the levels of SAT1 mRNA, whereas SAT1 expression was not affected by mutations in three p53 hotspots (R175H, R273H, and R248W) (Fig. 2E). Collectively, these data demonstrate that SAT1 is a transcriptional target of p53.
Fig. 2.
SAT1 is a transcriptional target of p53. (A) p53 Tet-on H1299 cells were induced with 0.5 μg/mL tetracycline (Tet) for the indicated times, and total protein lysates were analyzed by Western blotting using antibodies against p53, MDM2, TIGAR, PUMA, p21, and Actin. (B) SAT1 mRNA expression levels were measured by qRT-PCR in p53 Tet-on H1299 cells induced with 0.5 μg/mL tetracycline for the indicated times. (C) Schematic representation of the promoter region in the human SAT1 gene. The p53-binding sites upstream of the first exon are indicated as responsive elements (RE). TSS, transcription start site. (D) ChIP-qPCR was performed in H1299 cells transfected with empty vector (Ctrl) or p53. (E) H1299 cells were transfected with empty vector or increasing amounts of p53 wild-type or mutant vectors (R175H, R273H, and R248W), and SAT1 mRNA levels were analyzed by qRT-PCR.
Effect of SAT1 Overexpression on Growth Arrest, Apoptosis, and Tumorigenesis.
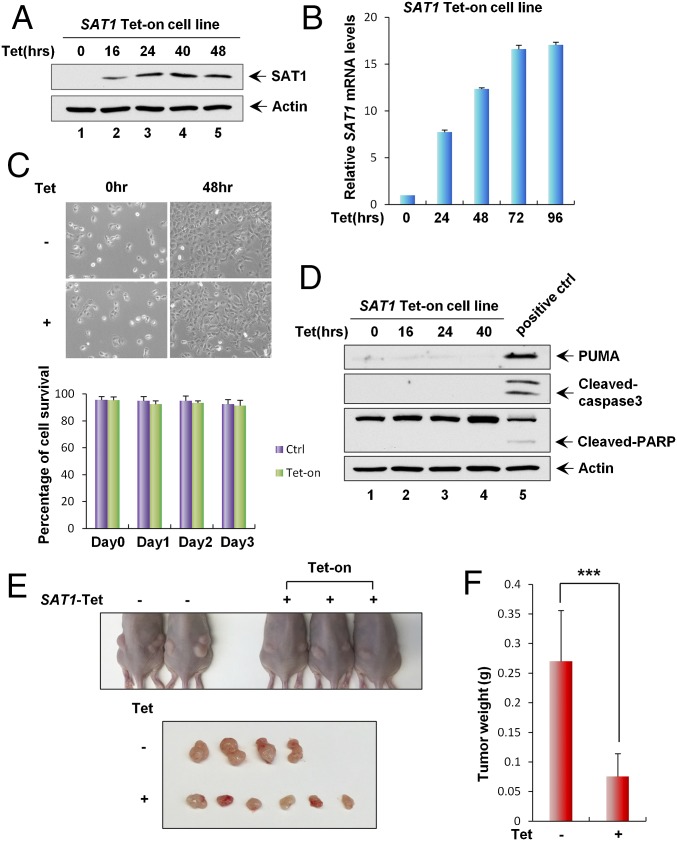
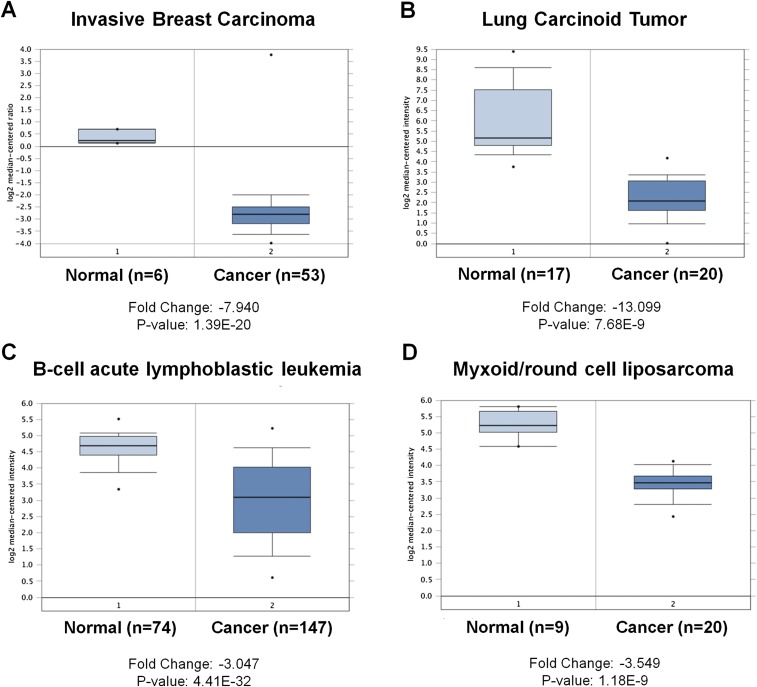
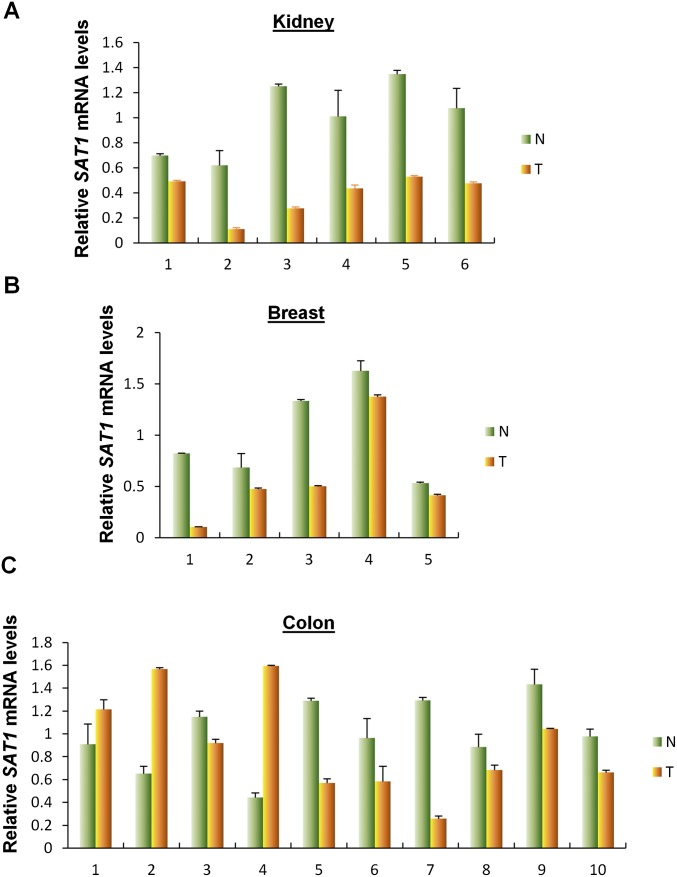
SAT1 is a key polyamine catabolism enzyme that mediates the acetylation of spermidine and spermine. Overexpression of SAT1 has been shown to cause a rapid depletion of the polyamine pool (27). To investigate the effect of SAT1 on cell proliferation and survival in a physiological setting, we generated a SAT1 Tet-on cell line using p53-null H1299 cells. Upon the addition of tetracycline, both SAT1 protein and mRNA levels were increased in a time-dependent manner (Fig. 3 A and B). Surprisingly, no obvious growth arrest or cell death was observed upon SAT1 induction (Fig. 3C). In addition, expression of apoptosis markers [PUMA, cleaved caspase3, and cleaved poly (ADP-ribose) polymerase (PARP)] were not detected in cell lysates from Tet-on cells expressing SAT1, indicating the absence of apoptosis (Fig. 3D). To explore whether SAT1 has tumor-suppressive activities in vivo, we injected the SAT1 Tet-on H1299 cells into nude mice and fed the mice tetracycline-containing food to induce the expression of SAT1 in xenograft cells. Upon SAT1 induction, the growth of p53-null H1299 cells was dramatically reduced in the xenograft tumor growth assay (Fig. 3 E and F). Notably, the expression data from the Oncomine database (https://www.oncomine.org) revealed that SAT1 expression is down-regulated in a variety of human cancers, including invasive breast carcinoma, lung carcinoid tumor, B-cell acute lymphoblastic leukemia, and myxoid/round cell liposarcoma (Fig. S1). Further analysis of 21 pairs of human tumors and adjacent normal tissue obtained from our local tumor bank also showed that SAT1 was down-regulated in 86% of the human cancer specimens (in six of six kidney tumor samples, in five of five breast tumor samples, and in 7/10 colon tumor samples) (Fig. S2). These data indicate that SAT1 has tumor-suppressive activities independent of cell growth arrest and apoptosis and that it may be a common oncogenic target during tumorigenesis in various human malignancies.
Fig. 3.
Effect of SAT1 overexpression on growth arrest, apoptosis, and tumorigenesis. (A) Cells in the SAT1 Tet-on inducible stable cell line were treated with 0.5 μg/mL tetracycline for the indicated times followed by Western blot analysis. Actin was used as a loading control. (B) qRT-PCR analysis of mRNA levels of SAT1 in cells in the SAT1 Tet-on stable cell line at the indicated times after induction. (C) Representative phase-contrast images of SAT1 Tet-on stable cells uninduced (−) or induced with 0.5 μg/mL tetracycline (+) for 48 h. (Magnification: 10×.) The percentage of cells surviving at the indicated times is shown as mean ± SD. (D) SAT1 Tet-on stable cells were induced with 0.5 μg/mL tetracycline for the indicated times, and total protein lysates were subjected to Western blot analysis for the expression of PUMA, cleaved caspase3, cleaved PARP, and Actin. (E) Xenograft tumors from SAT1 Tet-on cells shown in A. (F) Tumor weight was determined (error bars indicate SD from four tumors in control mice and six tumors in Tet-on mice). ***P < 0.001.
Fig. S1.
SAT1 is down-regulated in tumors of human cancer patients. (A–D) Datasets obtained from the Oncomine database showing that the transcription levels of SAT1 in the indicated cancer types are lower in tumors (cancer) than in adjacent normal tissues (normal). The actual fold change and P value are indicated at the bottom of each panel.
Fig. S2.
SAT1 is down-regulated in tumors of human cancer patients (continued). (A–C) Quantitative RT-PCR analysis of the expression levels of SAT1 in paired normal and cancer tissues from kidney (A), breast (B), and colon (C). Average expression levels in normal tissues were normalized to 1 in each type of cancer. Data are shown as the mean ± SD from two technical replicates. N, normal tissue; T, cancer tissue.
SAT1 Overexpression Leads to Lipid Peroxidation and Ferroptosis upon ROS Stress.
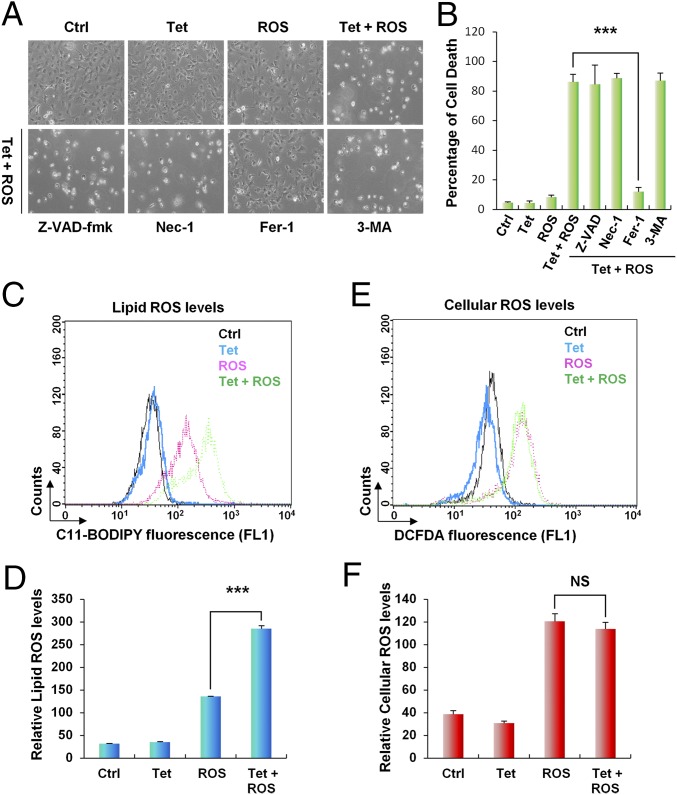
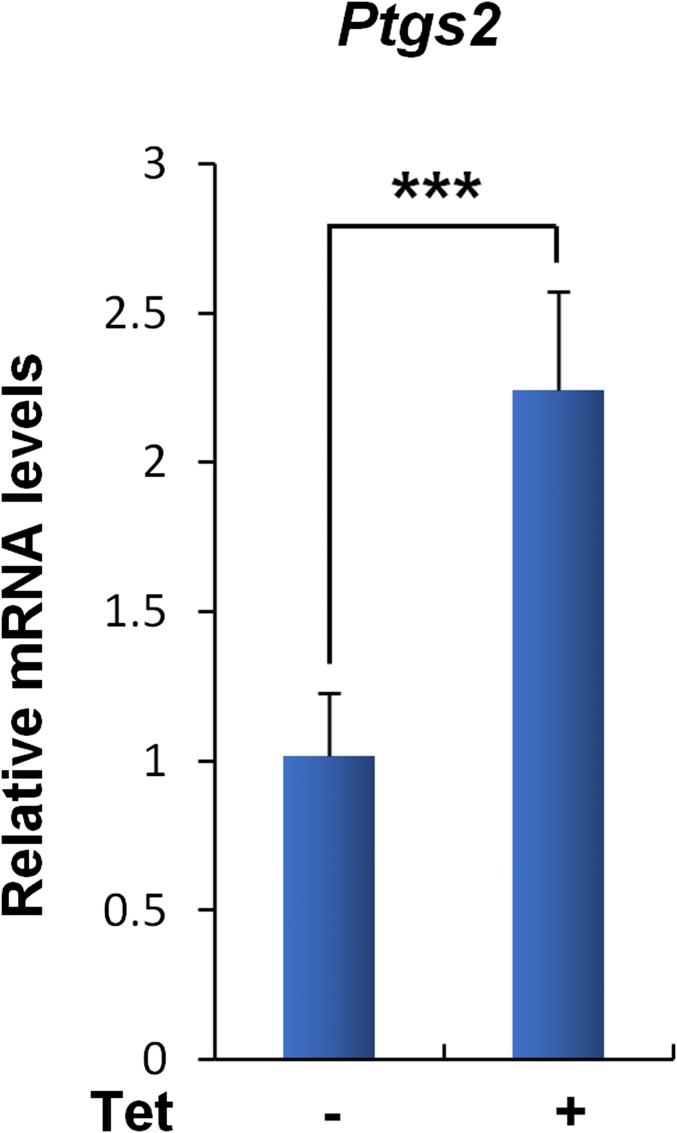
Our previous studies have revealed that tumor suppression mediated by p53 can occur in the absence of growth arrest, apoptosis, and senescence (9). Notably, p53-mediated ferroptosis in response to ROS stress through SLC7A11 suppression is a recently discovered tumor-suppression mechanism (11). In fact, polyamine metabolism has been implicated in ROS stress response, because the natural polyamine spermine can function as a free radical scavenger, whereas catabolization of polyamine by SAT1 and polyamine oxidase (PAO) gives rise to H2O2 and increase oxidative stress (33–35). Nevertheless, the cell-death response upon SAT1 expression in the setting of oxidative stress exposure is unexplored. To evaluate whether SAT1 overexpression modulates the ROS stress response, we treated SAT1 Tet-on cells with the ROS-inducing agent tert-butyl hydroperoxide (TBH) as previously described (36). As shown in Fig. 4A, no obvious cell death was observed upon either SAT1 induction or ROS treatment alone. However, the combination of SAT1 induction and ROS treatment induced significant cell death (Fig. 4 A and B). The mode of cell death then was confirmed by treatment with different cell death inhibitors. Notably, Ferrostatin-1 (Fer-1), a specific ferroptosis inhibitor, completely rescued SAT1- and ROS-induced cell death. In contrast, inhibitors of apoptosis [carbobenzoxy-valyl-alanyl-aspartyl-[O-methyl]-fluoromethylketone (Z-VAD-fmk)], necroptosis (necrostatin-1), and autophagy (3-methylademine) failed to suppress cell death (Fig. 4 A and B). This result demonstrated that SAT1 expression triggers ferroptosis upon ROS stress. Notably, the up-regulation of Ptgs2 (prostaglandin-endoperoxide synthase 2) has recently been identified as a potential molecular marker of ferroptosis by Stockwell’s laboratory (37). We therefore examined Ptgs2 levels in xenograft tumors. Indeed, Ptgs2 was found to be significantly up-regulated in the tumors when SAT1 was induced, suggesting that ferroptosis is involved in tumor suppression (Fig. S3).
Fig. 4.
SAT1 overexpression leads to lipid peroxidation and ferroptosis upon ROS stress. (A) Representative phase-contrast images of SAT1 Tet-on cells treated with 0.5 μg/mL tetracycline and 60 μM TBH for 24 h. The images also show cells treated with tetracycline and TBH with the addition of specific cell-death inhibitors for 24 h: Z-VAD-fmk, a caspase inhibitor, 10 μg/mL; Necrostatin 1 (Nec-1), a necroptosis inhibitor, 10 μg/mL; Ferrostatin-1 (Fer-1), a ferroptosis inhibitor, 2 μM; and 3-methyladenine (3-MA), an autophagy inhibitor, 2 mM. (B) The percentages of cell death for all experiments shown in A were measured by trypan blue exclusion assay. (C and E) Lipid (C) and cytosolic (E) ROS production in SAT1 Tet-on cells treated with tetracycline and TBH for 24 h was assessed by flow cytometry using C11-BODIPY and H2DCFDA. (D and F) Quantification of lipid (D) and cytosolic (F) ROS levels from three representative experiments. Data are shown as mean ± SD. ***P < 0.001. NS, no significant difference.
Fig. S3.
The ferroptosis marker Ptgs2 is up-regulated in xenograft tumors with SAT1 induction. The mRNA levels of Ptgs2 were determined by qRT-PCR analysis in four xenograft tumors without SAT1 induction (−) and in six xenograft tumors with SAT1 induction (+). Data are shown as mean ± SD. ***P < 0.001.
Previous studies have indicated that lipid peroxidation is a crucial event on the cell membrane that leads to ferroptosis (20). We then examined lipid ROS levels in SAT1 Tet-on cells upon SAT1 induction and ROS treatment. SAT1 induction alone had only a modest effect on lipid ROS, and ROS treatment alone elevated lipid ROS level by fourfold (Fig. 4 C and D). However, concomitant SAT1 induction and ROS treatment increased the lipid ROS level by ninefold (Fig. 4 C and D). In contrast, no differences in cellular ROS levels were observed between cells with ROS treatment alone and those with the addition of SAT1 induction (Fig. 4 E and F). Taken together, these data demonstrate that SAT1 overexpression leads to lipid peroxidation and ferroptosis upon ROS stress.
SAT1 Contributes to p53-Mediated Ferroptosis upon ROS Stress.
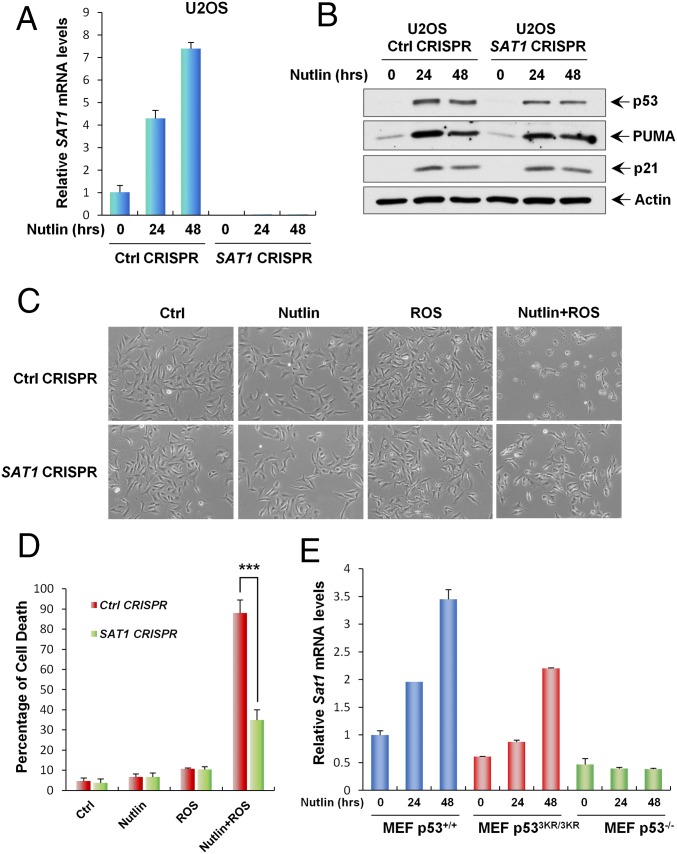
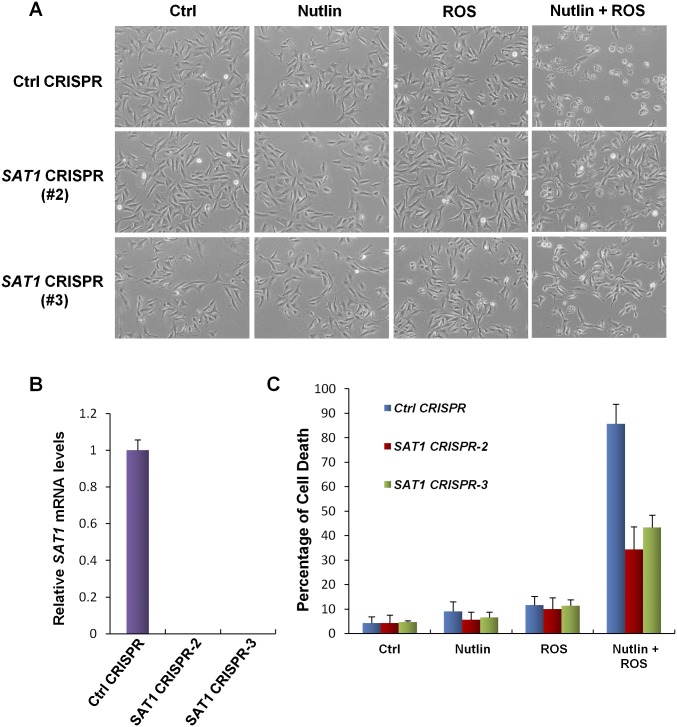
Our finding that SAT1 is a transcriptional target of p53 indicates that SAT1 may contribute to p53-mediated ferroptotic cell death and ROS response. To test our hypothesis, we established a SAT1-knockout CRISPR-cas9 cell line in p53 wild-type U2OS cells. Because the SAT1 antibody could not detect endogenous SAT1 protein, we designed a quantitative RT-PCR (qRT-PCR) primer between the targeting regions of two guide RNAs and thereby were able to confirm knockout efficiency through qRT-PCR. As shown in Fig. 5A, the mRNA levels of SAT1 were increased markedly when p53 was activated by Nutlin in mock-knockout U2OS cells (Ctrl CRISPR). In contrast, SAT1 expression was undetectable with or without Nutlin treatment in SAT1-knockout U2OS cells (SAT1 CRISPR) (Fig. 5A). Notably, SAT1 deficiency did not affect p53-mediated growth arrest and apoptosis, because the expression of p21 and PUMA in response to the Nutlin treatment was not changed upon SAT1 knockout (Fig. 5B). To evaluate the role of SAT1 in p53-mediated ferroptosis, U2OS mock-knockout and SAT1-knockout cells were treated with Nutlin and ROS. Consistent with our previous results, Nutlin or ROS treatment alone failed to elicit a cell death response, but combination treatment with both Nutlin and ROS induced massive ferroptotic cell death in mock-knockout U2OS cells (Fig. 5 C and D). Notably, the cell death was abrogated significantly upon knockout of SAT1, indicating that p53-mediated activation of SAT1 contributes to ferroptotic cell death in the presence of ROS stress (Fig. 5 C and D and Fig. S4).
Fig. 5.
SAT1 contributes to p53-mediated ferroptosis upon ROS stress. (A) qRT-PCR analysis of SAT1 mRNA levels in stable U2OS control (Ctrl) CRISPR and SAT1 CRISPR cell lines treated with 10 μM Nutlin for the indicated times. (B) U2OS control CRISPR and SAT1 CRISPR stable cell lines were treated with 10 μM Nutlin for the indicated times, and total protein lysates were subjected to Western blot analysis for the expression of p53, PUMA, p21, and Actin. (C) Images of U2OS control CRISPR and SAT1 CRISPR cells treated with 10 μM Nutlin and 350 μM TBH for 24 h. (D) Quantification of cell death in C from three technical triplicates. Data are shown as mean ± SD. ***P < 0.001. (E) MEFs from the indicated genotypes were treated with 10 μM Nutlin, and Sat1 transcript levels were measured by qRT-PCR.
Fig. S4.
SAT1 contributes to p53-mediated ferroptosis upon ROS stress (continued). (A) Representative phase-contrast images showing the U2OS control CRISPR cell line and two additional stable SAT1 CRISPR clones treated with 10 μM Nutlin and 350 μM TBH for 24 h. (B) qRT-PCR analysis of mRNA levels of SAT1 in the control CRISPR cell line and SAT1 CRISPR clones. (C) Quantification of cell death in A from three technical triplicates (mean ± SD).
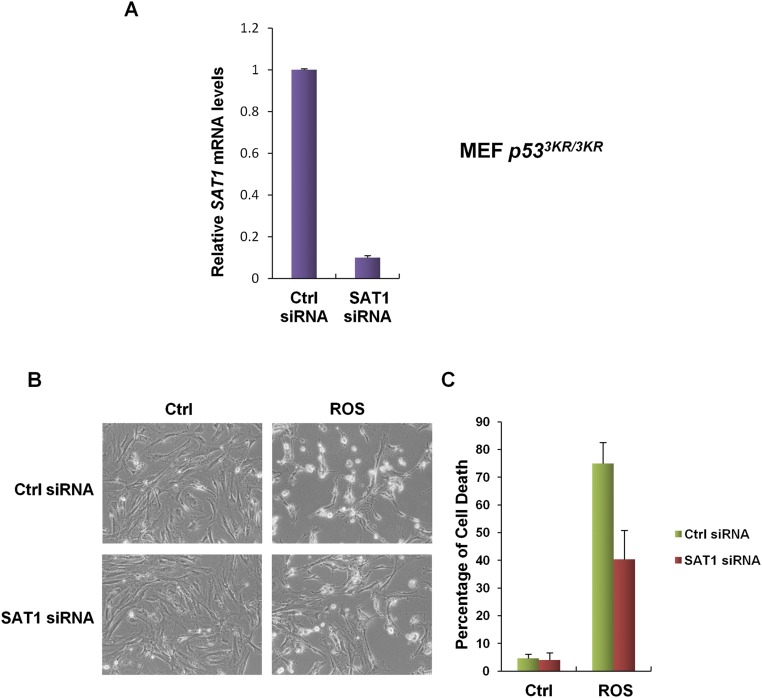
Previously, a p53 acetylation-deficient mutant, p533KR, was found to retain the ability to promote ferroptosis (11). Moreover, mice that harbor these mutations still retain intact tumor suppression (9). Therefore, we examined the levels of Sat1 transcripts in mouse embryonic fibroblasts (MEFs) derived from p53+/+, p533KR/3KR, and p53−/− mice. qRT-PCR analysis revealed that Sat1 expression is increased markedly in both p53+/+ and p533KR/3KR MEFs in response to Nutlin treatment, but no change was observed in p53−/− MEFs (Fig. 5E). In addition, knock-down of Sat1 by siRNA in p533KR/3KR MEFs partially rescued ROS-induced ferroptosis, suggesting that SAT1 contributes, at least in part, to p533KR-mediated ferroptotic responses (Fig. S5). Collectively, these data indicate that p53-mediated regulation of SAT1 contributes to p53-mediated ferroptosis, ROS response, and tumor suppression.
Fig. S5.
SAT1 contributes to p53-3KR–mediated ferroptosis upon oxidative stress. (A) qRT-PCR analysis of SAT1 mRNA levels in p533KR/3KR MEFs transfected with control siRNA or SAT1 siRNA for 48 h. (B) p533KR/3KR MEFs were transfected with control siRNA or SAT1 siRNA for 48 h and then were treated with TBH (150 μM) for 24 h before the images were taken. (C) Quantification of cell death in B from three technical triplicates (mean ± SD).
Molecular Mechanism of SAT1-Induced Ferroptosis.
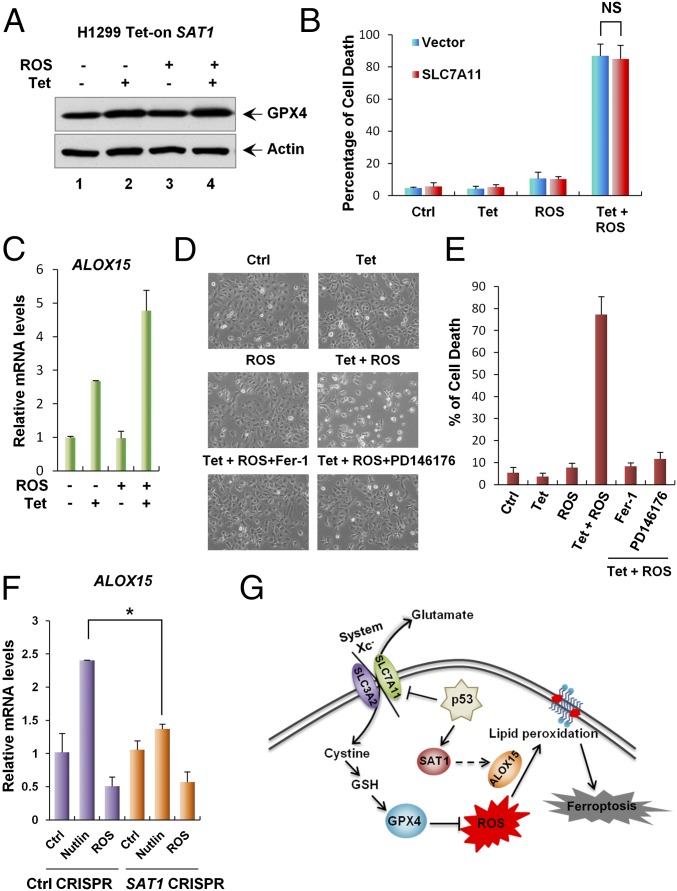
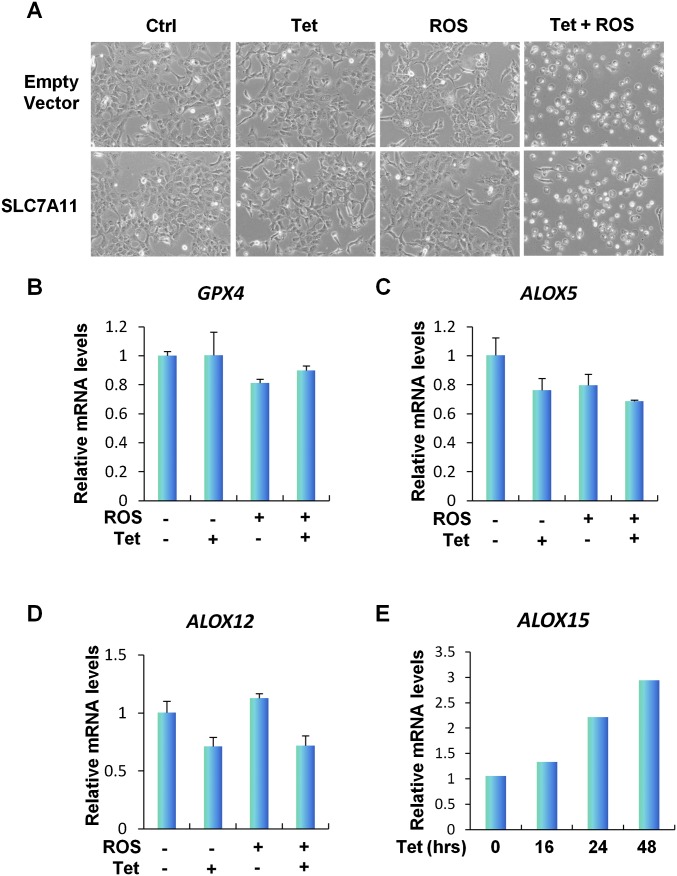
Although the mechanism of SAT1-induced ferroptosis upon ROS stress is still unknown, some studies have indicated that the polyamine metabolism pathway might regulate histone modification and therefore could alter gene expression (38, 39). We hypothesized that SAT1 regulates ferroptosis by modulating the expression of components in the ferroptosis pathways. Glutathione peroxidase 4 (GPX4) is a glutathione peroxidase that functions as a central regulator of ferroptosis. Inhibition of GPX4 has been shown to increase the level of lipid peroxidation and lead to ferroptosis (37). Therefore, we examined GPX4 expression levels in SAT1 Tet-on cells. However, no changes were observed at either the protein or mRNA levels of GPX4 upon SAT1 induction and ROS treatment (Fig. 6A and Fig. S6B). Our previous studies also have identified p53-mediated transcriptional repression of SLC7A11, a component of the cystine/glutamate antiporter that is critical for ROS-induced ferroptosis (11). Again, overexpression of SLC7A11 did not rescue SAT1-induced ferroptosis upon ROS stress, indicating that SAT1 functions independently or downstream of SLC7A11 (Fig. 6B and Fig. S6A). Notably, lipid peroxidation is a critical event on the cell membrane that leads to ferroptosis, and studies have shown that arachidonate 15-lipoxgenase (ALOX15) is the member of the lipoxygenase family that is specifically responsible for oxidative stress-induced cell death (40). Interestingly, ALOX15 expression levels were elevated upon SAT1 induction and with combination of SAT1 induction ROS treatment, whereas no increase was observed in the levels of the other two lipoxygenases, 5-lipoxygenase (ALOX5) and 12-lipoxygenase (ALOX12) (Fig. 6C and Fig. S6 C–E). In addition, SAT1- and ROS-induced ferroptosis was completely abrogated by PD146176, an ALOX15-specific inhibitor (Fig. 6 D and E) (41). Furthermore, ALOX15 expression was also partially attenuated upon SAT1 knockout after p53 activation via Nutlin, suggesting that ALOX15 is a downstream effector of p53-induced SAT1 (Fig. 6F). Taken together, these data indicate that ALOX15 is critical for SAT1-induced ferroptosis upon ROS stress (Fig. 6G).
Fig. 6.
Mechanism of SAT1-induced ferroptosis. (A) SAT1 Tet-on cells were treated with tetracycline and TBH, and total cell lysates were subjected to Western blot analysis for the expression of GPX4. Actin was used as a loading control. (B) SAT1 Tet-on cells were transfected with either control or plasmid overexpressing SLC7A11 followed by treatment with tetracycline and TBH for 24 h. Quantification of cell death is shown as the mean ± SD from three technical triplicates. NS, no significant difference. (C) qRT-PCR analysis of ALOX15 mRNA levels in SAT1 Tet-on cells treated with tetracycline and TBH. (D) Representative phase-contrast images of SAT1 Tet-on cells treated with tetracycline and TBH with the addition of the ferroptosis inhibitor (Fer-1) or ALOX15 inhibitor (PD146176). (E) The percentages of cell death for all experiments shown in D were measured by trypan blue exclusion assay. (F) U2OS control CRISPR and SAT1 CRISPR cells were treated with 10 μM Nutlin or 350 μM TBH for 24 h, and total RNA was extracted for the analysis of ALOX15 mRNA levels using qRT-PCR. Data are shown as the mean ± SD of three technical triplicates. *P < 0.05. (G) A model for the regulation of ferroptosis by p53, SAT1, and SLC7A11.
Fig. S6.
Mechanism of SAT1-induced ferroptosis (continued). (A) Representative phase-contrast images of SAT1 Tet-on cells transfected with empty vector or vector overexpressing SLC7A11 followed by treatment with tetracycline and TBH (60 μM) for 24 h. (B–D) qRT-PCR analysis of GPX4 (B), ALOX5 (C), and ALOX12 (D) mRNA levels in SAT1 Tet-on cells treated with tetracycline and TBH. (E) SAT1 Tet-on cells were induced with 0.5 μg/mL tetracycline for the indicated times, and ALOX15 mRNA levels were examined using qRT-PCR.
Discussion
Several recent studies have highlighted the importance of p53 in the regulation of cellular metabolism and the response to oxidative stress. In this study we provide evidence linking p53 function to polyamine metabolism and the ROS response through a metabolic target, SAT1, an enzyme that catalyzes the rate-limiting step of polyamine catabolism. SAT1 was initially identified as a p53-inducible gene from RNA sequencing of p53 wild-type melanoma cells treated with Nutlin, a small molecule that activates p53 by inhibiting p53’s negative regulator MDM2. Subsequently, we showed that SAT1 is highly inducible by both Nutlin and DNA damage in various cancer cell lines and that the transcriptional regulation is dependent on p53. This finding is also consistent with the previous finding that SAT1 is a highly inducible target by 5-fluorouracil (42). ChIP-qPCR analysis revealed two p53-binding sites on the promoter region of SAT1, indicating that SAT1 is a direct p53 target.
Further characterization of SAT1 functions was carried out in a tetracycline-inducible cell line expressing SAT1. Although other groups using transient transfection (27, 43) previously reported that SAT1 overexpression causes rapid cell-growth arrest in HeLa cells and apoptosis in glioblastoma cells, we observed neither of these phenomena in our inducible expression system. These differing results may be attributable to the levels of SAT1 being expressed in cells, because the lower level of SAT1 expression induced by tetracycline may mimic the physiological condition better than transient transfection. Our xenograft study clearly indicated that SAT1 possesses tumor-suppressive properties. Although genetic alterations of SAT1 have not been reported, both our analysis of SAT1 expression levels in cancer patient samples and the Oncomine database demonstrated that SAT1 is significantly down-regulated in a variety of human cancers. This down-regulation is also consistent with the elevated polyamine levels in cancer cells.
Although numerous metabolic targets of p53 have been identified, how metabolic functions contribute to p53-mediated tumor suppression is not completely understood. Intriguingly, our recent studies have revealed that ferroptosis, an iron-dependent and nonapoptotic cell-death mode, provides another layer of protection against tumorigenesis (11). In response to inappropriate levels of ROS, p53 sensitizes cells to ferroptosis by repressing the transcription of SLC7A11, a component of the cystine/glutamate antiporter (11). Nonetheless, how ferroptosis is regulated and what the other targets of p53 contribute to ROS-induced ferroptosis remain largely unknown. In this study, we discovered that SAT1 significantly induced lipid peroxidation and ferroptosis upon ROS exposure. Moreover, our data indicate that p53-mediated transcriptional activation of SAT1 is critical for ROS-induced ferroptosis, because knockout of SAT1 significantly abrogated p53-induced ferroptosis upon ROS stress. Interestingly, although SAT1 failed to elicit growth arrest and apoptosis, elevation of the ferroptosis maker Ptgs2 was detected in xenograft tumors harboring SAT1 induction. This finding further indicates the importance of ferroptosis in suppressing tumor growth, although future investigations are necessary to evaluate the precise role of ferroptosis in SAT1-mediated tumor suppression.
Ferroptosis is a mode of cell death that involves the production of both cytosolic and lipid ROS resulting from metabolic dysfunction (20, 37). GPX4 is a glutathione peroxidase that catalyzes the reduction of lipid peroxides on the cellular membrane. Lipid peroxidation and ferroptosis were observed in mouse xenografts harboring a Gpx4 knockout, highlighting the central regulating role of GPX4 in the ferroptotic pathway (37). However, we did not observe a change in the level of GPX4 expression in SAT1-induced ferroptotic cells, nor did the overexpression of SLC7A11 rescue cell death. Notably, we found that SAT1-induced ferroptosis is dependent on ALOX15, a lipoxygenase that catalyzes the peroxidation of arachidonic acid. Our data demonstrate that SAT1 increases the expression of ALOX15, and the ALOX15 inhibitor can completely rescue SAT1-induced ferroptosis. This effect is also consistent with the previous finding that ALOX15 is the core mediator that translates oxidative stress into lipid peroxidation and cell death (40). Nonetheless, although we found a correlation between SAT1 and induced expression of ALOX15, the precise mechanism by which SAT1 regulates ALOX15 expression is still not clear. Notably, it is well-known that overexpression of SAT1 leads to depletion of spermidine and spermine and to a significant increase in putrescine and N1-acetyl spermidine (27). We speculate that SAT1 may regulate the expression of ALOX15 indirectly by affecting the cellular polyamine levels. Further investigations are needed to explore the role of polyamines in transcriptional regulation of ALOX15 and the precise role of ALOX15 in modulating ferroptosis.
Taken together, the results of our study revealed a p53 metabolic target, SAT1, that contributes to the p53-mediated ROS response and ferroptosis. This work provides insight into the regulation of ferroptosis through polyamine metabolism.
Materials and Methods
Cell Culture and Stable Lines.
All cells were cultured in a 37 °C incubator with 5% CO2. All media used for cancer cell lines were supplemented with 10% (vol/vol) FBS, 100 U/mL penicillin, and 100 μg/mL streptomycin (all from Gibco). MEFs were generated from day 13.5 embryos according to standard procedures. FBS used for MEFs was heat-inactivated and supplemented with 1% nonessential amino acids. The p53-inducible stable line was generated in the H1299 cell line as previously described (11). To induce the expression of p53, 0.5 μg/mL of tetracycline was added to the culture medium. To generate the stable SAT1-inducible cell line, human SAT1 cDNA was cloned into the Tet-on pTRIPZ inducible expression vector (Thermo Open Biosystems) followed by transfection using Lipofectamine 2000 (Invitrogen) and selection and maintenance with puromycin (1 μg/mL) in DMEM containing 10% (vol/vol) tetracycline-free FBS. Doxycycline (0.5 μg/mL) was used to induce the expression of SAT1. p53 CRISPR-cas9–knockout U2OS cell lines were generated by transfection of p53 double nickase plasmid (sc-416469-NIC; Santa Cruz) followed by selection with puromycin (1 μg/mL). Similarly, SAT1 CRISPR-cas9–knockout U2OS cell lines were generated by transfection of pGL3-U6-sgRNA-PGK-puromycin vectors containing guide RNAs targeting exon 4 and pST1374-Cas9 vector. Guide RNA sequences targeting the SAT1 gene are 5′-GTCATAGGTAAAATAGTACATGG-3′ and 5′-TGGCAAGTTATTGTATCTTGAGG-3′. Single colonies with p53 or SAT1 knockout were selected and used for experiments. Knock-down of SAT1 was performed by transfection of MEFs with siRNA duplex oligoset (ON-TARGETplus SMARTpool L05579601; Dharmacon) two times with Lipofectamine 2000 (Invitrogen) according to the manufacturer’s protocol.
Western Blotting and Antibodies.
Cell lysates were prepared in Flag lysis buffer with fresh protease inhibitor mixture. Protein extracts were analyzed by Western blotting according to standard protocols using primary antibodies specific for p53 (human: DO-1; Santa Cruz), MDM2 (Ab5; Millipore), TIGAR (E-2; Santa Cruz), PUMA (H-136; Santa Cruz), p21 (SX118; Santa Cruz), Actin (A3853; Sigma-Aldrich), SAT1 (H77; Santa Cruz), cleaved caspase3 (Asp175; Cell Signaling Technologies), cleaved PARP (9542S; Cell Signaling Technologies), and GPX4 (ab125066; Abcam). HRP-conjugated anti-mouse and anti-rabbit secondary antibodies (GE Healthcare) were used, and signals were detected on autoradiographic films with a Pierce ECL Western blotting detection system or SuperSignal West Dura reagents (Thermo Scientific).
RNA Extraction and qRT-PCR.
Total RNA was extracted using TRIzol Reagent (Life Technologies) according to the manufacturer’s protocol. cDNA was synthesized from total RNA using M-MulV Reverse Transcriptase kit (New England Biolabs). PCR analysis was performed using the Applied Biosystems 7500 Fast System. For the qRT-PCR analysis of human transcripts the following primers were used: SAT1 forward 5′-CCGTGGATTGGCAAGTTATT-3′, SAT1 reverse 5′-TCCAACCCTCTTCACTGGAC-3′; PTGS2 forward 5′-CTTCACGCATCAGTTTTTCAAG-3′, PTGS2 reverse 5 -TCACCGTAAATATGATTTAAGTCCAC-3′; ALOX15 forward 5′-AGCCTGATGGGAAACTCTTG-3′, ALOX15 reverse 5′-AGGTGGTGGGGATCCTGT-3′; ALOX5 forward 5′-CCTCAGGCTTCCCCAAGT-3′, ALOX5 reverse 5′-GAAGATCACCACGGTCAGGT-3′; ALOX12 forward 5′-GCTCCTGGAACTGCCTAGAA-3′, ALOX12 reverse 5′-TCATCATCCTGCCAGCACT-3′; GPX4 forward 5′-TTCCCGTGTAACCAGTTCG-3′, GPX4 reverse 5′-CGGCGAACTCTTTGATCTCT-3′; and GAPDH forward 5′-ATCAATGGAAATCCCATCACCA-3′, GAPDH reverse 5′-GACTCCACGACGTACTCAGCG-3′. For the qRT-PCR analysis of mouse transcripts the primers used were SAT1 forward 5′-GGCTAAATTTAAGATCCGTCCA-3′ and SAT1 reverse 5′-CATG-TATTCATATTTAGCCAGTTCCTT-3′.
ChIP.
ChIP assays were performed as previously described in H1299 cells transfected with empty vector or pCIN4-p53 (15). Primers used for ChIP qPCR were SAT RE1 forward 5′-CAGTAGGGTTTCCGCCAAG-3′, SAT1 RE1 reverse 5′-AACCCGGAGGACAAAAGTG-3′; SAT RE2 forward 5′-TCCTGAGTTTGCTTCCCACT-3′, SAT1 RE2 reverse 5′-GGTGTGTCCCCCAGTAACAT-3′; SAT RE3 forward 5′-CACTGATTCTCAACTGCCAAA-3′, SAT1 RE3 reverse 5′-CAGAAGCAGAGGAGGAAAAGG-3′; SAT RE4 forward 5′-CAAAAGACCACCCCTCACAT-3′, SAT1 RE4 reverse 5′-CCTAGGGCAGGAAGGGTAAC-3′; and TIGAR forward 5′-CGGCAGGTCTTAGATAGCTT-3′, TIGAR reverse 5′-GGCAGCCGGCATCAAAAACA-3′.
Cell Death Count, Drugs, and Inhibitors.
Cells were trypsinized, collected, stained with trypan blue, and counted with a hemocytometer using the standard protocol. Cells stained blue under the microscope were considered dead cells. Nutlin (Sigma) was used in experiments at a concentration of 10 µM. The DNA-damaging agent Dox (Sigma) was used at 0.2 μg/mL. The ROS generator TBH (Sigma) was used at a concentration of 60 µM in H1299 cells, 350 µM in U2OS cells, and 150 µM in MEFs. Specific cell-death inhibitors were used in the experiments at the following concentrations: Z-VAD-fmk (caspase3 inhibitor; Sigma), 10 µg/mL; Necrostatin-1 (necroptosis inhibitor; Sigma), 10 µg/mL; Ferrostatin-1 (ferroptosis inhibitor; Xcess Biosciences), 2 µM; 3-MA (autophagy inhibitor; Sigma), 2 mM; and PD146176 (ALOX15 inhibitor; Sigma), 1 µM.
Analysis of ROS Production.
Cells were washed once with PBS containing Ca2+ and Mg2+ and then were incubated with PBS containing 2 µM C11-BODIPY(581/591) or 25 µM H2DCFDA (both from Invitrogen) at 37 °C for 30 min in a tissue culture incubator. Cells then were washed, harvested by trypsinization, and resuspended in 500 µL fresh PBS. ROS levels were analyzed using a Becton Dickinson FACSCalibur machine through the FL1 channel, and data were analyzed using CellQuest. Ten thousand cells were analyzed in each sample.
Mouse Xenograft.
SAT1 Tet-on stable H1299 cells were trypsinized and counted. Then 1.5 × 10⁶ cells were mixed with Matrigel (BD Biosciences) at a 1:1 (vol:vol) ratio and were injected s.c. into nude mice (NU/NU; Charles River). Mice were fed with either control food or food containing doxycycline hyclate (625 mg/kg) (Harlem). Four weeks after injection, mice were killed, and tumors were dissected from under the skin.
All procedures performed in this study were approved by the Institutional Animal Care and Use Committee at Columbia University.
Acknowledgments
This work was supported by the National Cancer Institute of the NIH under Awards 5R01CA172023, 5RO1CA085533, 5RO1CA190477, and 2P01CA080058 (to W.G.). S.-J.W. was partially supported by NIH Cancer Biology Training Grant T32-CA09503.
Footnotes
The authors declare no conflict of interest.
This article is a PNAS Direct Submission.
See Commentary on page 12350.
This article contains supporting information online at www.pnas.org/lookup/suppl/doi:10.1073/pnas.1607152113/-/DCSupplemental.
References
- 1.Vousden KH, Prives C. Blinded by the light: The growing complexity of p53. Cell. 2009;137(3):413–431. doi: 10.1016/j.cell.2009.04.037. [DOI] [PubMed] [Google Scholar]
- 2.Levine AJ, Oren M. The first 30 years of p53: Growing ever more complex. Nat Rev Cancer. 2009;9(10):749–758. doi: 10.1038/nrc2723. [DOI] [PMC free article] [PubMed] [Google Scholar]
- 3.Vogelstein B, Lane D, Levine AJ. Surfing the p53 network. Nature. 2000;408(6810):307–310. doi: 10.1038/35042675. [DOI] [PubMed] [Google Scholar]
- 4.Lane DP. Cancer. p53, guardian of the genome. Nature. 1992;358(6381):15–16. doi: 10.1038/358015a0. [DOI] [PubMed] [Google Scholar]
- 5.Donehower LA, et al. Mice deficient for p53 are developmentally normal but susceptible to spontaneous tumours. Nature. 1992;356(6366):215–221. doi: 10.1038/356215a0. [DOI] [PubMed] [Google Scholar]
- 6.Levine AJ. p53, the cellular gatekeeper for growth and division. Cell. 1997;88(3):323–331. doi: 10.1016/s0092-8674(00)81871-1. [DOI] [PubMed] [Google Scholar]
- 7.Vousden KH, Lu X. Live or let die: The cell’s response to p53. Nat Rev Cancer. 2002;2(8):594–604. doi: 10.1038/nrc864. [DOI] [PubMed] [Google Scholar]
- 8.Valente LJ, et al. p53 efficiently suppresses tumor development in the complete absence of its cell-cycle inhibitory and proapoptotic effectors p21, Puma, and Noxa. Cell Reports. 2013;3(5):1339–1345. doi: 10.1016/j.celrep.2013.04.012. [DOI] [PubMed] [Google Scholar]
- 9.Li T, et al. Tumor suppression in the absence of p53-mediated cell-cycle arrest, apoptosis, and senescence. Cell. 2012;149(6):1269–1283. doi: 10.1016/j.cell.2012.04.026. [DOI] [PMC free article] [PubMed] [Google Scholar]
- 10.Berkers CR, Maddocks OD, Cheung EC, Mor I, Vousden KH. Metabolic regulation by p53 family members. Cell Metab. 2013;18(5):617–633. doi: 10.1016/j.cmet.2013.06.019. [DOI] [PMC free article] [PubMed] [Google Scholar]
- 11.Jiang L, et al. Ferroptosis as a p53-mediated activity during tumour suppression. Nature. 2015;520(7545):57–62. doi: 10.1038/nature14344. [DOI] [PMC free article] [PubMed] [Google Scholar]
- 12.Hsu PP, Sabatini DM. Cancer cell metabolism: Warburg and beyond. Cell. 2008;134(5):703–707. doi: 10.1016/j.cell.2008.08.021. [DOI] [PubMed] [Google Scholar]
- 13.Ward PS, Thompson CB. Metabolic reprogramming: A cancer hallmark even warburg did not anticipate. Cancer Cell. 2012;21(3):297–308. doi: 10.1016/j.ccr.2012.02.014. [DOI] [PMC free article] [PubMed] [Google Scholar]
- 14.Bensaad K, et al. TIGAR, a p53-inducible regulator of glycolysis and apoptosis. Cell. 2006;126(1):107–120. doi: 10.1016/j.cell.2006.05.036. [DOI] [PubMed] [Google Scholar]
- 15.Ou Y, Wang SJ, Jiang L, Zheng B, Gu W. p53 Protein-mediated regulation of phosphoglycerate dehydrogenase (PHGDH) is crucial for the apoptotic response upon serine starvation. J Biol Chem. 2015;290(1):457–466. doi: 10.1074/jbc.M114.616359. [DOI] [PMC free article] [PubMed] [Google Scholar]
- 16.Schwartzenberg-Bar-Yoseph F, Armoni M, Karnieli E. The tumor suppressor p53 down-regulates glucose transporters GLUT1 and GLUT4 gene expression. Cancer Res. 2004;64(7):2627–2633. doi: 10.1158/0008-5472.can-03-0846. [DOI] [PubMed] [Google Scholar]
- 17.Hu W, et al. Glutaminase 2, a novel p53 target gene regulating energy metabolism and antioxidant function. Proc Natl Acad Sci USA. 2010;107(16):7455–7460. doi: 10.1073/pnas.1001006107. [DOI] [PMC free article] [PubMed] [Google Scholar]
- 18.Suzuki S, et al. Phosphate-activated glutaminase (GLS2), a p53-inducible regulator of glutamine metabolism and reactive oxygen species. Proc Natl Acad Sci USA. 2010;107(16):7461–7466. doi: 10.1073/pnas.1002459107. [DOI] [PMC free article] [PubMed] [Google Scholar]
- 19.Cheung EC, et al. TIGAR is required for efficient intestinal regeneration and tumorigenesis. Dev Cell. 2013;25(5):463–477. doi: 10.1016/j.devcel.2013.05.001. [DOI] [PMC free article] [PubMed] [Google Scholar]
- 20.Dixon SJ, et al. Ferroptosis: An iron-dependent form of nonapoptotic cell death. Cell. 2012;149(5):1060–1072. doi: 10.1016/j.cell.2012.03.042. [DOI] [PMC free article] [PubMed] [Google Scholar]
- 21.Vassilev LT, et al. In vivo activation of the p53 pathway by small-molecule antagonists of MDM2. Science. 2004;303(5659):844–848. doi: 10.1126/science.1092472. [DOI] [PubMed] [Google Scholar]
- 22.Gerner EW, Meyskens FL., Jr Polyamines and cancer: Old molecules, new understanding. Nat Rev Cancer. 2004;4(10):781–792. doi: 10.1038/nrc1454. [DOI] [PubMed] [Google Scholar]
- 23.Casero RA, Jr, Marton LJ. Targeting polyamine metabolism and function in cancer and other hyperproliferative diseases. Nat Rev Drug Discov. 2007;6(5):373–390. doi: 10.1038/nrd2243. [DOI] [PubMed] [Google Scholar]
- 24.Scuoppo C, et al. A tumour suppressor network relying on the polyamine-hypusine axis. Nature. 2012;487(7406):244–248. doi: 10.1038/nature11126. [DOI] [PMC free article] [PubMed] [Google Scholar]
- 25.Marton LJ, Pegg AE. Polyamines as targets for therapeutic intervention. Annu Rev Pharmacol Toxicol. 1995;35:55–91. doi: 10.1146/annurev.pa.35.040195.000415. [DOI] [PubMed] [Google Scholar]
- 26.Pegg AE. Spermidine/spermine-N(1)-acetyltransferase: A key metabolic regulator. Am J Physiol Endocrinol Metab. 2008;294(6):E995–E1010. doi: 10.1152/ajpendo.90217.2008. [DOI] [PubMed] [Google Scholar]
- 27.Mandal S, Mandal A, Johansson HE, Orjalo AV, Park MH. Depletion of cellular polyamines, spermidine and spermine, causes a total arrest in translation and growth in mammalian cells. Proc Natl Acad Sci USA. 2013;110(6):2169–2174. doi: 10.1073/pnas.1219002110. [DOI] [PMC free article] [PubMed] [Google Scholar]
- 28.Creaven PJ, et al. Unusual central nervous system toxicity in a phase I study of N1N11 diethylnorspermine in patients with advanced malignancy. Invest New Drugs. 1997;15(3):227–234. doi: 10.1023/a:1005827231849. [DOI] [PubMed] [Google Scholar]
- 29.Streiff RR, Bender JF. Phase 1 study of N1-N11-diethylnorspermine (DENSPM) administered TID for 6 days in patients with advanced malignancies. Invest New Drugs. 2001;19(1):29–39. doi: 10.1023/a:1006448516938. [DOI] [PubMed] [Google Scholar]
- 30.Hahm HA, et al. Phase I study of N(1),N(11)-diethylnorspermine in patients with non-small cell lung cancer. Clin Cancer Res. 2002;8(3):684–690. [PubMed] [Google Scholar]
- 31.Wolff AC, et al. A phase II study of the polyamine analog N1,N11-diethylnorspermine (DENSpm) daily for five days every 21 days in patients with previously treated metastatic breast cancer. Clin Cancer Res. 2003;9(16 Pt 1):5922–5928. [PubMed] [Google Scholar]
- 32.Kubbutat MHG, Vousden KH. Keeping an old friend under control: Regulation of p53 stability. Mol Med Today. 1998;4(6):250–256. doi: 10.1016/s1357-4310(98)01260-x. [DOI] [PubMed] [Google Scholar]
- 33.Ha HC, et al. The natural polyamine spermine functions directly as a free radical scavenger. Proc Natl Acad Sci USA. 1998;95(19):11140–11145. doi: 10.1073/pnas.95.19.11140. [DOI] [PMC free article] [PubMed] [Google Scholar]
- 34.Pottosin I, et al. Cross-talk between reactive oxygen species and polyamines in regulation of ion transport across the plasma membrane: Implications for plant adaptive responses. J Exp Bot. 2014;65(5):1271–1283. doi: 10.1093/jxb/ert423. [DOI] [PubMed] [Google Scholar]
- 35.Zahedi K, et al. Hepatocyte-specific ablation of spermine/spermidine-N1-acetyltransferase gene reduces the severity of CCl4-induced acute liver injury. Am J Physiol Gastrointest Liver Physiol. 2012;303(5):G546–G560. doi: 10.1152/ajpgi.00431.2011. [DOI] [PMC free article] [PubMed] [Google Scholar]
- 36.Wang Z, Jiang H, Chen S, Du F, Wang X. The mitochondrial phosphatase PGAM5 functions at the convergence point of multiple necrotic death pathways. Cell. 2012;148(1-2):228–243. doi: 10.1016/j.cell.2011.11.030. [DOI] [PubMed] [Google Scholar]
- 37.Yang WS, et al. Regulation of ferroptotic cancer cell death by GPX4. Cell. 2014;156(1-2):317–331. doi: 10.1016/j.cell.2013.12.010. [DOI] [PMC free article] [PubMed] [Google Scholar]
- 38.Hobbs CA, Paul BA, Gilmour SK. Deregulation of polyamine biosynthesis alters intrinsic histone acetyltransferase and deacetylase activities in murine skin and tumors. Cancer Res. 2002;62(1):67–74. [PubMed] [Google Scholar]
- 39.Hobbs CA, Gilmour SK. High levels of intracellular polyamines promote histone acetyltransferase activity resulting in chromatin hyperacetylation. J Cell Biochem. 2000;77(3):345–360. [PubMed] [Google Scholar]
- 40.Seiler A, et al. Glutathione peroxidase 4 senses and translates oxidative stress into 12/15-lipoxygenase dependent- and AIF-mediated cell death. Cell Metab. 2008;8(3):237–248. doi: 10.1016/j.cmet.2008.07.005. [DOI] [PubMed] [Google Scholar]
- 41.Sendobry SM, et al. Attenuation of diet-induced atherosclerosis in rabbits with a highly selective 15-lipoxygenase inhibitor lacking significant antioxidant properties. Br J Pharmacol. 1997;120(7):1199–1206. doi: 10.1038/sj.bjp.0701007. [DOI] [PMC free article] [PubMed] [Google Scholar]
- 42.Maxwell PJ, et al. Identification of 5-fluorouracil-inducible target genes using cDNA microarray profiling. Cancer Res. 2003;63(15):4602–4606. [PubMed] [Google Scholar]
- 43.Tian Y, et al. Overexpression of SSAT by DENSPM treatment induces cell detachment and apoptosis in glioblastoma. Oncol Rep. 2012;27(4):1227–1232. doi: 10.3892/or.2011.1592. [DOI] [PMC free article] [PubMed] [Google Scholar]


