Abstract
Lateral flow immunochromatographic rapid diagnostic tests (RDTs) are the primary form of medical diagnostic used for malaria in underdeveloped nations. Unfortunately, many of these tests do not detect asymptomatic malaria carriers. In order for eradication of the disease to be achieved, this problem must be solved. In this study, we demonstrate enhancement in the performance of six RDT brands when a simple sample-processing step is added to the front of the diagnostic process. Greater than a 4-fold RDT signal enhancement was observed as a result of the sample processing step. This lowered the limit of detection for RDT brands to submicroscopic parasitemias. For the best performing RDTs the limits of detection were found to be as low as 3 parasites/μL. Finally, through individual donor samples, the correlations between donor source, WHO panel detection scores and RDT signal intensities were explored.
Introduction
The advent of point of care (POC) diagnostic tools has changed the face of healthcare in nations affected by the ongoing spread of infectious diseases.1 These underdeveloped, remote areas are often characterized by poverty, absent or intermittent electricity, hot and humid environmental conditions as well as a lack of skilled clinicians. Molecular based diagnostic methods such as enzyme immunoassays (ELISA) and quantitative polymerase chain reaction (qPCR) are powerful tools for the detection of protein and nucleic acid biomarkers of infectious diseases, but reagent instability and cost of these assays in addition to time and expertise needed to perform the test limits their use in underdeveloped areas.2 Light microscopy is currently the gold standard for blood-borne disease detection, but intermittent access to functional microscopes and trained microscopists prevents its widespread use at the point of care. Lateral flow immunochromatographic rapid diagnostic tests (RDTs), which operate much like a commercial pregnancy test, were developed to circumvent these challenges and bring affordable disease diagnosis to low-resource areas.3, 4 Several advantages of RDTs include low-cost, rapid time to result, and ease of use and interpretability.5 Additionally, these tests have been widely used in public health programs to aid with patient management, disease surveillance and treatment campaigns.6 In 2006, over 16 million RDTs were delivered to underdeveloped nations for the detection of malaria alone.3 These RDTs detect protein biomarkers of the malarial parasite. The predominant RDT biomarker indicative of Plasmodium falciparum infection is Histidine Rich Protein II (pfHRPII), while Plasmodium Lactate Dehydrogenase (pLDH) serves as a pan-specific biomarker.3
Despite the many advantages of RDTs, the changing climate of infectious disease education, prevention, and treatment has highlighted the need for improved tests. The World Health Organization (WHO) periodically reviews all malaria RDTs manufactured for diagnostic use, and sets the limit of detection for these tests at 200 parasites/μL.7 While this limit of detection is sufficient for the diagnosis of symptomatic malaria infection many asymptomatic patients are not diagnosed and continue to be transmission reservoirs of the disease because current RDTs fail to identify these asymptomatic carriers. Additionally, poor manufacturing standards and storage conditions render many brands of malaria RDTs inoperable and unreliable.8 There are an estimated 60 brands and 200 types of tests manufactured for the detection of malaria, and according to the WHO, less than 10% of those tests are effective at detecting 200 parasites/μL parasite densities.7 Unfortunately, tests are often acquired based on government sanctions, history of use, and cost instead of acquisition based on reliability of the brand.9 This variability in test performance, sensitivity and reliability undermines the progress made in malaria disease prevention.10
We have recently reported the development of a low-resource extraction cassette that can extract, purify and concentrate the most common malarial biomarker, Plasmodium falciparum Histidine Rich Protein II (pfHRPII), from a blood sample, in less than 30 minutes.11 In this study, a series of aqueous buffer solutions separated by oil surface tension valves were preloaded into a single length of tubing. We were able to purify the protein biomarker from blood by processing biomarker bound magnetic particles through the cassette using a handheld magnet. At least 50% extraction efficiency was demonstrated for samples with parasitemias as low as 12.5 parasites/μL and, as a result of this technique, a commercial RDT brand was qualitatively improved over 8-fold. In our current study, we describe the utility of this extraction cassette for the improvement of a wide range of RDT brands of variable performance. Additionally, this improvement is quantitated at parasitemias below the 200 parasites/μL regime. Finally, we describe the effect of individual donor samples on low, medium and high performing RDT brands at various parasite loads.
Experimental
Materials
Both pooled and individual donor human whole blood in citrate phosphate dextrose (Cat # HMWBCPD) were purchased from Bioreclamation LLC. For the enhancement study pooled blood was used. For the individual donor effect study, individual donor blood was used as shown in ESI Table 1†. This study was blinded, as we did not know the identity of the donors. Plasmodium falciparum D6 strain was cultured in the lab. Tygon tubing was purchased from McMaster Carr (Cat # ACF00002). Ni-NTA Magnetic Agarose Beads (Cat # 36113) were purchased from Qiagen Inc. Donut magnet used in this study was purchased from Emovendo LCC. Paracheck (Pck), ParaHit Dipstick (PDip), ParaHit Total (PTot), ICT Pf (IPf), ICT Dual (IDual) and Blue Cross One Step Pf (OsPf) rapid diagnostic tests were acquired from their respective manufacturers. (ESI Table 2†). Hewlett Packard Color LaserJet CM3530fs MFP scanner was used to image the RDTs. Image J software was downloaded from the National Institute of Health website (http://rsbweb.nih.gov/ij/). OriginPro 9.0 Software was employed for RDT analysis. The remaining products were purchased from either Fisher Scientific or Sigma Aldrich.
Blood Sample Preparation
Human whole blood samples were combined in 1:1 (v:v) ratio with 2X lysis buffer (100 mM potassium phosphate pH = 8.0, 600 mM NaCl, 250 mM imidazole, 2% Triton X-100). Subsequently, the blood sample was filtered through glass wool that was placed in the bottom of a plastic syringe. Following filtration, a 200 parasite/μL stock blood sample was made by adding a specific amount of D6 P. falciparum culture (at ~52000 parasites/μL) to the lysed and filtered sample. The remaining parasitemias were achieved by serial dilution of the 200 parasites/μL stock. For the mimic patient study, this process was modified slightly in that the specific amount P. falciparum culture required for the desired parasitemia was spiked into the sample before filtration. Thus, the samples were prepared individually without dilution.
Extraction and Analysis with RDTs
Extraction devices were constructed and prepared blood samples were purified and concentrated as described previously.11 Briefly, a 9-inch piece of Tygon tubing was injected with three 100 μL wash chambers (50 mM PB, pH 8.0, 300 mM NaCl, 125 mM imidazole, and 0.05% Tween-20) each separated by a 0.25 μL mineral oil valve. An elution chamber consisting of 10 μL of elution buffer (50 mM potassium phosphate (PB), pH 8.0, 300 mM NaCl, 500 mM imidazole, 0.05% Tween-20) was injected at the end of the tube. One end of the Tygon tube was blocked with a capillary tube and a PCR tube was placed on the other end as the sample chamber. 200 μL of the blood sample were placed into this chamber with 10 μL of Ni-NTA magnetic agarose beads. After incubation in the chamber, the beads were pulled through the wash chambers into the elution chamber with a magnet. After incubating in the elution chamber the beads were pulled back into the adjacent oil valve. The elution chamber was then cut off with a razor and the contents were spotted onto an RDT. In the enhancement study, this process was done, in triplicate, on six types of RDTs, at six parasitemias (0, 12.5, 25, 50, 100 and 200 parasites/μL). For the individual donor effect study, the process was done in triplicate for three parasitemias (0, 10 and 100 parasites/μL) with each donor sample, on three RDT brands, PTot, IPf and Pck, of low to high performance, respectively, based on the WHO report. For both studies, standard analysis of the blood samples that were not extracted consisted of spotting 5 μL of parasite spiked blood sample directly onto the RDT and processing according to manufacturer’s specifications. These unextracted samples served as reference standards.
Image Analysis
The process used for analysis of the RDTs is outlined in Scheme 1. To begin the image analysis portion of this workflow the immunochromatographic test strip, housed within the plastic cassette of the RDT, was removed. The absorption pad at the end of the strip was detached to aid in the drying of the strip. The strips were dried overnight prior to imaging with a Hewlett Packard Color LaserJet CM3530fs MFP scanner. This drying step did not affect peak signal over time (data not shown). Specific settings were used (darkness = 8, background = 1, sharpness = 4) and the highest image quality was selected. The image was then manipulated in Image J. First, the image was inverted. This is a processing step commonly performed in RDT reader algorithms to present the data in an intuitive manner.12 Secondly, the background was subtracted (rolling ball radius = 15 pixels, smoothing disabled). Once this was accomplished, a plot profile containing the test and control line was generated. This profile was imported into Origin® software, where the peak in the plot profile associated with the test line was integrated using the Peak Analysis tool. When using this tool, the automatic background line was used. A test was considered positive if the height of the test line peak on the plot profile was at least 3% of the control peak. Peak width was determined manually by the user, and the result of the integration was generated by the software. This result was used to quantitate the intensity of the test line in the form of an integrated area.
Scheme 1.
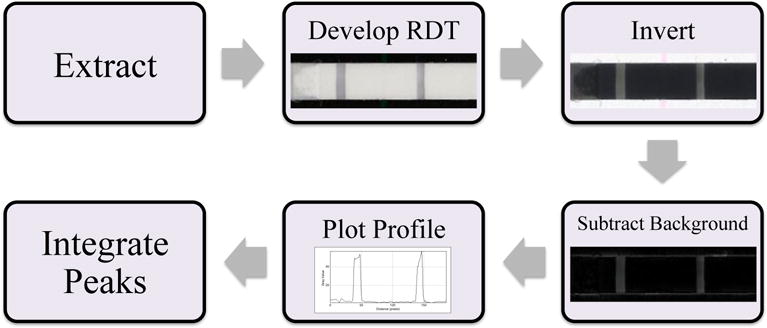
The workflow used to quantitate the RDT signals.
Results
Enhancement in RDT Performance
The effect of sample preprocessing on RDT performance can be seen in Fig. 1. This analysis showed five of the six RDT brands tested were able to detect 200 parasites/μL from an unextracted sample. Four brands detected 100 parasites/μL, as compared to only two at 50 parasites/μL. Only IDual detected unextracted samples at 25 and 12.5 parasites/μL. After extraction, all brands were improved to detect parasite concentrations of 12.5 parasites/μL and higher, with the exception of OsPf. However, as is shown in ESI Fig. 1†, the control line was missing on random tests from one lot (Lot #10006) of IPf RDTs. Upon switching to a new lot, this issue was resolved.
Fig. 1.
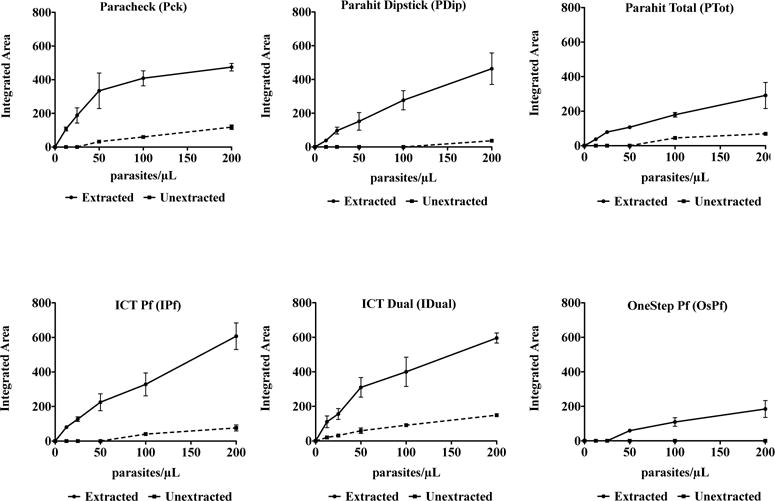
Integrated area of the RDT signal as a function of parasitemia, extraction and RDT brand. Curves for extracted (black lines) and unextracted (dashed line) samples are shown and the signal increase gained from extraction can be seen. The diagnostic threshold for all tests analyzed was 200 parasites/μL, as set by the World Health Organization.
To quantitate performance, the lateral flow strips within each cassette for all brands were scanned and the corresponding plot profiles analyzed using peak integration software. Analysis methods of this type are common in recently developed RDT readers.12 The degree of enhancement in RDT signal that occurs with extraction of the sample (enhancement factor) was calculated for 200 parasites/μL by the following relationship:
(ESI Fig. 2†) This enhancement factor ranged from 4 to 13 among the five brands that produced a detectable signal at 200 parasites/μL unextracted. For OsPf, the enhancement was practically infinite, as the unextracted sample was not detected at 200 parasites/μL (Fig. 2).
Fig. 2.
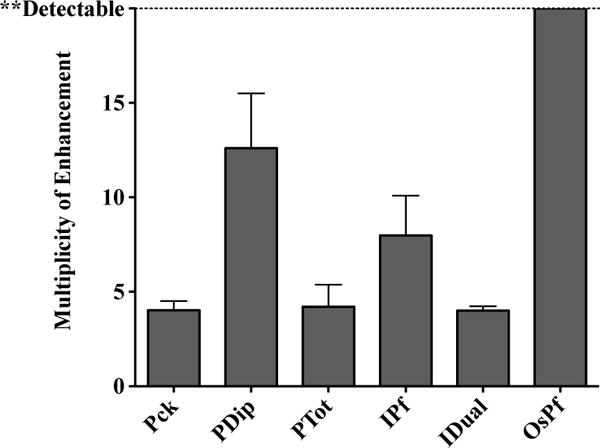
The multiplicity of enhancement observed at 200 parasites/μL for each RDT brand, as a result of extraction.
Limit of Detection of Enhanced RDT Signal
Given the nature of the algorithm used to detect the peaks on the scanned RDT image, the smallest detectable signal was found as a percentage of the control peak (threshold height). For each brand tested, the integrated area for all of the control lines analyzed were averaged and converted to the 3% threshold height maximum. Given this threshold height, the LOD was found for extracted and unextracted samples of each brand (ESI Fig. 3†). Both Pck and IDual had LODs of 3 parasites/μL after extraction (Table 1). Additionally, a sensitivity enhancement factor was calculated by taking the ratio between the LODs for RDTs run with unextracted and extracted samples. This value ranged from a 4-fold to 13-fold enhancement in sensitivity. The sensitivity enhancement factor could not be calculated for OsPf because this brand did not flag within the parasitemias tested (ESI Fig. 4†).
Table 1.
Limit of detection (in parasites/μL) for all brands of RDTs tested with unextracted and extracted samples.
| Unextracted | Extracted | |
|---|---|---|
| Paracheck (Pck) | 21.7 ± 7.4 | 3 ± 0.2 |
| Parahit Dipstick (PDip) | 143.7 ± 39.5 | 10.7 ± 0.9 |
| Parahit Total (PTot) | 70.2 ± 12.4 | 17.3 ± 1.5 |
| ICT Pf (IPf) | 51.1 ± 7.9 | 5.6 ± 0.8 |
| ICT Dual (IDual) | 15 ± 1 | 2.9 ± 0.2 |
| One Step Pf (OsPf) | ND | 32.6 ± 4.5 |
Effect of Individual Donor Samples on RDT Performance
To focus the study on the correlation between donor source and WHO panel detection score (PDS) and the RDT signal intensity, three RDT brands of low, medium and high performance were selected. The performance of each RDT brand is based on the WHO PDS which is established by the RDT brand’s inter-test and inter-lot consistency.7 The three brands were selected by their WHO PDS and Pck fell in the high (>90%), IPf in the medium (50–90%) and PTot in the low (10–40%) range. These three brands were tested with unextracted and extracted samples at 0, 10 and 100 parasites/μL to demonstrate their utility at low parasitemias. As can be observed in Fig. 3, the extracted donor samples at 100 parasites/μL had average signal intensities that were statistically different among brands and trended with their respective PDS. The highest signal intensities for the extracted samples were observed for Pck, which had a PDS of 96.0%. Signal intensity decreased for IPf followed by PTot, whose detection scores were 86.9% and 35.4%, respectively.
Fig. 3.
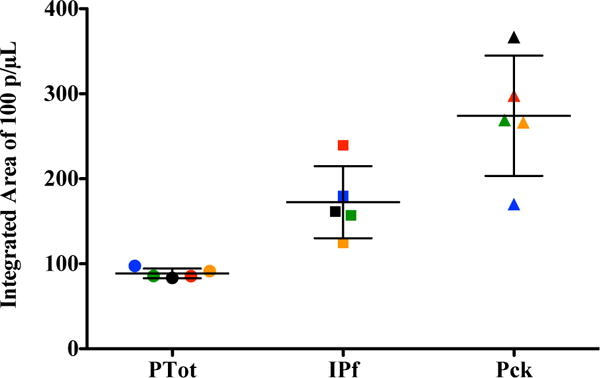
Quantitative performance of three RDT brands for 100 parasites/μL extracted samples. Five blood donor samples were analyzed. Donor 1 (red), Donor 2 (green), Donor 3 (yellow), Donor 4 (black), Donor 5 (blue). The WHO panel detection scores for Parahit Total (PTot), ICT Pf (IPf) and Paracheck (Pck) are 35.4%, 86.9% and 96.0%, respectively.
In Fig. 4 it can be seen that when unextracted donor samples were applied to Pck, 5/5 were detected at 100 parasites/μL, while 0/5 were detected at 10 parasites/μL. When extracted donor samples were applied to Pck, 5/5 were detected at 100 and 10 parasites/μL. When unextracted donor samples were applied to IPf 3/5 were detected at 100 parasite/μL and 0/5 were detected 10 parasites/μL. When extracted donor samples were applied to IPf, 5/5 were detected at 100 parasites/μL and 4/5 were detected at 10 parasites/μL. When unextracted donor samples were applied to PTot 0/5 were detected at 100 and 10 parasites/μL. When extracted donor samples were applied to PTot 5/5, were detected at 100 parasites/μL and 0/5 were detected at 10 parasties/uL. A 4 to 5-fold difference in signal intensity between the 10 and 100 parasites/μL extracted samples for Pck and IPf was observed. Generally, all samples of the same parasitemia, analyzed by the same RDT brand, experienced similar enhancements, which seems to point to no individual donor sample effect on the signal.
Fig. 4.

Plots of the average peak areas from the RDT test lines for each surrogate patient sample, extracted and unextracted, at all parasitemias. Donor 1 (red), Donor 2 (green), Donor 3 (yellow), Donor 4 (black), Donor 5 (blue).
Discussion
The advent and implementation of rapid diagnostic tests have made an invaluable impact on the diagnosis and treatment of infectious diseases in third world countries. The efficacy of these tests at high parasitemia was demonstrated in this study, as all RDT brands analyzed were found to produce detectable signal given unextracted samples at a parasite density of 2000 parasites/μL (ESI Fig. 5†). But as discussions about eradication strategies begin in earnest, the challenge becomes how to effectively identify the untreated asymptomatic patient reservoir. Management of submicroscopic malarial infections has become a challenge in the field, as current rapid diagnostics are unable to detect these patients.13–15 Thus, for this study we set our desired detection limit to less than 20 parasites/μL as this will allow for detection of parasite at submicroscopic levels and lead to the diagnosis of more asymptomatic infections.13 We have reached these detection limits through modification of the current RDT diagnostic process, which has allowed our method to be simple, rapid and affordable. The RDT diagnostic process was modified by adding a simple sample preparation step which consists of a self-contained extraction device that purifies and concentrates the malaria biomarker pfHRPII. In order to choose the RDT brands to be evaluated in this study, the WHO report on the performance of all manufactured malaria RDTs was consulted. Given this report, we selected a range of RDT brands representative of low, medium and high performing tests (ESI Table 2†). Because of the nature of our extraction device, we hypothesized that we could improve these tests, regardless of WHO PDS, by application of a small volume of concentrated, purified pfHRPII. Improvement in test performance was benchmarked on changes in the signal intensity of the pfHRPII test line. Analysis of RDT signal as a function of parasitemia from 12.5 to 200 parasites/μL generally pointed to an enhancement in test performance after sample processing as compared to an unextracted sample. Despite the observed enhancement, visual and pixel analysis of the tested brands revealed several brand-to-brand discrepancies. The most noted was in the case of OsPf, where smearing of the sample and RDT components on the test strip increased the background, preventing detection of low parasitemias in this brand (ESI Fig. 6†). This failure of the test strip to clear the sample and reagents prevented proper development of the test line and peak identification. Other brand-to-brand differences were observed by comparing the shape of the titration curves. Pck reached saturation in signal intensity after 100 parasites/μL, whereas PTot and IPf remained linear through 200 parasites/μL, where our analysis stopped (Fig. 5). These differing trends suggest a greater concentration of active antibody on the test line of IPf and PTot RDTs, thus providing a wider linear range for calculations made through our algorithm.
Fig. 5.
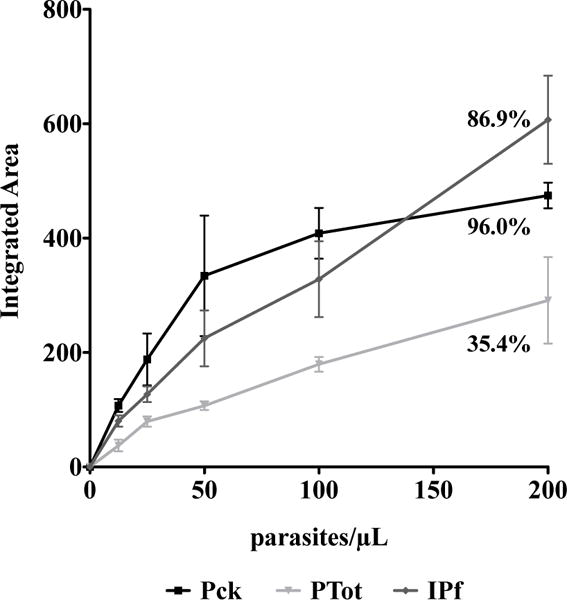
Comparison of the titration curves for three of the RDT brands used for the study on the effect of individual donor samples, which show differences in brand performance. The WHO panel detection score for each brand tested is indicated on the graph.
The multiplicity of enhancement in signal intensity achieved by the extraction of the blood samples was found by comparison of the signal intensity of unextracted and extracted samples at 200 parasites/μL. A minimum 4-fold enhancement was achieved for all tests (Fig. 2). The greatest enhancement was observed for those tests that gave minimal or undetectable results when the samples were unextracted (ie. PDip and OsPf). The limits of detection were calculated for all of the RDT brands and the enhancement in limits of detection for the various RDT brands followed the same trend as observed for signal enhancement at 200 parasites/μL (ESI Fig. 4†). According to the WHO, the limit of detection for malaria RDTs is required to be at least 200 parasites/μL.7 We found five out of six of these brands to have limits of detection ranging from 15–150 parasites/μL given an unextracted sample. OsPf did not detect unextracted samples within the LOD recommended by the WHO. When samples were extracted, the limits of detection were found to be between 3–33 parasites/μL (Table 1). Of the six brands tested, five were enhanced to detect below the set detection limit of 20 parasites/μL, which is representative of asymptomatic and submicroscopic levels of malaria infection. IDual was the only brand tested that was able to detect at this level before extraction. To our knowledge, no previously developed method for RDT analysis has allowed for the detection of such low parasitemias.
After quantifying the LOD of these brands, we focused the study to three brands (Pck, PTot and IPf) analyzing individual donor blood samples to examine the influence of individual donor background. It was found that test performance at 10 and 100 parasites/μL was not affected by individual blood donors for the three brands evaluated (Fig. 4). Thus, any variations in signal intensity of a given RDT observed for samples with the same preparation and parasitemia were attributed to manufacturing and brand differences. The data collected from this portion of the study was also used to observe trends in RDT performance. An increase in integrated peak area from PDip to IPf to Pck was found to correspond to an increase in signal intensity between these brands. This increase in signal followed the trend in the increasing PDS reported by the WHO for these RDT brands (Fig. 3). Although the signals of low and medium performing tests were not enhanced to that of high performing test, enhancement in overall performance was observed across the range of the panel detection scores. Analysis of these three RDT brands also showed that sample extraction reduced the incidence of false negative test results. For example, in the case of IPf, at 100 parasites/μL, only 3/5 of the unextracted donor samples were detected but upon extraction 5/5 of the donor samples produced detectable signals (Fig. 4). The inclusion of the extraction step makes seemingly bad RDTs work better, by increasing signal and thus reducing false negatives and could be invaluable to malaria management programs to enhance the performance of brands available for use.
Conclusion
We have described a method of improving existing rapid diagnostic tests for the detection of malaria by adding a simple sample preparation step prior to performing the test. Regardless of the panel detection scores assigned to the selected brands by the World Health Organization, we found five of six brands were improved and detected parasitemia within submicroscopic levels of infection–a regime of diagnosis that RDTs have traditionally been unable to detect. Both the visual signal and limit of detection gained a 4-fold and in some cases 100-fold enhancement. Limits of detection, after extraction, were estimated to be as low as 3 parasites/μL for two brands. Several labs are currently developing cell phone RDT readers, which use an algorithm similar to that described here to convert the visual test signal to a quantitative one.12, 16, 17 By combining our extraction technology with these developing resources, the positive impact of RDTs for malaria control could become an important tool for diagnosing symptomatic and asymptomatic carriers. With these advances in RDT technology, rapid, affordable, point-of-care diagnostics will continue to be at the forefront of malaria eradication efforts in underdeveloped nations.
Supplementary Material
Acknowledgments
Partial support for this work was provided by the Bill and Melinda Gates Foundation Grand Challenges in Global Health: Develop Technologies that Allow Assessment of Multiple Conditions and Pathogens at Point-of-Care. Additional support was provided through the Vanderbilt-Zambia Network for Innovations in Global Health Technologies (NIH D43 TW009348). Support for KMD was provided by an NSF Graduate Research Fellowship (GRFP2012095464). We thank M.F. Richards for critical comments concerning this manuscript. We thank Dr. Phil Thuma and Dr. Sungano Mharakurwa for their support in this work.
Footnotes
Electronic Supplementary Information (ESI) available: [Additional RDT information and enhancement data]. See DOI: 10.1039/b000000x/
Notes and references
- 1.Yager P, Domingo GJ, Gerdes J. Annual Review of Biomedical Engineering. 2008;10:107–144. doi: 10.1146/annurev.bioeng.10.061807.160524. [DOI] [PubMed] [Google Scholar]
- 2.Tangpukdee N, Duangdee C, Wilairatana P, Krudsood S. Korean J Parasitol. 2009;47:93–102. doi: 10.3347/kjp.2009.47.2.93. [DOI] [PMC free article] [PubMed] [Google Scholar]
- 3.Murray CK, Bennett JW. Interdisciplinary Perspectives on Infectious Diseases. 2009;2009 doi: 10.1155/2009/415953. [DOI] [PMC free article] [PubMed] [Google Scholar]
- 4.Murray CK, Gasser RA, Magill AJ, Miller RS. Clinical Microbiology Reviews. 2008;21:97–110. doi: 10.1128/CMR.00035-07. [DOI] [PMC free article] [PubMed] [Google Scholar]
- 5.Bell D, Peeling RW. Nature Reviews Microbiology. 2006;4:S34. doi: 10.1038/nrmicro1524. [DOI] [PubMed] [Google Scholar]
- 6.Bell D, Perkins M. In: Treatment and Prevention of Malaria. Staines HM, Krishna S, editors. Springer; Basel: 2012. pp. 293–307. ch. 15. [Google Scholar]
- 7.Malaria Rapid Diagnostic Test Performance: Results of WHO product testing of malaria RDTs- Round 3. World Health Organization; 2011. [Google Scholar]
- 8.Wongsrichanalai C, Barcus MJ, Muth S, Sutamihardja A, Wernsdorfer WH. The American Journal of Tropical Medicine and Hygiene. 2007;77:119–127. [PubMed] [Google Scholar]
- 9.Bell D, Wongsrichanalai C, Barnwell JW. Nat Rev Micro. 2006;4:682–695. doi: 10.1038/nrmicro1474. [DOI] [PubMed] [Google Scholar]
- 10.Gubala V, Harris LF, Ricco AJ, Tan MX, Williams DE. Analytical Chemistry. 2011;84:487–515. doi: 10.1021/ac2030199. [DOI] [PubMed] [Google Scholar]
- 11.Davis KM, Swartz JD, Haselton FR, Wright DW. Analytical Chemistry. 2012;84:6136–6142. doi: 10.1021/ac301030m. [DOI] [PubMed] [Google Scholar]
- 12.Mudanyali O, Dimitrov S, Sikora U, Padmanabhan S, Navruz I, Ozcan A. Lab on a Chip. 2012;12:2678–2686. doi: 10.1039/c2lc40235a. [DOI] [PMC free article] [PubMed] [Google Scholar]
- 13.Okell LC, Bousema T, Griffin JT, Ouedraogo AL, Ghani AC, Drakeley CJ. Nat Commun. 2012;3:1237. doi: 10.1038/ncomms2241. [DOI] [PMC free article] [PubMed] [Google Scholar]
- 14.Sturrock HJW, Hsiang MS, Cohen JM, Smith DL, Greenhouse B, Bousema T, Gosling RD. PLoS Med. 2013;10:e1001467. doi: 10.1371/journal.pmed.1001467. [DOI] [PMC free article] [PubMed] [Google Scholar]
- 15.Laishram D, Sutton P, Nanda N, Sharma V, Sobti R, Carlton J, Joshi H. Malaria Journal. 2012;11:29. doi: 10.1186/1475-2875-11-29. [DOI] [PMC free article] [PubMed] [Google Scholar]
- 16.Shekalaghe S, Cancino M, Mavere C, Juma O, Mohammed A, Abdulla S, Ferro S. Malaria Journal. 2013;12:141. doi: 10.1186/1475-2875-12-141. [DOI] [PMC free article] [PubMed] [Google Scholar]
- 17.Feng S, Caire R, Cortazar B, Turan M, Wong A, Ozcan A. ACS Nano. 2014;8:3069–3079. doi: 10.1021/nn500614k. [DOI] [PMC free article] [PubMed] [Google Scholar]
Associated Data
This section collects any data citations, data availability statements, or supplementary materials included in this article.


