Abstract
Objectives
The objective of this study is to evaluate the minimum microbubble dose for ultrasound molecular imaging to achieve statistically significant detection of angiogenesis in a mouse model.
Materials and Methods
The pre-burst minus post-burst method was implemented on a Verasonics ultrasound research scanner using a multi-frame compounding pulse inversion imaging sequence. Biotinylated lipid (distearoyl phosphatidylcholine, DSPC-based) microbubbles that were conjugated with anti-vascular endothelial growth factor 2 (VEGFR2) antibody (MBVEGFR2) or isotype control antibody (MBControl) were injected into mice carrying adenocarcinoma xenografts. Different injection doses ranging from 5 × 10⁴ to 1 × 10⁷ microbubbles per mouse were evaluated to determine the minimum diagnostically effective dose.
Results
The proposed imaging sequence was able to achieve statistically significant detection (p < 0.05, n = 5) of VEGFR2 in tumors with a minimum MBVEGFR2 injection dose of only 5 × 10⁴ microbubbles per mouse (DSPC at 0.053 ng/g mouse body mass). Non-specific adhesion of MBControl at the same injection dose was negligible. Additionally, the targeted contrast ultrasound signal of MBVEGFR2 decreased with lower microbubble doses, while non-specific adhesion of MBControl increased with higher microbubble doses.
Conclusions
5 × 10⁴ microbubbles per animal is now the lowest injection dose on record for ultrasound molecular imaging to achieve statistically significant detection of molecular targets in vivo. Findings in this study provide us with further guidance for future developments of clinically translatable ultrasound molecular imaging applications using a lower dose of microbubbles.
Keywords: Ultrasound molecular imaging, targeted microbubbles, tumor angiogenesis imaging, low-dose contrast agent, detection sensitivity
Introduction
Ultrasound molecular imaging has been implemented for a number of pre-clinical applications including the detection of cancers [1], [2] and cardiovascular diseases [3]–[5]. In ultrasound molecular imaging, targeted microbubbles are synthesized by conjugating ligands to the microbubble shell that specifically bind to molecular targets on the vascular endothelium, enabling applications for molecular imaging, disease monitoring, and quantification. [6], [7].
The central technical challenge for ultrasound molecular imaging is to detect and enhance echo signals derived from molecularly bound microbubbles, while suppressing signals derived from surrounding tissue and freely circulating microbubbles [8], [9]. Over the previous two decades, multiple techniques have been developed and tested to achieve this goal [10]–[16]. Among the current techniques for ultrasound molecular imaging, the most widely used method in pre-clinical applications is the pre-burst minus post-burst method [17], [18]. Briefly, it involves the combination of nonlinear signal detection and a specified waiting period. After initial injection of microbubbles, a specified waiting period of a few minutes allows microbubbles to attach to the molecular targets on the vessel wall, via ligand-receptor bonds. The pre-destruction intensity of microbubble signal is measured by performing contrast mode imaging (e.g. “Contrast Pulse Sequence”) [19] where surrounding linear tissue signal is eliminated. This pre-destruction intensity is derived from both adherent microbubbles and freely circulating microbubbles. High intensity destruction pulses are then transmitted to destroy all microbubbles (both adherent and freely circulating) within the field of view. After replenishment of freely circulating microbubbles, the post-destruction microbubble signal intensity is measured again. The difference between the pre- and post-destruction microbubble intensities represents the signal intensity derived only from adherent microbubbles. This pre-burst minus post-burst method has been demonstrated to be effective in many pre-clinical applications including the detection of angiogenesis [20], [21], cancer [1], [2], inflammation [3], [10], and atherosclerosis [4], [5] (Table 1). To the best of the authors' knowledge, among all pre-clinical applications of ultrasound molecular imaging, the minimum injection dose is 1 × 10⁶ microbubbles per rodent [5], [22]. For most tumor and cancer applications, the injection dose is typically between 1 × 10⁷ to 5 × 10⁷ microbubbles per animal (Table 1).
Table 1. Pre-clinical applications of ultrasound molecular imaging.
| Application | Animal model | Molecular target | Imaging mode | Adherent microbubble isolation | Dose (Microbubbles per animal) | Reference |
|---|---|---|---|---|---|---|
| Angiogenesis | Mouse, tumor | VEGFR2 | B-mode | Pre-burst minus post-burst | 3.8 × 10⁷ | [20] |
| Angiogenesis | Mouse, tumor | VEGFR2, αvβ3 | B-mode | Pre-burst minus post-burst | 5 × 10⁷ | [21] |
| Angiogenesis | Mouse, tumor | VEGFR2 | CPS | Fast dwell-time based method | 5 × 10⁷ | [12] |
| Angiogenesis | Mouse, tumor | E-selectin | B-mode | Pre-burst minus post-burst | 1 × 10⁶ | [22] |
| Cancer | Mouse, mammary glands | VEGFR2 | CPS | Pre-burst minus post-burst | 5 × 10⁷ | [1] |
| Cancer | Mouse, pancreas | VEGFR2 | Contrast mode | Pre-burst minus post-burst | 5 × 10⁷ | [2] |
| Inflammation | Rat, heart | ICAM-1 | Contrast mode | Pre-burst minus post-burst | 2.5 × 10⁶ | [10] |
| Inflammation | Rat, heart | Selectins | CPS | Pre-burst minus post-burst | 5 × 10⁶ | [23] |
| Inflammation | Mouse, heart | P-selectin | CPS | Pre-burst minus post-burst | 1 × 10⁶ | [3] |
| Atherosclerosis | Mouse, thoracic aorta | VCAM-1 | CPS | Pre-burst minus post-burst | 1 × 10⁶ | [4] |
| Atherosclerosis | Mouse, thoracic aorta | P-selectin, VCAM-1 | CPS | Pre-burst minus post-burst | 1 × 10⁶ | [5] |
To successfully translate ultrasound molecular imaging to clinical applications, certain improvements are necessary, including an effort to increase detection sensitivity to use the lowest possible microbubble dose that can still provide sufficient diagnostic information. Reduction of the dose of the administered contrast agent is always beneficial, simply because it will further reduce the amount of expensive contrast material and minimize (already low) probability of undesired side reactions [22]. Ultrasound molecular imaging is well known for its high detection sensitivity and possesses the capability to detect individual microbubbles [24]. With higher detection sensitivity, lower doses of ultrasound contrast material injections could be used to provide similar diagnostic information. Consequently, improved safety, lower cost, and shorter imaging procedure time may result.
In this study, we improved the pre-burst minus post-burst method by implementing a multi-frame compounding pulse inversion (PI) imaging sequence to increase detection signal-to-noise ratio (SNR). The improved ultrasound molecular imaging sequence was evaluated in a mouse tumor model to achieve a minimum injection dose of only 5 × 10⁴ microbubbles per mouse.
Materials and Methods
Multi-frame Compounding Pulse Inversion (PI) Imaging
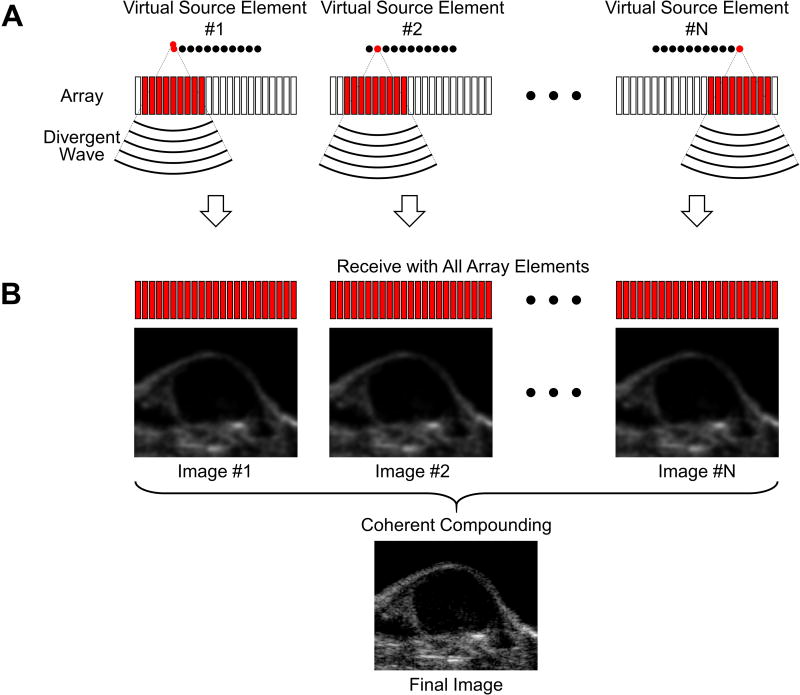
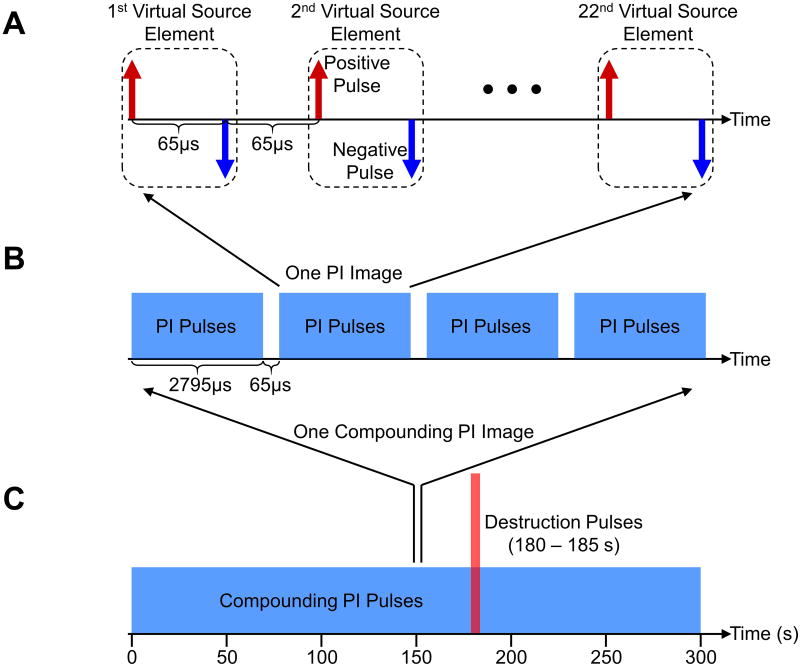
The multi-frame compounding pulse inversion (PI) imaging sequence involves a combination of multi-frame compounding with virtual source elements [25], [26] (Figure 1) and PI [27]. Specifically, twenty-two virtual source elements were defined with a synthetic aperture of 128 elements, a foci of -35 mm, and a pitch of 60 μm (Figure 2A). For a single transmit event, a negatively focused wave (i.e. a divergent wave due to a negative focus – placed behind the array's physical surface) was transmitted by one virtual source element. Each virtual source element transmitted a positive and a negative waveform with a delay of 65 μs (PI principle) [27]. The 22 virtual source elements performed transmissions sequentially with a constant delay of 65 μs, resulting in a total number of 44 transmitted divergent waves. Coherent compounding of the 44 received waves was performed to generate one PI image (Figure 2B). Furthermore, four consecutive PI images with a constant delay of 65 μs were coherently summed to generate one multi-frame compounding PI image. In total, coherent summation of 176 transmitted divergent waves were performed to generate one final multi-frame compounding PI image with a frame period of 11.44 ms. The purpose of using multi-frame compounding with virtual source elements was to increase imaging signal-to-noise ratio (SNR) and reduce grating lobe related artifacts [25], [26]. Additionally, enhancement of non-linear detection sensitivity, through a reduction in noise, was achieved by summation of multiple PI images. The sequence continuously imaged for 300 s at a frame rate of approximately 6 Hz (Figure 2C). All multi-frame compounding PI images were dynamically saved for later analysis. High intensity destruction pulses were transmitted from 180 to 185 s to burst microbubbles within the field of view.
Figure 1. Schematic diagrams illustrating the image formation of multi-frame compounding with virtual source elements.
A, Divergent waves are transmitted by the virtual source elements sequentially. A given sub-aperture is assigned to each virtual source element. B, Full aperture is assigned for receive from each virtual source element. Coherent compounding of all image frames is performed to form one final image.
Figure 2. Schematic diagrams of the detailed multi-frame compounding pulse inversion imaging sequence.
A, 22 virtual source elements transmit divergent waves sequentially. 44 transmitted pulses (one group of PI pulses) are used to generate one PI image. The time interval between two consecutive pulses is 65 μs. B, 4 consecutive groups of PI pulses (176 single pulses) are used to generate one multi-frame compounding PI image. The time interval between two consecutive groups of PI pulses is 65 μs. C, Multi-frame compounding PI imaging is performed for 300 s at a frame rate of approximately 6 Hz. High intensity destruction pulses are transmitted from 180 to 185 s.
The multi-frame compounding PI imaging sequence was programmed on a Verasonics ultrasound system (Vantage 256, Verasonics, Kirkland, WA, USA) equipped with an ATL L12-5 38mm linear array transducer. Imaging (2 cycle) and destruction (15 cycle) pulses were transmitted at a frequency of 5.68 and 4.46 MHz, respectively. A band-pass filter was applied to select receive echo data centered around the second harmonic frequency (11.36 MHz). Acoustic pressures of both imaging and destruction pulses were measured as 286 kPa (MI = 0.12) and 765 kPa (MI = 0.36), respectively, at a depth of 12 mm using a calibrated needle hydrophone (HGL-0085, Onda, Sunnyvale, CA, USA).
Mice
All animal studies were performed under a protocol approved by the Institutional Animal Care and Use Committee at the University of Virginia. A tumor model derived from murine colon adenocarcinoma was used in this study (MC-38, generously donated by Dr. J Schlom, National Institutes of Health, USA). C57BL/6 female mice (10 months, ∼30 g, The Jackson Laboratory, Bar Harbor, ME, USA) were injected subcutaneously into the hindlimb with 5 × 10⁵ MC-38 cells. Tumors were allowed to grow for up to 12 days.
Imaging was performed approximately 11 days post MC-38 cell injection. Before imaging, mice were initially anesthetized in the induction chamber using a mixture of 2.5% isoflurane (Henry Schein, Dublin, OH, USA) and 97.5% air. Then they were transferred to a heated imaging stage (TM150, Indus Instruments, Webster, TX, USA) in prone position and kept under anesthesia (inhalation of 2% isoflurane and 98% air mixture) throughout the course of the experiment. Skin hair above the tumor was removed prior to imaging. A tail vein catheter was affixed to administer the microbubbles. The location and orientation of the ultrasound transducer was carefully adjusted to get a clear view of the tumor. The center of the tumor was maintained at an imaging depth of approximately 10 mm.
Microbubble Fabrication
Biotinylated microbubbles (average diameter = 2.2 μm, standard deviation of diameter = 1.5 μm, and resonance frequency ≈ 4.4 MHz [28]) were prepared by sonicating decafluorobutane gas (F2 Chemicals, Lancashire, UK) with a micellar dispersion in normal saline of distearoyl phosphatidylcholine (DSPC, Avanti Polar Lipids, Alabaster, AL, USA), poly(ethyleneglycol) stearate (Stepan Kessco, Elwood, IL, USA) and biotin-PEG3400-phosphatidylethanolamine (biotin-PEG-DSPE, Shearwater Polymers, Huntsville, AL, USA) [29], [30]. Biotinylated microbubbles were placed in vials and sealed under perfluorobutane headspace for refrigerated storage. Excess unincorporated lipid micellar material was removed from the microbubbles immediately prior to use by repeated centrifugal flotation in degassed saline [30].
For VEGFR2-targeted microbubbles used in the study, biotinylated monoclonal anti-VEGFR2 antibody (clone Avas12a1, eBioscience, San Diego, CA, USA) was conjugated to the microbubble shell using streptavidin (60659, AnaSpec, Fremont, CA, USA) [30], [31]. For isotype control microbubbles, isotype control antibody (IgG2a, eBioscience, San Diego, CA, USA) was conjugated to the microbubble shell. The concentrations of all above antibodies added were approximately 1.5 μg per 107 microbubbles to obtain maximal surface coverage [30], [31]. Sequential centrifugal washes in degassed saline were performed to remove excess biotinylated lipid, streptavidin, and antibodies from the microbubble shell as described in those references.
Antibody-decorated microbubbles were prepared immediately before animal experiments. Concentration and size distribution of microbubbles were measured using a Multisizer 3 Coulter Counter (Beckman Coulter, Brea, CA, USA). For each trial, a bolus injection of 1 × 10⁷ (regular dose), 2 × 10⁵ (low dose), or 5 × 10⁴ (ultra-low dose) microbubbles diluted in approximately 50 μL sterile saline was administered via the tail vein catheter 5 s after the start of imaging sequence.
Microbubble Characterization: Main Phospholipid Content
Quantitative estimation of the main microbubble shell component, DSPC, was performed with a sample of freshly washed biotinylated microbubbles (described above). An aliquot with a known microbubble concentration, as determined by a Coulter Counter was lyophilized and re-dissolved in methanol containing 2 mM ammonium acetate; sodium chloride sediment was removed by centrifugation prior to analysis. Reverse phase high-performance liquid chromatography (HPLC) (1050Ti pump, 1050Ti autosampler, Hewlett Packard Agilent, Santa Clara, CA, USA) on a Jupiter 5μm C4 300A column (150 × 4.6 mm) C4 (Phenomenex, Torrance, CA, USA), with evaporative light scattering detector (Alltech Varex MKIII ELSD, Grace, Columbia, MD, USA) was performed with water/methanol gradient as described previously [32].
Data Analysis
A region of interest (ROI) was manually selected for each tumor. The signal intensity profiles were achieved by averaging signal intensity of the focused echo data (multi-frame compounding PI image) within the ROI over the course of the imaging sequence (300 s). The signal intensity profiles from independent trials (n = 5) were then normalized and averaged. Statistical analysis was then performed on the pre-destruction (at 175 s) and post-destruction (at 200 s) signal intensities.
Statistical Analysis
All data were reported as mean ± standard deviation (SD). Statistical analysis was performed using the Statistics and Machine Learning Toolbox in MATLAB. Unpaired Student's t-tests were used, and differences were considered statistically significant with a p-value less than 0.05.
Results
Quantification of Microbubble Concentration, Phosphatidylcholine Content and Particle Mass
Size distribution and concentration of the biotinylated microbubbles used in the study was determined by a Coulter Counter, and amounted to 2.2 × 10⁹ particles/mL. As the Multisizer software can re-compute the surface area and volume for each particle passing through the sensor orifice, assuming spherical shape, the surface area of the particle ensemble was determined as 27 × 109 μm2/mL, and volume of 11 μm3/mL (i.e. 1.1% v/v). Thus, the mean particle surface area was ∼12 μm2, and mean particle volume was 5 μm3. The main shell component content (DSPC) in this sample amounted to 67 μg/mL, as determined by HPLC. Thus, each contrast microbubble particle had 3 × 10-14 g of DSPC, and 106 particles had 30 ng DSPC.
Detection of Angiogenesis with a Minimum Dose of 5 × 10⁴ Microbubbles per Mouse
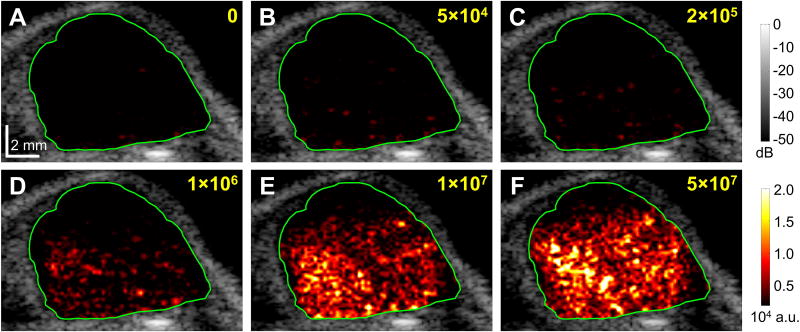
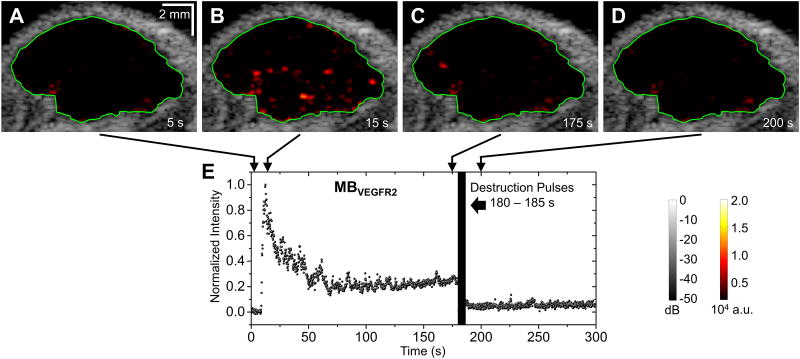
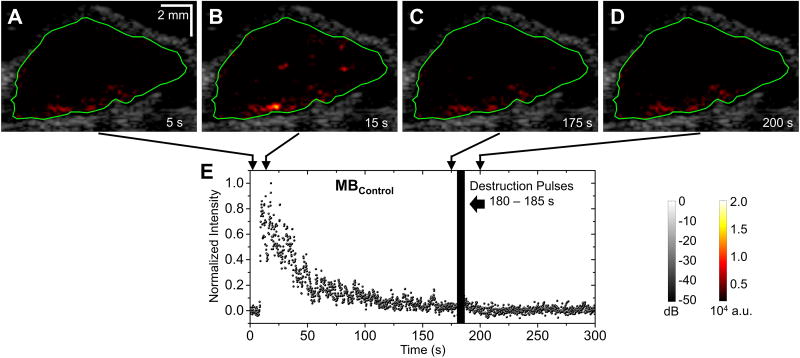
An overview of microbubble doses used in this study is shown in Table 2. Figure 3 illustrates the representative images of the same tumor under different injection doses of targeted microbubbles (ranging from 0 to 5 × 10⁷ MBVEGFR2 per mouse). B-mode images overlaid with color-coded multi-frame compounding PI images (within the ROI) of the tumor. The color mappings have the same scale for all figures in this paper (0 – 2 × 10⁴ a.u.). At the conventional dose (5 × 10⁷ microbubbles per mouse), the adherent microbubbles were well visualized. However, at ultra-low dose (5 × 10⁴ microbubbles per mouse), the adherent microbubbles were less well visualized. At an injection dose of 2 × 10⁵ microbubbles per mouse, representative B-mode images overlaid with color-coded multi-frame compounding PI images (within the specified ROI) and normalized signal intensity profiles are shown in Figure 4 (with MBVEGFR2) and Figure 5 (with MBControl). Based on the multi-frame compounding PI images (Figure 4B and Figure 5B), few microbubbles were detected at 15 s (10 s after injections of microbubbles, approximately at the peak of signal intensity profiles). The injection dose (2 × 10⁵ microbubbles per mouse) was only approximately 0.4% of the regular dose (50 × 106 microbubbles per mouse) used in tumor imaging (Table 1). With a bolus injection of 2 × 10⁵ MBVEGFR2, signal intensity remained at a high residual level of approximately 30% of its maximum (Figure 4E). The pre-destruction (170 – 175 s) signal intensities were significantly higher than the post-destruction (190 – 195 s) signal intensities (p < 0.0001, n = 10). With a bolus injection of 2 × 10⁵ MBControl, signal intensity decreased to a low residual level of approximately 5% of its maximum (Figure 5E). There was no significant difference between the pre-destruction and post-destruction signal intensities.
Table 2. Overview of microbubble doses used in this study.
| Microbubbles per mouse | Mouse body weight (g) | Microbubbles per mouse body weight (g) | Phosphatidylcholine (ng) per mouse body weight (g) |
|---|---|---|---|
|
| |||
| 5×10⁴ | 28.3 ± 1.4 | (1.7 ± 0.1) × 103 | (5.3 ± 0.1) × 10-2 |
| 2×10⁵ | 28.6 ± 1.9 | (7.0 ± 0.4) × 103 | (2.1 ± 0.1) × 10-1 |
| 1×10⁷ | 29.7 ± 1.8 | (3.4 ± 0.2) × 105 | (1.0 ± 0.1) × 101 |
Figure 3. Representative images of the same tumor under different injection doses of targeted microbubbles.
A, no injection; B, 5 × 10⁴ MBVEGFR2; C, 2 × 10⁵ MBVEGFR2; D, 1 × 10⁶ MBVEGFR2; E, 1 × 10⁷ MBVEGFR2; F, 5 × 10⁷ MBVEGFR2. B-mode images overlaid with color-coded multi-frame compounding PI images (within the ROI) of the tumor for injection of MBVEGFR2. Green lines define the ROI of the tumor. Images were taken approximately 20 s after the injection of microbubbles. Scale bar in A represents 2 mm.
Figure 4. Representative images and normalized signal intensities for targeted microbubbles (one trial at 2 × 10⁵ microbubbles per mouse).
A – D, B-mode images overlaid with color-coded multi-frame compounding PI images (within the ROI) of the tumor for injection of MBVEGFR2. Green lines define the ROI of the tumor. E, Normalized signal intensity profile of the ROI for injection of MBVEGFR2. Microbubble injection was performed 5 s after the start of imaging sequence. Destruction pulses were transmitted from 180 to 185 s.
Figure 5. Representative images and normalized signal intensities for control microbubbles (one trial at 2 × 10⁵ microbubbles per mouse).
A – D, B-mode images overlaid with color-coded multi-frame compounding PI images (within the ROI) of the tumor for injection of MBControl. Green lines define the ROI of the tumor. E, Normalized signal intensity profile of the ROI for injection of MBControl. Microbubble injection was performed 5 s after the start of imaging sequence. Destruction pulses were transmitted from 180 to 185 s.
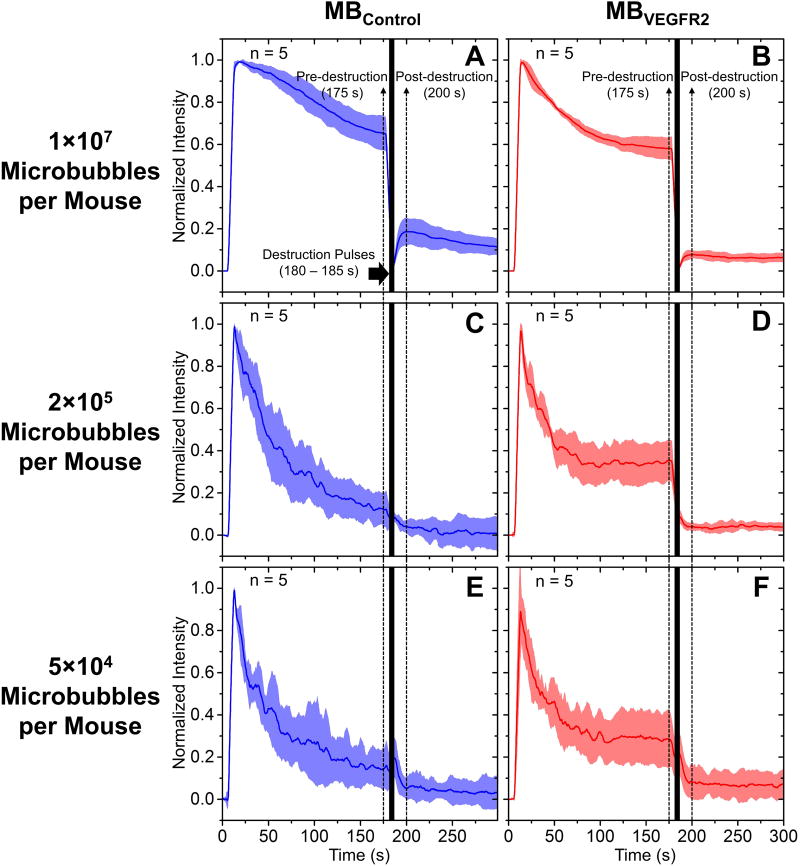
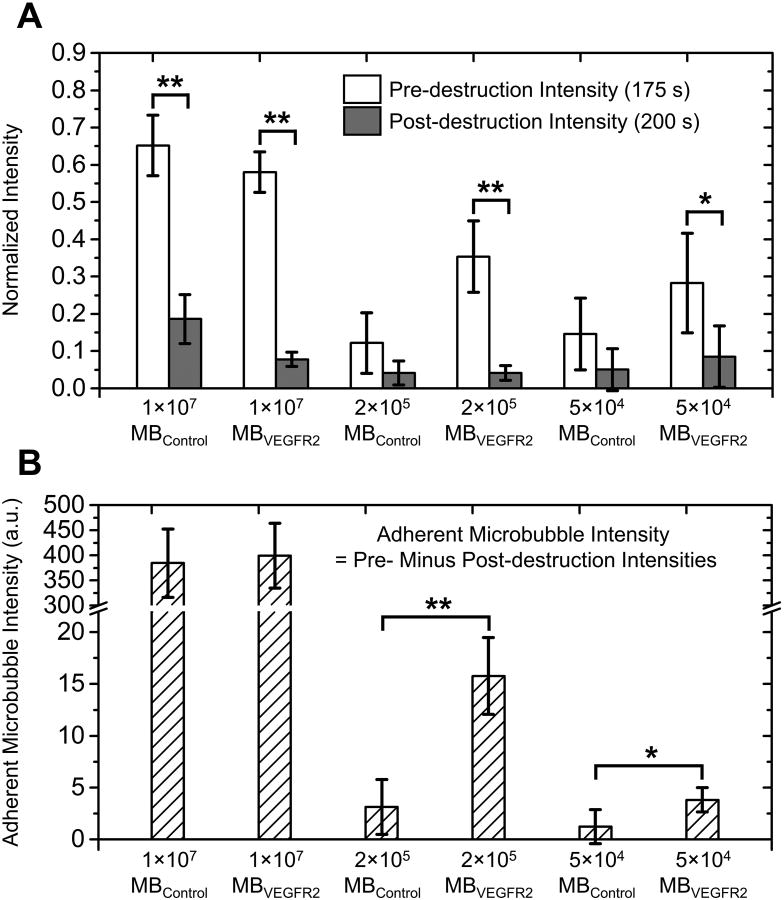
The average normalized signal intensity profiles for doses of 1 × 10⁷, 2 × 10⁵ and 5 × 10⁴ microbubbles per mouse are illustrated in Figure 6. A bar plot of normalized pre-destruction (at 175 s) and post-destruction (at 200 s) signal intensities for all groups are shown in Figure 7A. For injection dose of 1 × 10⁷ microbubbles per mouse, pre-destruction signal intensity was significantly higher than post-destruction signal intensity for both MBVEGFR2 and MBControl (p < 0.0001, n = 5, Figure 7A). The difference between normalized pre- and post-destruction signal intensities with MBVEGFR2 (approximate 0.50, Figure 6B) was greater than that with MBControl (approximate 0.46, Figure 6A). With 2 × 10⁵ MBVEGFR2, pre-destruction signal intensity was significantly higher than post-destruction signal intensity (p < 0.0001, n = 5, Figure 7A), with an average difference of approximately 30% of the peak signal intensity. However, there was no significant difference between pre- and post-destruction signal intensities with the corresponding MBControl injection. Similarly, with 5 × 10⁴ microbubbles, a significant difference between pre- and post-destruction signal intensities was only shown with MBVEGFR2 (p < 0.05, n = 5, Figure 7A). In addition, the difference between pre- and post-destruction intensities was approximately 20% of the peak signal intensity. The adherent microbubble signal intensity, which is defined as the difference between pre-destruction and post-destruction intensities, is illustrated in Figure 7B. There were significant differences between the adherent microbubble signal intensities of MBVEGFR2 and MBControl at 2 × 10⁵ microbubbles per mouse (p < 0.0001, n = 5) and 5 × 10⁴ microbubbles per mouse (p < 0.05, n = 5). However, at 1 × 10⁷ microbubbles per mouse, the non-specific adhesion of microbubbles was significant, and approached that of the targeted adherent microbubbles. In conclusion, the proposed method of multi-frame compounding PI was able to differentiate targeted microbubble adhesion from freely circulating microbubbles with statistical significance at a minimum dose of only 5 × 10⁴ microbubbles per mouse.
Figure 6. Average signal intensity profiles for the pre-burst minus post-burst method.
A, 1 × 10⁷ MBControl per mouse; B, 1 × 10⁷ MBVEGFR2 per mouse; C, 2 × 10⁵ MBControl per mouse; D, 2 × 10⁵ MBVEGFR2 per mouse; E, 5 × 10⁴ MBControl per mouse; F, 5 × 10⁴ MBVEGFR2 per mouse. Solid lines indicate the mean and shadows indicate the error bars (mean ± standard deviation). Microbubbles were injected at 5 s. Destruction pulses were transmitted from 180 to 185 s. Pre- and post-destruction signal intensities are defined at 175 s and 200 s, respectively.
Figure 7. Pre- and post-destruction signal intensities and adherent microbubble signal intensities.
A, Bar plot of normalized pre-destruction (white bar, 175 s) and post-destruction (gray bar, 200 s) signal intensities at different microbubble doses. B, Bar plot of adherent microbubble intensities (defined as pre-destruction minus post-destruction signal intensities) at different microbubble doses. (** p < 0.0001, * p < 0.05)
Discussion
Ultrasound molecular imaging is known for its high detection sensitivity of microbubbles (single microbubble detectable) [24]. With higher detection sensitivity, a lower dose of microbubble injection may be used to provide similar diagnostic information. Decreasing the minimum microbubble injection dose could be beneficial in reducing cost, and potentially beneficial in reducing dose-dependent side effects. Quantifying a minimal injection dose of microbubbles could be valuable information that will advance further development of molecular imaging techniques. Consequently, this study focused upon evaluation of the minimum dose of microbubbles necessary to provide statistically significant detection of VEGFR2 expression in a mouse tumor model.
Microbubble Shell Phospholipid Mass and Mass of Other Components
It has been assumed in the literature that microbubbles are stabilized with a lipid shell that has a monolayer structure [33]. In this study, we have quantified the amount of the main lipid component of the microbubble shell, DSPC, after the excess of free micellar nanoemulsion has been washed away from the microbubbles used for imaging study. In the literature, it has been reported that each DSPC molecule in a condensed lipid membrane occupies a surface area of ∼ 0.5 nm2 [34]. Based on the microbubble surface area, as determined by a Coulter Counter, this translates to the DSPC mass per particle of 3.2 × 10⁻¹⁴ g which is close to the 3 × 10-14 g we obtained using HPLC quantification. Detection sensitivity of our HPLC method currently does not allow quantification of PEG stearate and biotin-PEG-DSPE in the microbubble shell following centrifugal wash. These were inferred from the assumption that the mass ratios in the initial aqueous media and in the microbubble shell are the same, which essentially doubles the shell mass. The amounts of streptavidin and biotinylated antibodies attached per microbubble that is reported in the literature is listed as a range, from approximately 1 × 10⁵ [35] to 3 × 10⁵ [31], [36]. Based on the number of biotin residues per microbubble that we obtain from the surface area and the biotin : DSPC molar ratio data, assuming 1 : 1 : 1 for biotin : streptavidin : antibody ratio, for the microbubbles of the reported size and surface, the number is calculated as approximately 2.1 × 10⁵ per microbubble, thus, approximately doubling the mass of the particle again. Overall, from these calculations, the combined mass of the microbubble shell and targeting ligand components is about 4.4-fold higher than the mass of DSPC alone. We did not measure the mass of perfluorocarbon gas in this microbubble formulation. And we only estimated the microbubble particle volume with Coulter counter as approximately 5 μm3. If we assume that there is no other gas in the core, and the reported decafluorobutane density is 11.2 mg/mL, this converts to mean decafluorobutane mass per microbubble of approximately 5.6 × 10⁻¹⁴ g. it is known that low-boiling perfluorocarbons leave the body quite rapidly, by exhalation via lungs, and thus should not be of concern for long-term retention in the body [17], [37]. In any case, the sum of masses of all the shell components and gas in each microbubble should not exceed 0.2 pg.
Minimum Microbubble Dose of 5 × 10⁴ for Detection of Angiogenesis
The minimum dose for detection of angiogenesis demonstrated in this study was 5 × 10⁴ microbubbles per mouse, which is 0.1% of the regular dose (5 × 10⁷ microbubbles per mouse) for tumor imaging [1], [12], [21], and 5% of the minimum dose (1 × 10⁶ microbubbles per mouse) ever published for tumor imaging [22]. Contributions were made from the following aspects: (1) By coherently compounding echo data from 176 divergent beam transmits, the multi-frame compounding PI significantly increased SNR and detection sensitivity of microbubbles. Using multi-frame compounding PI imaging, it was possible to distinguish individual microbubbles at very low doses (2 × 10⁵ and 5 × 10⁴ microbubbles per mouse) (Figure 4B and 3B). Additionally, individual microbubbles moving in or out of the imaging plane caused detectable variations of signal intensity (Figure 4E). (2) The microbubbles used in this study were based on phosphatidylcholine as the major shell component [6]. Most targeted microbubble formulations are based on this flexible shell material. However, rigid albumin-shelled microbubbles tend to break (or rupture) and the resulting shell fragments do not reform a stable shell [38]. In summary, from the range of shell properties of various types of microbubbles, lipid-shelled microbubbles have the necessary stability to provide consistent acoustic response, and thus generate more backscatter as a contrast agent. Additionally, the ligand-receptor pair (VEGFR2 and anti-VEGFR2 antibody) in this study is widely used and has demonstrated efficacy in pre-clinical studies of angiogenesis detection [2], [12], [20], [21]. (3) The acoustic parameters in the proposed imaging sequence were fully optimized. Firstly, the intensity of imaging pulses (MI = 0.12) was optimized to achieve high SNR while preventing destruction of adherent microbubbles. Secondly, the length of the waiting period (175 s, time between microbubble injection and application of destruction pulses) was minimized while allowing for sufficient binding of microbubbles.
Binding Efficacy Decreased with Lower Microbubble Dose
According to Figure 6B, Figure 6D, and Figure 6F, the percentages of adherent microbubble signal to saturation signal intensities decreased with lower microbubble doses (approximately 50% at 1 × 10⁷, 30% at 2 × 10⁵, and 20% at 5 × 10⁴ microbubbles per mouse). Lower concentration of freely circulating microbubbles resulted in lower contact probability between microbubbles and molecular targets on vessel wall, and thus lower binding efficacy of microbubbles. In order to increase the binding efficacy of microbubbles at very low dose, acoustic radiation force (ARF) could be used [39]–[41]. Previous studies demonstrated enhanced microbubble binding in ultrasound molecular imaging with the assistance of ARF [42], [43]. Additionally, instead of using single ligand targeted microbubbles (VEGFR2-targeted), multi-ligand targeted microbubbles (e.g. VEGFR2, αvβ3-integrin, E-selectin) [36], [44] could be used to further increase binding efficacy, resulting in lower minimum microbubble doses.
Non-specific Adhesion Increased with Higher Microbubble Dose
With injection of control microbubbles, the difference between pre- and post-destruction signal intensities represented the non-specific adhesion of control microbubbles [20], [45]. At injection doses of 2 × 10⁵ and 5 × 10⁴ microbubbles per mouse, the non-specific adhesion level was negligible (Figure 7). However, at a higher dose (1 × 10⁷ microbubbles per mouse), non-specific adhesion was statistically significant (p < 0.0001). Previous studies in tumors demonstrated that at different doses (5 × 10⁷ [21] and 2 × 10⁷ microbubbles per mouse [46]), a separate control microbubble injection was required to estimate the non-specific “background” signal. This control microbubble injection prolonged the imaging procedure due to lengthy waiting periods to clear the previously injected microbubbles. At the injection doses lower than a certain threshold (e.g. 2 × 10⁵ and 5 × 10⁴ microbubbles per mouse), the non-specific adhesion could be negligible, and thus the separate control microbubble injection could be eliminated, resulting in a simpler and shorter imaging procedure.
Limitations of the Study
The ultra-low-dose data presented in this paper was based on non-clinically translatable microbubbles (with streptavidin linker between biotinylated microbubble and biotinylated antibody) in a mouse model, and cannot be applied to clinically translatable microbubbles (e.g. BR55) directly without further studies. Additionally, we did not perform any safety or toxicity studies at the presented doses of microbubbles. The study was designed to examine sensitivity and efficacy, but safety. However, the therapeutic index of microbubble contrast appears promising. There is already sufficient literature data claiming that microbubbles are considered safe for humans at higher doses than our applied maximum, e.g. reference [47], where almost a billion microbubbles per kg was administered in humans. Additionally, much higher weight normalized doses have been safely administered in rodents.
Verasonics programmable ultrasound system with custom designed graphic user interfaces (GUIs) was used in this study. Real-time monitoring of signal intensity within the tumor was achieved without any off-line data processing. Microbubbles were prepared and conjugated with anti-VEGFR2 antibody in-house via the standard streptavidin coupling technique [30], [31]. However, usage of a clinical ultrasound scanner and clinically approved VEGFR2-targeted microbubbles (when they become available) would facilitate clinical translation of this technique.
We only quantified DSPC and did not measure the contents of the other components of the microbubble shell, such as PEG stearate and biotin-PEG3400-DSPE, due to current limitations of our HPLC procedure. While those molecules comprise a smaller fraction of the surface and particle mass than DSPC, accounting for their presence may provide better precision of the estimate of the particle shell mass, and may account for the minor discrepancy between the mass data obtained by HPLC and by the particle surface area estimate.
Additionally, we only estimated the mass of other components of microbubble, such as streptavidin and antibody, and we did not account for the amount of decafluorobutane gas in the microbubble core. Further studies should be conducted to achieve mass measurements of all the components of microbubbles, especially the ones suited for clinical translation.
Conclusion
In this study, ultrasound molecular imaging with a custom designed multi-frame compounding PI imaging sequence and VEGFR2-targeted microbubbles was performed to achieve detection of angiogenesis in a mouse tumor model with a minimum dose of 5 × 10⁴ microbubbles per mouse (DSPC at 0.053 ng/g mouse body mass). This is the lowest published microbubble dose on record for ultrasound molecular imaging to achieve statistically significant detection of molecular targets in vivo. Findings in this study provide us with guidance for future development of clinically translatable ultrasound molecular imaging applications using a lower dose of microbubbles.
Supplementary Material
Acknowledgments
Disclosure of Funding: This work was supported by NIH R01 EB001826, NIH R01 HL111077, and the Virginia Center for Innovative Technology (CIT) Commonwealth Research Commercialization Fund Award MF14F-002-LS. The content is solely the responsibility of the authors and does not necessarily represent the official views of the NIH.
Contributor Information
Shiying Wang, Department of Biomedical Engineering, University of Virginia, Charlottesville, VA 22908, USA
Elizabeth B. Herbst, Department of Biomedical Engineering, University of Virginia, Charlottesville, VA 22908, USA
F. William Mauldin, Jr, Department of Biomedical Engineering, University of Virginia, Charlottesville, VA 22908, USA.
Galina B. Diakova, Cardiovascular Research Center, University of Virginia, Charlottesville, VA 22908, USA.
Alexander L. Klibanov, Division of Cardiovascular Medicine, Cardiovascular Research Center and Department of Biomedical Engineering, University of Virginia, Charlottesville, VA 22908, USA.
John A. Hossack, Department of Biomedical Engineering and Electrical and Computer Engineering, University of Virginia, Charlottesville, VA 22908, USA.
References
- 1.Bachawal SV, Jensen KC, Lutz AM, et al. Earlier detection of breast cancer with ultrasound molecular imaging in a transgenic mouse model. Cancer Res. 2013;73(6):1689–98. doi: 10.1158/0008-5472.CAN-12-3391. [DOI] [PMC free article] [PubMed] [Google Scholar]
- 2.Pysz MA, Machtaler SB, Seeley ES, et al. Vascular endothelial growth factor receptor type 2-targeted contrast-enhanced US of pancreatic cancer neovasculature in a genetically engineered mouse model: potential for earlier detection. Radiology. 2015;274(3):790–9. doi: 10.1148/radiol.14140568. [DOI] [PMC free article] [PubMed] [Google Scholar]
- 3.Kaufmann BA, Lewis C, Xie A, et al. Detection of recent myocardial ischaemia by molecular imaging of P-selectin with targeted contrast echocardiography. Eur Heart J. 2007;28(16):2011–7. doi: 10.1093/eurheartj/ehm176. [DOI] [PubMed] [Google Scholar]
- 4.Kaufmann BA, Sanders JM, Davis C, et al. Molecular imaging of inflammation in atherosclerosis with targeted ultrasound detection of vascular cell adhesion molecule-1. Circulation. 2007;116(3):276–84. doi: 10.1161/CIRCULATIONAHA.106.684738. [DOI] [PubMed] [Google Scholar]
- 5.Kaufmann BA, Carr CL, Belcik JT, et al. Molecular imaging of the initial inflammatory response in atherosclerosis: implications for early detection of disease. Arterioscler Thromb Vasc Biol. 2010;30(1):54–9. doi: 10.1161/ATVBAHA.109.196386. [DOI] [PMC free article] [PubMed] [Google Scholar]
- 6.Klibanov AL. Ultrasound contrast agents: development of the field and current status. Contrast Agents II. 2002;(222):73–106. [Google Scholar]
- 7.Unnikrishnan S, Klibanov AL. Microbubbles as ultrasound contrast agents for molecular imaging: preparation and application. AJR Am J Roentgenol. 2012;199(2):292–9. doi: 10.2214/AJR.12.8826. [DOI] [PubMed] [Google Scholar]
- 8.Wang S, Hossack JA, Klibanov AL, et al. Binding dynamics of targeted microbubbles in response to modulated acoustic radiation force. Phys Med Biol. 2014;59(2):465–84. doi: 10.1088/0031-9155/59/2/465. [DOI] [PMC free article] [PubMed] [Google Scholar]
- 9.Wang S, Wang CY, Unnikrishnan S, et al. Optical verification of microbubble response to acoustic radiation force in large vessels with in vivo results. Invest Radiol. 2015;50(11):772–84. doi: 10.1097/RLI.0000000000000185. [DOI] [PMC free article] [PubMed] [Google Scholar]
- 10.Weller GE, Lu E, Csikari MM, et al. Ultrasound imaging of acute cardiac transplant rejection with microbubbles targeted to intercellular adhesion molecule-1. Circulation. 2003;108(2):218–24. doi: 10.1161/01.CIR.0000080287.74762.60. [DOI] [PubMed] [Google Scholar]
- 11.Hu X, Zheng H, Kruse DE, et al. A sensitive TLRH targeted imaging technique for ultrasonic molecular imaging. IEEE Trans Ultrason Ferroelectr Freq Control. 2010;57(2):305–16. doi: 10.1109/TUFFC.2010.1411. [DOI] [PMC free article] [PubMed] [Google Scholar]
- 12.Pysz MA, Guracar I, Tian L, et al. Fast microbubble dwell-time based ultrasonic molecular imaging approach for quantification and monitoring of angiogenesis in cancer. Quant Imaging Med Surg. 2012;2(2):68–80. doi: 10.3978/j.issn.2223-4292.2012.06.05. [DOI] [PMC free article] [PubMed] [Google Scholar]
- 13.Mauldin FW, Dhanaliwala AH, Patil AV, et al. Real-time targeted molecular imaging using singular value spectra properties to isolate the adherent microbubble signal. Phys Med Biol. 2012;57(16):5275–93. doi: 10.1088/0031-9155/57/16/5275. [DOI] [PMC free article] [PubMed] [Google Scholar]
- 14.Wang S, Mauldin FW, Klibanov AL, et al. Ultrasound-based measurement of molecular marker concentration in large blood vessels: A feasibility study. Ultrasound Med Biol. 2015;41(1):222–34. doi: 10.1016/j.ultrasmedbio.2014.07.001. [DOI] [PMC free article] [PubMed] [Google Scholar]
- 15.Wang S, Mauldin FW, Klibanov AL, et al. Shear forces from flow are responsible for a distinct statistical signature of adherent microbubbles in large vessels. Mol Imaging. 2013;12(6):396–408. [PMC free article] [PubMed] [Google Scholar]
- 16.Wang S, Unnikrishnan S, Herbst EB, et al. Ultrasound molecular imaging with modulated acoustic radiation force-based beam sequence in mouse abdominal aorta: a feasibility study. IEEE Int Ultrason Symp. 2015:1–4. [Google Scholar]
- 17.Ferrara K, Pollard R, Borden M. Ultrasound microbubble contrast agents: fundamentals and application to gene and drug delivery. Annu Rev Biomed Eng. 2007;9:415–47. doi: 10.1146/annurev.bioeng.8.061505.095852. [DOI] [PubMed] [Google Scholar]
- 18.Abou-Elkacem L, Bachawal SV, Willmann JK. Ultrasound molecular imaging: Moving toward clinical translation. Eur J Radiol. 2015;84(9):1685–93. doi: 10.1016/j.ejrad.2015.03.016. [DOI] [PMC free article] [PubMed] [Google Scholar]
- 19.Phillips PJ. Contrast pulse sequences (CPS): imaging nonlinear microbubbles. IEEE Int Ultrason Symp. 2001:1739–45. [Google Scholar]
- 20.Lee DJ, Lyshchik A, Huamani J, et al. Relationship between retention of a vascular endothelial growth factor receptor 2 (VEGFR2)-targeted ultrasonographic contrast agent and the level of VEGFR2 expression in an in vivo breast cancer model. J Ultrasound Med. 2008;27(6):855–66. doi: 10.7863/jum.2008.27.6.855. [DOI] [PubMed] [Google Scholar]
- 21.Willmann JK, Lutz AM, Paulmurugan R, et al. Dual-targeted contrast agent for US assessment of tumor angiogenesis in vivo. Radiology. 2008;248(3):936–44. doi: 10.1148/radiol.2483072231. [DOI] [PMC free article] [PubMed] [Google Scholar]
- 22.Spivak I, Rix A, Schmitz G, et al. Low-dose molecular ultrasound imaging with E-selectin-targeted PBCA microbubbles. Mol Imaging Biol. 2015;18(2):180–90. doi: 10.1007/s11307-015-0894-9. [DOI] [PubMed] [Google Scholar]
- 23.Villanueva FS, Lu E, Bowry S, et al. Myocardial ischemic memory imaging with molecular echocardiography. Circulation. 2007;115(3):345–52. doi: 10.1161/CIRCULATIONAHA.106.633917. [DOI] [PMC free article] [PubMed] [Google Scholar]
- 24.Klibanov AL, Rasche PT, Hughes MS, et al. Detection of individual microbubbles of ultrasound contrast agents: imaging of free-floating and targeted bubbles. Invest Radiol. 2004;39(3):187–95. doi: 10.1097/01.rli.0000115926.96796.75. [DOI] [PubMed] [Google Scholar]
- 25.Frazier CH, O'Brien WR. Synthetic aperture techniques with a virtual source element. IEEE Trans Ultrason Ferroelectr Freq Control. 1998;45(1):196–207. doi: 10.1109/58.646925. [DOI] [PubMed] [Google Scholar]
- 26.Jensen JA, Nikolov SI, Gammelmark KL, et al. Synthetic aperture ultrasound imaging. Ultrasonics. 2006;44:e5–15. doi: 10.1016/j.ultras.2006.07.017. [DOI] [PubMed] [Google Scholar]
- 27.Shen CC, Chou YH, Li PC. Pulse inversion techniques in ultrasonic nonlinear imaging. J Med Ultrasound. 2005;13(1):3–17. [Google Scholar]
- 28.Patil AV, Rychak JJ, Allen JS, et al. Dual frequency method for simultaneous translation and real-time imaging of ultrasound contrast agents within large blood vessels. Ultrasound Med Biol. 2009;35(12):2021–30. doi: 10.1016/j.ultrasmedbio.2009.07.003. [DOI] [PMC free article] [PubMed] [Google Scholar]
- 29.Klibanov AL, Hughes MS, Villanueva FS, et al. Targeting and ultrasound imaging of microbubble-based contrast agents. MAGMA. 1999;8(3):177–84. doi: 10.1007/BF02594596. [DOI] [PubMed] [Google Scholar]
- 30.Klibanov AL, Rychak JJ, Yang WC, et al. Targeted ultrasound contrast agent for molecular imaging of inflammation in high-shear flow. Contrast Media Mol Imaging. 2006;1(6):259–66. doi: 10.1002/cmmi.113. [DOI] [PubMed] [Google Scholar]
- 31.Lindner JR, Song J, Christiansen J, et al. Ultrasound assessment of inflammation and renal tissue injury with microbubbles targeted to P-selectin. Circulation. 2001;104(17):2107–12. doi: 10.1161/hc4201.097061. [DOI] [PubMed] [Google Scholar]
- 32.Dasa SS, Suzuki R, Gutknecht M, et al. Development of target-specific liposomes for delivering small molecule drugs after reperfused myocardial infarction. J Control Release. 2015;220(Pt A):556–67. doi: 10.1016/j.jconrel.2015.06.017. [DOI] [PMC free article] [PubMed] [Google Scholar]
- 33.Borden MA, Kruse DE, Caskey CF, et al. Influence of lipid shell physicochemical properties on ultrasound-induced microbubble destruction. IEEE Trans Ultrason Ferroelectr Freq Control. 2005;52(11):1992–2002. doi: 10.1109/tuffc.2005.1561668. [DOI] [PMC free article] [PubMed] [Google Scholar]
- 34.Ali MH, Kirby DJ, Mohammed AR, et al. Solubilisation of drugs within liposomal bilayers: alternatives to cholesterol as a membrane stabilising agent. J Pharm Pharmacol. 2010;62(11):1646–55. doi: 10.1111/j.2042-7158.2010.01090.x. [DOI] [PubMed] [Google Scholar]
- 35.Takalkar AM, Klibanov AL, Rychak JJ, et al. Binding and detachment dynamics of microbubbles targeted to P-selectin under controlled shear flow. J Control Release. 2004;96(3):473–82. doi: 10.1016/j.jconrel.2004.03.002. [DOI] [PubMed] [Google Scholar]
- 36.Ferrante EA, Pickard JE, Rychak J, et al. Dual targeting improves microbubble contrast agent adhesion to VCAM-1 and P-selectin under flow. J Control Release. 2009;140(2):100–7. doi: 10.1016/j.jconrel.2009.08.001. [DOI] [PMC free article] [PubMed] [Google Scholar]
- 37.Klibanov AL. Targeted delivery of gas-filled microspheres, contrast agents for ultrasound imaging. Adv Drug Deliv Rev. 1999;37(1-3):139–57. doi: 10.1016/s0169-409x(98)00104-5. [DOI] [PubMed] [Google Scholar]
- 38.Dayton PA, Morgan KE, Klibanov AL, et al. Optical and acoustical observations of the effects of ultrasound on contrast agents. IEEE Trans Ultrason Ferroelectr Freq Control. 1999;46(1):220–32. doi: 10.1109/58.741536. [DOI] [PubMed] [Google Scholar]
- 39.Dayton P, Klibanov A, Brandenburger G, et al. Acoustic radiation force in vivo: a mechanism to assist targeting of microbubbles. Ultrasound Med Biol. 1999;25(8):1195–201. doi: 10.1016/s0301-5629(99)00062-9. [DOI] [PubMed] [Google Scholar]
- 40.Rychak JJ, Klibanov AL, Hossack JA. Acoustic radiation force enhances targeted delivery of ultrasound contrast microbubbles: in vitro verification. IEEE Trans Ultrason Ferroelectr Freq Control. 2005;52(3):421–33. doi: 10.1109/tuffc.2005.1417264. [DOI] [PubMed] [Google Scholar]
- 41.Rychak JJ, Klibanov AL, Ley KF, et al. Enhanced targeting of ultrasound contrast agents using acoustic radiation force. Ultrasound Med Biol. 2007;33(7):1132–9. doi: 10.1016/j.ultrasmedbio.2007.01.005. [DOI] [PubMed] [Google Scholar]
- 42.Zhao S, Borden M, Bloch SH, et al. Radiation-force assisted targeting facilitates ultrasonic molecular imaging. Mol Imaging. 2004;3(3):135–48. doi: 10.1162/1535350042380317. [DOI] [PMC free article] [PubMed] [Google Scholar]
- 43.Gessner RC, Streeter JE, Kothadia R, et al. An in vivo validation of the application of acoustic radiation force to enhance the diagnostic utility of molecular imaging using 3-d ultrasound. Ultrasound Med Biol. 2012;38(4):651–60. doi: 10.1016/j.ultrasmedbio.2011.12.005. [DOI] [PMC free article] [PubMed] [Google Scholar]
- 44.Warram JM, Sorace AG, Saini R, et al. A triple-targeted ultrasound contrast agent provides improved localization to tumor vasculature. J Ultrasound Med. 2011;30(7):921–31. doi: 10.7863/jum.2011.30.7.921. [DOI] [PMC free article] [PubMed] [Google Scholar]
- 45.Stieger SM, Dayton PA, Borden MA, et al. Imaging of angiogenesis using Cadence contrast pulse sequencing and targeted contrast agents. Contrast Media Mol Imaging. 2008;3(1):9–18. doi: 10.1002/cmmi.224. [DOI] [PubMed] [Google Scholar]
- 46.Anderson CR, Rychak JJ, Backer M, et al. scVEGF microbubble ultrasound contrast agents: a novel probe for ultrasound molecular imaging of tumor angiogenesis. Invest Radiol. 2010;45(10):579–85. doi: 10.1097/RLI.0b013e3181efd581. [DOI] [PMC free article] [PubMed] [Google Scholar]
- 47.http://www.fda.gov/ohrms/dockets/ac/08/briefing/2008-4369b1-06.pdf.
Associated Data
This section collects any data citations, data availability statements, or supplementary materials included in this article.


