Capsule summary
Determination of metabolic changes that occur following the development of and after red meat challenge in alpha-gal allergic individuals will aid in biomarkers for patient identification and targeted therapeutic development.
Keywords: Red meat allergy, alpha-gal, metabolomics, food challenge, biomarker, lipid and fatty acid metabolism
To the editor
Over the past few years, a large number of patients have been identified who experience delayed anaphylaxis or urticaria following eating red meat and who have IgE antibodies to the oligosaccharide galactose alpha-1,3-galactose (alpha-gal) 1-3. Patients with this alpha-gal syndrome (AS) had tolerated mammalian products prior to onset of the disease and in many cases recall tick bites prior to sensitization 2,4. Many anecdotal reports suggest that glycolipids may be as important as glycoproteins in the clinical episodes. Furthermore, delayed absorption and processing of glycolipids could provide a rational explanation for the delay in onset of symptoms.
To investigate the cause of the delay, we carried out metabolomic analysis, the study of the unique chemical fingerprints of cellular process, of 449 biochemicals, which are the chemical compounds that make up a living cell, on blood samples obtained before and after challenge with pork in 8 allergic subjects and 7 controls 5. We report the results of the analysis at baseline as well as at 2, 4, and 6 hours after challenge (see Table E1 for patient characteristics and online supplement for methods). There were no differences in the ages of the groups, however a significant difference was noted in total IgE (meat allergic 179±30 vs control 63.3±29.8: p<0.02). When individual components of IgE were measured, only the meat allergic group had measureable levels of IgE to alpha-gal, beef, pork and cow’s milk.
Serum was collected from subjects who underwent meat challenge at 0, 2, 4 and 6 hr time points and metabolomic analysis of 449 biochemicals was performed. Table E2 shows the number of biochemicals significantly different (p<0.05) or those approaching significance (0.05<p<0.10) after correction for multiple comparisons using False Discovery Rate in the control and meat allergic subjects. The overall changes were greater in the control group with 84 and 108 significant changes at the 4 and 6 hr time points compared to 63 and 89 changes in the meat allergic group. Comparison of the groups at baseline revealed 23 biochemicals that were significantly different. Further biochemical differences were observed between groups during the challenge with 21, 16 and 25 differences detected at the 2, 4 and 6 hr time points, respectively.
To identify biomarkers related to AS meat allergy, a random forest analysis was performed. A predictive accuracy of 56.3% at baseline that rose to 62.5% by 6 hours was observed (Figure E1A). These values are greater than random chance (50%) suggesting they may be useful in stratifying patient groups. Figure E1B lists the top 30 metabolites based on their importance in separating these populations at 6 hours. Principle component analysis (Figure E2) revealed considerable overlap between groups and time points, suggesting minor metabolic differences in amino acids, lipids, glucose metabolism and bile acids may contribute to the meat allergic phenotype. Some components used for analysis were not statistically significant, but reflect consistent changes in pathways. To test for interaction, two-way ANOVA with repeated measures was performed (Table E3) and 20 biochemicals (Table E4) were significantly different (p<0.05) for meat allergic status and 32 biochemicals (Table E5) for meat allergic status and time post-feeding.
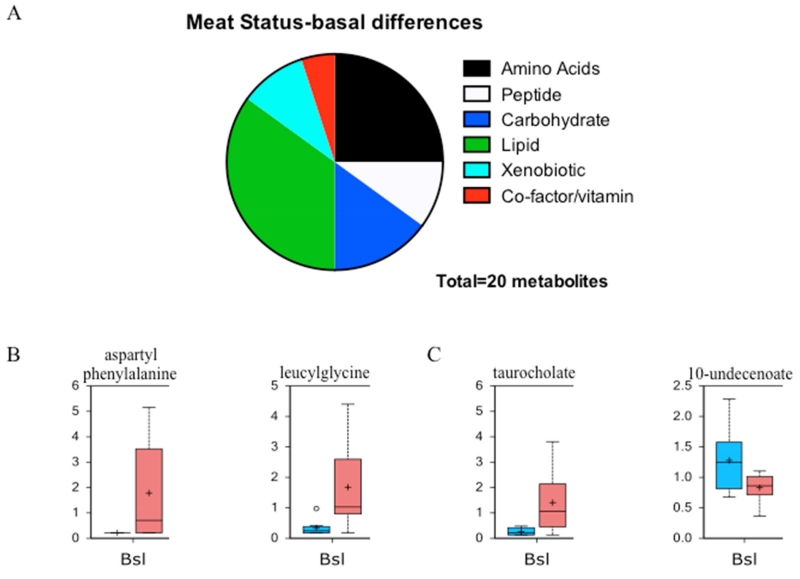
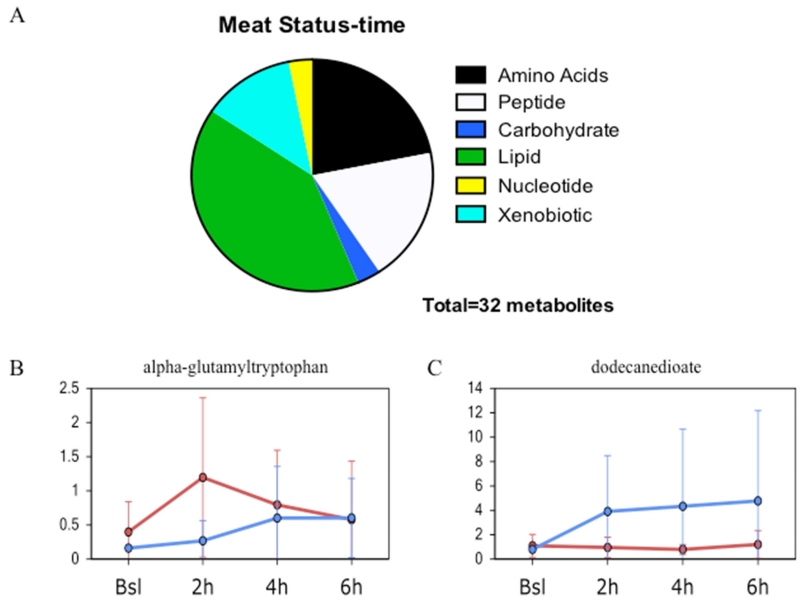
We posited that basal differences in metabolism could be detected between meat allergic and healthy control groups. Of the 449 metabolites analyzed, 20 were significantly different between the groups. Figure 1A illustrates the distribution of metabolites in the biochemical pathways with the biggest differences observed in amino acid/peptide and lipid metabolism. Two examples for each of the amino acid/peptide (Fig 1B) and lipid (Fig 1C) pathways are shown depicting the differences in metabolite levels with increases found in the meat allergic group. Two-way ANOVA identified potential interactions between variables. Of the 449 metabolites, 32 showed significant interaction between meat allergy status and time. Figure 2A illustrates the distribution of metabolites, again with the biggest differences being observed in amino acid/peptide and lipid metabolism pathways. In Figures 2B and 2C, the metabolite levels for two compounds are presented for the time course of the food challenge in healthy control and meat allergic subjects.
Figure 1. Baseline metabolomic differences between meat allergic and control subjects.
A. Differentially expressed metabolites between control and meat allergic subjects displaying the major metabolic pathways and proportion altered. B. Representative box plots showing basal expression levels of two peptides aspartylphenylalanine and leucylglycine that were significantly different (p<0.05). C. Representative box plots showing the basal expression levels of two lipids taurocholate and 10-undecenoate that were significantly different (p<0.05). The blue box is control and red box meat allergic with the box representing the upper and lower quartiles, the black bar being the median and the whiskers representing the maximum and minimum of distribution.
Figure 2. Time-dependent differences between meat allergic and control subjects following meat challenge.
A. Metabolites differentially expressed at baseline showing interaction between meat allergic status and time after challenge with major metabolic pathways and proportion altered displayed. B. Representative line plot showing the time dependent change in expression of the peptide alpha-glutamyltrytophan that showed significant interaction (p<0.05). C. Representative line plot showing the time dependent change in expression of the lipid dodecanedioate that showed significant interaction (p<0.05). The blue line is control and red line meat allergic with the circle representing the mean value and the whiskers representing ± one standard deviation.
The most dysregulated pathways at baseline and following meat challenge were in lipid and fatty acid metabolism (Figures 1 and 2). Multiple fatty acids including caprylate and stearate accumulated in control serum, but not meat allergic, following meat consumption and were over represented by 6 hours. These trends could signal alterations in fat hydrolysis, absorption and/or lipid oxidation that lead to the delay in symptoms observed in the meat allergic group. Carnitine conjugated lipids were also lower in allergic compared to control individuals and may reflect reduced fatty acid transport into the mitochondria. Bile acids facilitate the secretion, absorption and transport of lipids. Higher levels of 7-alpha-hydroxycholaterol and reduced lathosterol were found following challenge in the allergic group and suggests cholesterol availability for hormone synthesis would be diminished. This observation is supported by reduced levels of multiple steroids including cortisol and cortisone by 6 hours. Alpha-gal is present in mammals on both glycoproteins and glycolipids, including chylomicrons. We have speculated that the delay in symptoms is due to a delay in the appearance of small lipid bilayer vesicles carrying multiple alpha-gal epitopes with LDL in circulation. Chylomicrons enter circulation via the thoracic duct through a process that takes several hours. Alterations in lipid and fatty acid metabolism observed in this study are consistent with the clinical delay.
A potential limitation of this study is the small sample size included in each group. Inclusion of more subjects would increase the number of metabolites that are different not only at baseline, but also following meat challenge. It seems that the important systems would be identified in the initial screen and other metabolites identified by increased screening would be downstream products of these dysregulated pathways. Along these lines, larger metabolic panels might have identified other important compounds and pathways. An additional concern is that subjects selected for meat challenge had mild symptoms and those with previous anaphylactic episodes were excluded. For safety reasons these subjects could not be challenged. Other control groups might be useful such as food, but not meat allergic individuals challenged with meat and food, but not meat allergic individuals challenged with the food they are allergic.
In summary, metabolomic analysis of subjects with red meat allergy related to high levels of IgE to alpha-gal identified basal and food-induced differences following challenge with red meat that were not observed in healthy subjects. These observations suggest that meat allergy is accompanied by disruptions in amino acid catabolism, lipid and carbohydrate metabolism and synthesis of bile acids that may reflect differences in the microbiome and nutrient absorption. These metabolic changes are likely to contribute to symptoms through alterations of components of the allergic response.
Supplementary Material
Acknowledgments
Funding
This work was supported by National Institutes of Health grants K08 AI085190 (to S.P.C.), R01 AI-20565 (to T.A.E.P.-M.), and R21 AI087985 (to S.P.C. and T.A.E.P.-M.).
Abbreviations
- Alpha-gal
galactose-alpha-1,3-galactose
- GC/MS
gas chromatography/mass spectrometry
- IDO
indole 2,3-dioxygenase
- IFN
interferon
- TNF
tumor necrosis factor
Footnotes
Publisher's Disclaimer: This is a PDF file of an unedited manuscript that has been accepted for publication. As a service to our customers we are providing this early version of the manuscript. The manuscript will undergo copyediting, typesetting, and review of the resulting proof before it is published in its final citable form. Please note that during the production process errors may be discovered which could affect the content, and all legal disclaimers that apply to the journal pertain.
Disclosure of potential conflict of interest: The authors declare that they have no relevant conflicts of interest.
Bibliography
- 1.Chung CH, Mirakhur B, Chan E, Le QT, Berlin J, Morse M, et al. Cetuximab-induced anaphylaxis and IgE specific for galactose-alpha-1,3-galactose. N Engl J Med. 2008;358:1109–17. doi: 10.1056/NEJMoa074943. [DOI] [PMC free article] [PubMed] [Google Scholar]
- 2.Commins SP, Satinover SM, Hosen J, Mozena J, Borish L, Lewis BD, et al. Delayed anaphylaxis, angioedema, or urticaria after consumption of red meat in patients with IgE antibodies specific for galactose-alpha-1,3-galactose. J Allergy Clin Immunol. 2009;123:426–33. doi: 10.1016/j.jaci.2008.10.052. [DOI] [PMC free article] [PubMed] [Google Scholar]
- 3.Commins SP, James HR, Kelly LA, Pochan SL, Workman LJ, Perzanowski MS, et al. The relevance of tick bites to the production of IgE antibodies to the mammalian oligosaccharide galactose-alpha-1,3-galactose. J Allergy Clin Immunol. 2011;127:1286–93. e6. doi: 10.1016/j.jaci.2011.02.019. [DOI] [PMC free article] [PubMed] [Google Scholar]
- 4.Steinke JW, Platts-Mills TA, Commins SP. The alpha-gal story: lessons learned from connecting the dots. J Allergy Clin Immunol. 2015;135:589–96. doi: 10.1016/j.jaci.2014.12.1947. quiz 97. [DOI] [PMC free article] [PubMed] [Google Scholar]
- 5.Commins SP, James HR, Stevens W, Pochan SL, Land MH, King C, et al. Delayed clinical and ex vivo response to mammalian meat in patients with IgE to galactose-alpha-1,3-galactose. J Allergy Clin Immunol. 2014;134:108–15. e11. doi: 10.1016/j.jaci.2014.01.024. [DOI] [PMC free article] [PubMed] [Google Scholar]
Associated Data
This section collects any data citations, data availability statements, or supplementary materials included in this article.


