Abstract
Despite the technological advancement in the biomedical science, cancer remains a life-threatening disease. In this study, we designed an anticancer nanodelivery system using graphene oxide (GO) as nanocarrier for an active anticancer agent gallic acid (GA). The successful formation nanocomposite (GOGA) was characterized using XRD, FTIR, HRTEM, Raman, and UV/Vis spectroscopy. The release study shows that the release of GA from the designed anticancer nanocomposite (GOGA) occurs in a sustained manner in phosphate-buffered saline (PBS) solution at pH 7.4. In in vitro biological studies, normal fibroblast (3T3) and liver cancer cells (HepG2) were treated with different concentrations of GO, GOGA, and GA for 72 h. The GOGA nanocomposite showed the inhibitory effect to cancer cell growth without affecting normal cell growth. The results of this research are highly encouraging to go further for in vivo studies.
Keywords: Drug delivery systems, Graphene oxide, Gallic acid, Controlled-release, Cytotoxicity
Background
Despite concerted research effort to fight various diseases to improve human health, cancer still remains as one of the biggest challenges for human beings [1, 2]. Two major methods can be used to overcome this problem. The first is to develop and synthesize new anticancer drugs. And the second is to develop new and effective delivery systems with the ability to improve the therapeutic profile and efficacy of existing therapeutic agents [3, 4]. Therefore, various nanocarrier-based therapeutic and diagnostic agents such as liposome, carbon nanotubes, polymeric nanoparticles, and dendrimers have been extensively studied to prolong the half-life of drug systemic circulation and lower frequency of administration to minimize systemic side effects of drugs. Drugs can be loaded or attached via different mechanisms, such as embedding, physical absorption, and hydrogen-bonding interactions [5] resulting in the sustained release of drugs over longer periods of time [2, 6, 7].
Recently, graphene and its chemically oxidized derivative, graphene oxide (GO) (a 2D hydrophilic carbon material) [8–11], have been investigated for targeted drug delivery for cancer therapy [12–19], biosensing, and cancer photothermal therapy, as they have a proportionally large surface area than many other materials, ample functional groups on the surface, good photothermal properties, and/or low cytotoxicity [20, 21]. The amphiphilic and planar structure of GO enable it to incorporate hydrophilic and/or hydrophobic biomolecules which gives the opportunity to prevent its instability in a medium [15, 18, 22]. In addition, the large surface area and oxygen-containing functional groups of GO such as phenol hydroxyl, epoxy, and carboxylic groups make it ideal for providing high drug loading efficiency, good dispersion, and easily functionalization [2, 23].
Gallic acid (GA), a polyhydroxylphenolic compound, which has a wide range of biological applications such as antiviral, antibacterial, antimelanogenic, antimutagenic, anti-inflammatory, and anticancer activity, in a range of cells is distributed in a variety of fruits, plants, and foods [24–29]. In this study, we have selected GA as a model drug to be loaded onto the as-prepared GO nanocarrier to form a new nanocomposite (GOGA) for active drug delivery and specific cell targeting system in normal fibroblasts (3T3) and in liver cancer cells, HepG2. The results from the X-ray diffraction (XRD), Fourier transform infrared (FTIR), Raman spectroscopy, TGA/DTG, anticancer evaluation, and cytotoxicity as well as release property of GA from GOGA nanocomposite into aqueous media will be also discussed.
Methods
Materials
Graphite flakes with 100 meshes (Sigma), potassium permanganate (99 %), sulphuric acid (95–97 %), hydrochloric acid (37 %), diethyl ether, ortho-phosphoric acid (85 %) and hydrogen peroxide (35 %) by Riendemann chmidt, gallic acid (97 % purity) (Sigma-Aldrich), and ethyl alcohol (99.7 % v/v) (Hayman) were used in this work. All the aqueous solutions were prepared using deionized water (18.2 M Ω cm−1).
Characterization
The synthesized products were characterized by powder X-ray diffraction (XRD-6000 diffractometer, Shimadzu, Tokyo, Japan), with CuKα radiation (λ = 1.5406 Å) at 40 kV and 30 mA. FTIR (Thermo Nicolet model Nicolet 6700) was performed using the KBr disc method. Raman spectra were collected using a UHTS 300 Raman spectrometer (WITec, Germany) with an excitation wavelength at 532 nm. The structures of the GO nanocarrier and GOGA nanocomposite were observed on a high-resolution transmission electron microscope (HRTEM), Tecnai G2 (FEI, USA). The samples were prepared by placing a drop of a sonicated dispersion on a carbon grid and dried at 37 °C for 24 h. The controlled release properties and the loading capacity were studied using a Lambda 35 spectrophotometer (PerkinElmer, Boston, MA).
Preparation of GO Nanocarrier and GOGA Nanocomposite
Graphene oxide was synthesized from graphite (Gr) by the improved Hummers method [30]. A 9:1 mixture of concentrated H2SO4/H3PO4 (360:40 mL) was added to a mixture of graphite flakes (3.0 g, 1 wt equiv) and KMnO4 (18.0 g, 6 wt equiv). The reaction was then heated to 50 °C and stirred for 12 h. The reaction was cooled to room temperature and poured onto ice (400 mL) with 30 % H2O2 (3 mL). The obtained suspension was centrifuged at 4000 rpm for 5 min and then washed with 200 mL of deionized water (DIW), 200 mL of HCl (37 %), and then with 200 mL of ethanol, respectively. The obtained product was coagulated with 200 mL of diethyl ether and then filtered by Omnipore™ membrane with a 0.2-μm pore size. The obtained GO on the filter was dried in an oven at 40 °C [30]. A 1 % of pure drug (GA) was dissolved in DIW and 0.1 g of GO was added and the pH fixed at 4.71. The mixture was stirred for 16 h and then washed with DIW to remove unreacted drug. The GOGA nanocomposite was collected via filtration and dried in an oven at 40 °C.
In Vitro Cytotoxicity Experiment
The normal mouse fibroblast cell lines 3T3 and human hepatocellular liver carcinoma cell lines HepG2 were obtained from American Type Culture Collection (ATCC, VA, USA), and these cells were cultured in DMEM and RPMI medium (Nacalai, Japan) supplemented with 10 % (v/v) fetal bovine serum (FBS) and 1 % antibiotic solution, respectively. To determine the cell viability, healthy viable cells were seeded to cell culture plates (1 × 10⁴) once reach the 80 % of confluency in a cell culture flask and seeded cells were allowed to adhere overnight earlier to the nanocompound treatment with different doses (0.781–50 μg/mL). The cells without any treatment were served as a negative control, and another set of cells were treated with vehicle control (0.1 % dimethyl sulfoxide (DMSO)). Treated cells were incubated for 72 h; after the incubation period, cell counting reagent (CCK-8 solution; Dojindo Lab, Japan) was then added to each cell culture well and placed in an incubator for 3 h at 37 °C in a humidified atmosphere with 5 % CO2. After the incubation period with cell counting reagent, the 96-well cell culture plates were measured at 450 nm by a microplate reader (BioTek Instruments Inc., VT, USA). The cell viability percentage was determined according to the kit protocol, and cell viability percentage was plotted on a graph.
Drug-Release Procedure
To study the controlled-release characteristics of GA loaded on GOGA nanocomposite, a pH 7.4 solution was used, which has a similar pH of blood. Various studies show that different anions such as HPO4 −2 and H2PO4 − have an affect on the rate of drug release [31–33]. The release rate of GA from GOGA nanocomposite was carried out by adding 14 mg of GOGA nanocomposite into 10 mL of phosphate-buffered solution (pH = 7.4) and used after 10 days. The accumulated release amount of GA from GOGA nanocomposite was measured at λ max = 264 nm at room temperature.
Results and Discussion
X-ray Diffraction
Figure 1 depicts XRD patterns of pristine graphite (Gr), GO nanocarrier, and GOGA nanocomposite. The diffraction pattern of pure Gr (Fig. 1(a)) shows a very intense, sharp peak at 2θ = 26.27°, attributed to the diffraction of the (002) graphite plane composed of highly organized layers with an interlayer spacing of 0.34 nm [34, 35]. After oxidative exfoliation of Gr, the characteristic peak of Gr was no longer visible and a new strong sharp peak at 2θ = 10.15° was observed which is attributed to the diffraction of the (001) for GO (Fig. 1(b)). An increase in the interlayer distance of GO (0.87 nm) might be due to the exfoliation of Gr layers and the formation of oxygen-containing functional groups such as hydroxyl, epoxy, and carboxyl [36], as well as the intercalated water molecules on the surface of GO interlayer’s [37, 38]. The inset shows the XRD patterns of pure GA with several intense and sharp crystalline peaks at 2θ values of 16.22°, 25.36°, and 27.64°, corresponding to the characteristic of an organic molecule with crystalline property [39]. In contrast, GOGA nanocomposite (Fig. 1(c)) shows amorphous characteristic, lacking of crystalline peaks in contrast to the XRD patterns of pure drug, GA. Since the characteristic peaks of GA were not observed in the XRD patterns of GOGA nanocomposite, it proved that the loading of the drug to the GO carrier has taken place. The successful formation of GOGA nanocomposite was further confirmed by other complimentary techniques such as FTIR, Raman, and UV-visible spectroscopy, which will be discussed in other sections. Moreover, the result shows that there are no big difference between the diffractograms of GO and GOGA nanocomposite, confirming that the loading procedure did not affect the phase change in the resulting GO nanocarrier.
Fig. 1.
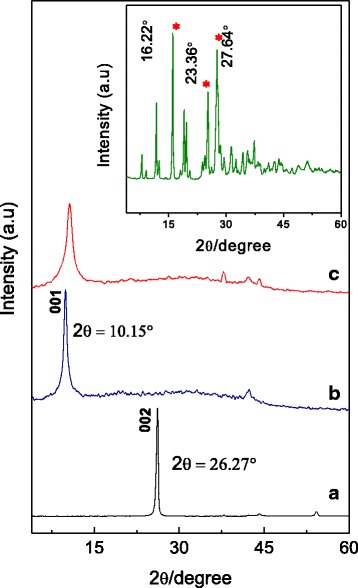
XRD patterns of Gr (a), GO nanocarrier (b), and GOGA nanocomposite (c). The inset shows the XRD patterns of pure GA
Infrared Spectroscopy
Figure 2 shows the FTIR spectra of pure Gr, GO, and GOGA nanocomposite. Pure Gr spectrum (Fig. 2(a)) shows a broad peak at 3449 cm−1 attributed to the existence of moisture in the pristine Gr [34]. The peak at 1635 cm−1 is assigned to stretching vibrations of C=C bonds. Figure 2(b) shows an intense broad peak for GO nanocarrier at 3422 cm−1 due to the stretching –OH band. The existence of –OH groups in GO can be bonded to the various sites of the carbon skeleton, resulting in the broadening of the peak [40]. The peak at 1730 cm−1 is attributed to the stretching vibration of C=O bonds presence in carboxylic acid and carbonyl groups. The low intensity C=C bonds at 1627 cm−1 corresponding to remaining sp2 character of graphite [41]. In addition, the peaks in the region of 1362 to 1049 cm−1 might be due to the COC/COH bonds [40]. Figure 2(c) indicates the characteristic bands of pure GA at 3286 cm−1 (acidic O–H stretching), 1712 cm−1 (presence of phenol group), 1617 cm−1 (C=C stretching vibration of aromatic ring), 1247 cm−1 (presence of carboxylic groups), 1026 cm−1 (C–O stretching of carboxylic group), and 731 cm−1 (δCC benzene ring vibrations) [42, 43].
Fig. 2.
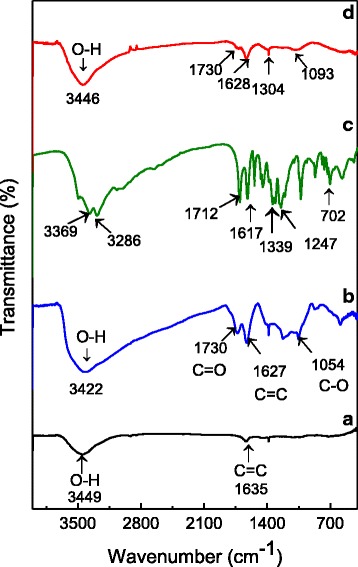
Fourier transform infrared spectra for a Gr, b GO, c GA, and d GOGA nanocomposite
The peak observed in Fig. 2(d) for GOGA nanocomposite at around 3446 cm−1 can be assigned to the O–H functional groups from carboxyl or phenols. After loading of the drug, GA into GO nanocarrier with the characteristic bands of 1730 and 1628 cm−1 with lower intensity still remained. The infrared spectrum of GOGA nanocomposite (Fig. 2(d)) shows the characteristic peaks of both GO nanocarrier and GA which suggest the successful formation of the nanocomposite.
Raman Spectroscopy
Raman spectroscopy was used to analyze the disorder and defects in crystal structure of graphite and its derivative (GO). In order to obtain disorder, the intensity ratio between the disorder-induced D band and the G band (ID/IG) can be measured. Previous works proved that the ID/IG ratio strongly depends on the amount of disorder in the graphitic material [44]. The Raman spectrum of Gr, GO, and GOGA nanocomposite is shown in Fig. 3. It is clear that significant structural changes took place during the chemical transformation from Gr to GO (Fig. 3(a, b)). Usually, all sp2 carbon forms have the G band, which appears from the first-order Raman scattering [45–47]. The G band is observed at 1579, 1601, and 1599 cm−1, while the D band is distinguished at 1352, 1355, and 1353 cm−1 for Gr, GO, and GOGA nanocomposite, respectively. The D band corresponded to the presence of disorder in the sp2 carbon network, and broadening of D bands in GO can be due to a decrease of the sp2 domain size, caused by the creation of defects, vacancies, and distortions during oxidation [48]. The 2D band (G′ band) appears at 2706, 2902, and 2933 cm−1 in Raman spectrum corresponding to the second-order dispersive Raman mode for the Gr, GO, and GOGA nanocomposite, respectively [46, 49]. Raman spectra of GO and GOGA nanocomposite (Fig. 3(b, c)) show no significant shift in the D band and G band. The increase of ID/IG of the GO nanocarrier (0.96) when compared to the Gr (0.84) confirms that grafting of oxygen-containing functional groups to the graphitic planes has taken place [48].
Fig. 3.
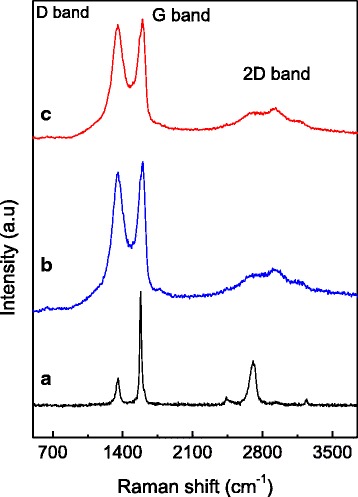
Raman spectra of Gr (a), GO (b), and GOGA nanocomposite (c)
Morphology Study Using HRTEM
High-resolution electron microscopy (HRTEM) was used to further elucidate the morphology and dispersion of the compounds. Figure 4 shows the HRTEM images of the GO nanocarrier and GOGA nanocomposite. It was revealed that the large sheets in GO (Fig. 4a, b,) tend to agglomerate to each other, forming a multilayered agglomerate. These sheets resemble a wavy silk veil, transparent, and entangled with one another [40]. The HRTEM images of GOGA nanocomposite (Fig. 4c, d) show GO forms similar to agglomerate multilayer sheets, with the drug loaded into the surface of GO nanocarrier.
Fig. 4.
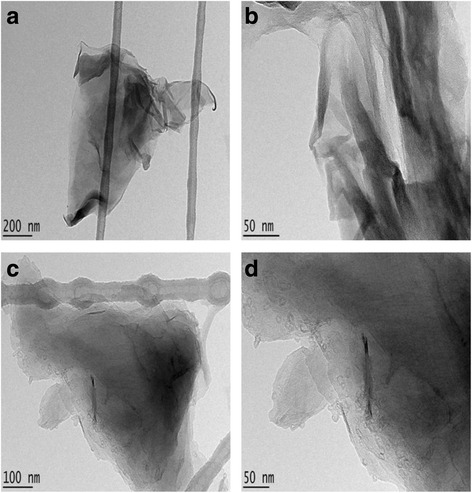
HRTEM images of a GO nanocarrier with 200 nm bar, b GO nanocarrier with 50 nm bar, c GOGA nanocomposite with 100 nm bar, and d GOGA nanocomposite with 50 nm bar
Loading and Release Behavior of GA
The release profiles of GA from a physical mixture of (GO-GA) and the GA from GOGA nanocomposite into phosphate-buffered solution at pH 7.4 (blood pH) are shown in Fig. 5. The fast release of GA from the physical mixture was completed within 7 min at pH 7.4 (Fig. 5a). This is due to the low electrostatic attraction between the GA anions and GO nanocarrier. Figure 5b shows that the cumulative release rate of GA into buffered solution at pH 7.4 is significantly slower and sustained which is presumably due to the anion-exchange process taking place between the GA anions and the anions in the buffered solutions [50]. In addition, the initial burst release [51] observed in the first 1 h (59 %) can be due to the surface characteristics of GO material, the drug interactions, or/and morphology and porous structure of the material [51]. The maximum percentage release of GA from the GOGA nanocomposite reached 81 % in about 7200 min (or 5 days) at pH 7.4. From the calibration curve equation and using the ultraviolet instrument, 12 % GA loaded to the GO nanocarrier can be obtained. As such, the percentage of GA released from GOGA nanocomposite at equilibrium did not reach 100 %, which can be attributed to the characteristics of the ion-exchange reaction mechanism, i.e., the loaded anions cannot be exchanged completely at equilibrium, but the organic species released was removed continuously [52]. These results show that the GOGA nanocomposite has a good potential to be used as a drug delivery system with controlled sustained release property.
Fig. 5.
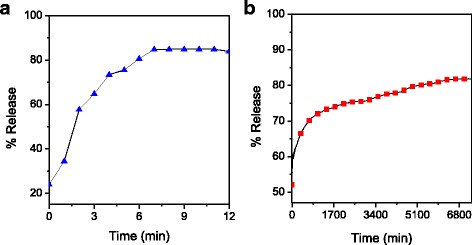
Release profiles for a physical mixture of GA and b GOGA nanocomposite in phosphate-buffered solution at pH 7.4
Release Kinetics of GA from GOGA Nanocomposite
The kinetic release of GA from the GOGA nanocomposite was fitted using a number of different kinetic models, such as pseudo-first order (Eq. 1), pseudo-second order (Eq. 2), parabolic diffusion (Eq. 3), Higuchi Model (Eq. 4), and Korsmeyer-Peppas Model (Eq. 5) [53, 54]. The equations are shown below
| 1 |
| 2 |
| 3 |
| 4 |
| 5 |
where k is the corresponding release amount constant, q e and q t are the equilibrium release amount and the release amount at time t, respectively, and M 0 and M t represent the drug (GA) content remaining in the GO nanocarrier at release times 0 and t, respectively.
The Higuchi equation plot (Fig. 6d) with correlation coefficient (R 2 = 0.9550) shows the release of the drug from the GOGA matrix a square root of time and is dependent on Fickian diffusion. The results (Fig. 6 and Table 1) indicated that the release of the active drug, GA, from the GOGA nanocomposite followed the pseudo-second-order kinetic model, with a best fit value for the correlation coefficient (R 2 = 0.9989), as shown in Fig. 6 and Table 1. In addition, the t 1/2 time release of GA into phosphate-buffered solution at pH 7.4 was 203 min using pseudo-second-order kinetic model (Table 1).
Fig. 6.
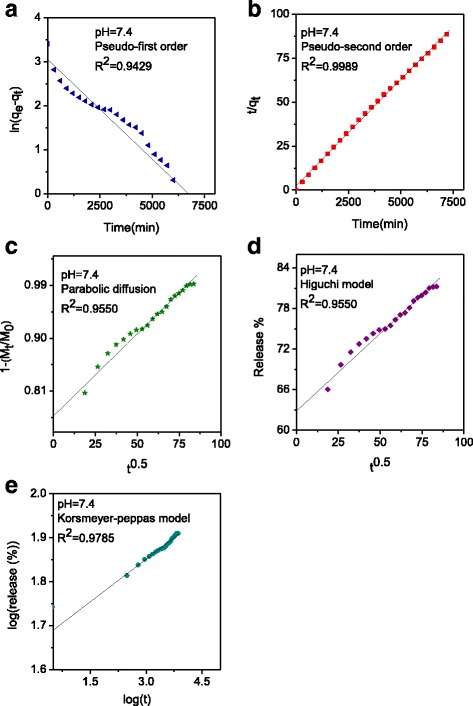
Fitting the data of GA release from GOGA nanocomposite at pH 7.4 for kinetic models a pseudo-first order, b pseudo-second order, c parabolic diffusion, d Higuchi model, and e korsmeyer-peppas model
Table 1.
Correlation coefficients (R 2), rate constant (k), and half-time (t 1/2) obtained by fitting the GA release data from the GOGA nanocomposite into phosphate-buffered solution at pH 7.4
| Aqueous solution | Saturated release (%) | R 2 | Rate constant (k)a (mg/min) | t 1/2 a (min) | ||||
|---|---|---|---|---|---|---|---|---|
| Pseudo-first order | Pseudo-second order | Parabolic diffusion | Higuchi model | Korsmeyer-peppas model | ||||
| pH 7.4 | 83.1 | 0.3294 | 0.9832 | 0.9550 | 0.9550 | 0.9785 | 2.42 × 10⁻⁴ | 203 |
aEstimated using pseudo-second-order kinetics
Inhibition of Cancer Cell Growth by the Nanocompound
The potential cytotoxicity of GO carrier, GA, and GOGA nanocomposite on proliferation of normal fibroblast cells and cancer cells on preliminary screening results is shown in Fig. 7. In the normal fibroblast cells (Fig. 7a), we did not notice any cytotoxicity effect up to the highest concentration of 50 μg/mL. Therefore, the GOGA nanocomposite is safe to use for further experiments. In the liver cancer cells (Fig. 7b), the percentages of viable cells were decreased in a dose-dependent manner. The results show that GO nanocarrier had a negligible effect in liver cancer cells, with almost 100 % of cells remaining viable at 50 μg/mL compared with about 48 % of cells remaining viable for GOGA nanocomposite. Thus, the cytotoxicity to the liver cells is likely attributable to the release of GA from the GO carrier rather than the effect of the carrier itself. This result shows that the anticancer activity of our new nanocomposite is very similar to that of pure GA and suggests the possibility of a decreased dosing interval due to the sustained-release ability of the nanocomposite. With the sustained release and possible targeted delivery potential of GOGA nanocomposite, the least amount of active agent (GA) could suffice, hence reducing the dosing interval and unnecessary exposure to large quantities of this hazardous drug.
Fig. 7.
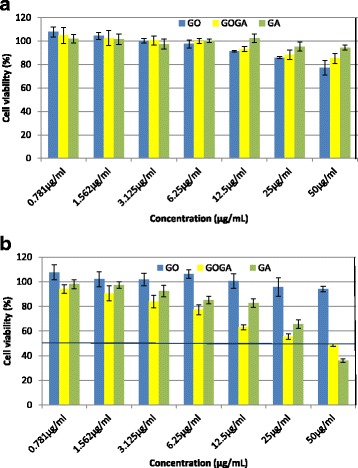
Cytotoxic effects of GO, GOGA, and GA on the normal fibroblast cells and HepG2 liver cancer cells. Normal fibroblast cells 3T3 (a) and HepG2 (b) cells were treated with different doses of carrier, pure drug, and GOGA nanocomposite for 72 h and cytotoxicity was measured using a CCK-8 assay kit and the results were calculated according to the kit protocol and results are expressed as mean ± SD
The results further suggest the possibility of increased anticancer activity with increasing the loading percentage. The IC50 values are 429.5, 42.9, and 38.9 μg/mL for GO nanocarrier, GOGA nanocomposite, and GA, respectively. These results have suggested that GO-based nanocarrier is one of the good candidates for drug delivery system against cancer cells, without showing noticeable cytotoxicity in normal fibroblast cells.
Conclusions
In this study, we report the design and synthesis of an anticancer nanodelivery systems based on a graphene oxide-gallic acid nanocomposite. The empty carrier GO and designed anticancer nanocomposite (GOGA) was found to be highly biocompatible with normal fibroblast cells. The designed GOGA nanocomposite showed good anticancer activity against liver cancer (HepG2) cells. The results show that cytotoxicity to the liver cells is likely attributable to the release of GA from the carrier rather than the effect of the carrier itself. And due to the similar anticancer activity of our new nanocomposite to that of pure GA, the possibility of a decreased dosing interval due to the sustained-release ability of the nanocomposite can be suggested. Therefore, the least amount of active drug (GA) could suffice, hence reducing the dosing interval and unnecessary exposure to large quantities of this drug. Sustained release of active agent (GA) over longer period of time (6800 min) will increase the viability of drug and would ultimately result in better therapeutic efficacy and decreasing in drug dosing frequency. These in vitro studies have encouraged this research towards the next level of in vivo studies.
Acknowledgements
The authors would like to thank the University Putra Malaysia and the Ministry of Higher Education of Malaysia (MOHE) for the research funding under the NANOMITE research grant vote nos. 5526300 and 9443100 for supporting this research.
Authors’ Contributions
DD performed the experiment, interpreted the data, processing and drafted the manuscript. BS, FB, PA and SF participated in the coordination of the study, prepare and characterize the samples and analyzed the data. MZBH is the principal investigator of this research project under NANOMITE grant. LJT critically reviewed the manuscript, evaluate and edit the manuscript. All authors read and approved the final manuscript.
Competing Interests
The authors declare that they have no competing interests.
Abbreviations
- DMSO
Dimethyl sulfoxide
- FTIR
Fourier transform infrared
- GA
Gallic acid
- GO
Graphene oxide
- GOGA
Graphene oxide which loaded with gallic acid
- GO-GA
Physical mixture of graphene oxide-gallic acid
- Gr
Graphite
- HRTEM
High-resolution transmission electron microscopy
- PBS
Phosphate-buffered saline
- XRD
X-ray diffraction
Contributor Information
Dena Dorniani, Email: d.dorniani@sheffield.ac.uk, Email: dena_dorniani@yahoo.com.
Bullo Saifullah, Email: bullosaif1@gmail.com.
Farahnaz Barahuie, Email: farah2424@gmail.com.
Palanisamy Arulselvan, Email: arulselvan@upm.edu.my.
Mohd Zobir Bin Hussein, Email: mzobir@upm.edu.my.
Sharida Fakurazi, Email: sharida@upm.edu.my.
Lance J. Twyman, Email: l.j.twyman@sheffield.ac.uk
References
- 1.Orecchioni M, Cabizza R, Bianco A, Delogu LG. Graphene as cancer theranostic tool: progress and future challenges. Theranostics. 2015;5:710–723. doi: 10.7150/thno.11387. [DOI] [PMC free article] [PubMed] [Google Scholar]
- 2.Ma N, Zhang B, Liu J, Zhang P, Li Z, Luan Y. Green fabricated reduced graphene oxide: evaluation of its application as nano-carrier for pH-sensitive drug delivery. Int J Pharm. 2015;496:984–992. doi: 10.1016/j.ijpharm.2015.10.081. [DOI] [PubMed] [Google Scholar]
- 3.Wang J, Liu C, Shuai Y, Cui X, Nie L. Controlled release of anticancer drug using graphene oxide as a drug-binding effector in konjac glucomannan/sodium alginate hydrogels. Colloids Surf B: Biointerfaces. 2014;113:223–229. doi: 10.1016/j.colsurfb.2013.09.009. [DOI] [PubMed] [Google Scholar]
- 4.Liu J, Cui L, Losic D. Graphene and graphene oxide as new nanocarriers for drug delivery applications. Acta Biomater. 2013;9:9243–9257. doi: 10.1016/j.actbio.2013.08.016. [DOI] [PubMed] [Google Scholar]
- 5.Burger KN, Staffhorst RW, de Vijlder HC, Velinova MJ, Bomans PH, Frederik PM, et al. Nanocapsules: lipid-coated aggregates of cisplatin with high cytotoxicity. Nat Med. 2002;8:81–84. doi: 10.1038/nm0102-81. [DOI] [PubMed] [Google Scholar]
- 6.Ochekpe NA, Olorunfemi PO, Ngwuluka NC. Nanotechnology and drug delivery part 2: nanostructures for drug delivery. Trop J Pharm Res. 2009;8:275–287. [Google Scholar]
- 7.Sahoo SK, Labhasetwar V. Nanotech approaches to drug delivery and imaging. Drug Discov Today. 2003;8:1112–1120. doi: 10.1016/S1359-6446(03)02903-9. [DOI] [PubMed] [Google Scholar]
- 8.Higginbotham AL, Lomeda JR, Morgan AB, Tour JM. Graphite oxide flame-retardant polymer nanocomposites. ACS Appl Mater Interfaces. 2009;1:2256–2261. doi: 10.1021/am900419m. [DOI] [PubMed] [Google Scholar]
- 9.Hummers WS, Jr, Offeman RE. Preparation of graphitic oxide. J Am Chem Soc. 1958;80:1339–1339. doi: 10.1021/ja01539a017. [DOI] [Google Scholar]
- 10.Lerf A, He H, Forster M, Klinowski J. Structure of graphite oxide revisited. J Phys Chem B. 1998;102:4477–4482. doi: 10.1021/jp9731821. [DOI] [Google Scholar]
- 11.Dreyer DR, Park S, Bielawski CW, Ruoff RS. The chemistry of graphene oxide. Chem Soc Rev. 2010;39:228–240. doi: 10.1039/B917103G. [DOI] [PubMed] [Google Scholar]
- 12.Akhavan O, Ghaderi E, Aghayee S, Fereydooni Y, Talebi A. The use of a glucose-reduced graphene oxide suspension for photothermal cancer therapy. J Mater Chem. 2012;22:13773–13781. doi: 10.1039/c2jm31396k. [DOI] [Google Scholar]
- 13.An J, Gou Y, Yang C, Hu F, Wang C. Synthesis of a biocompatible gelatin functionalized graphene nanosheets and its application for drug delivery. Mater Sci Eng C. 2013;33:2827–2837. doi: 10.1016/j.msec.2013.03.008. [DOI] [PubMed] [Google Scholar]
- 14.Depan D, Shah J, Misra R. Controlled release of drug from folate-decorated and graphene mediated drug delivery system: synthesis, loading efficiency, and drug release response. Mater Sci Eng C. 2011;31:1305–1312. doi: 10.1016/j.msec.2011.04.010. [DOI] [Google Scholar]
- 15.Hu H, Yu J, Li Y, Zhao J, Dong H. Engineering of a novel pluronic F127/graphene nanohybrid for pH responsive drug delivery. J Biomed Mater Res A. 2012;100:141–148. doi: 10.1002/jbm.a.33252. [DOI] [PubMed] [Google Scholar]
- 16.Huang P, Xu C, Lin J, Wang C, Wang X, Zhang C, et al. Folic acid-conjugated graphene oxide loaded with photosensitizers for targeting photodynamic therapy. Theranostics. 2011;1:240–250. doi: 10.7150/thno/v01p0240. [DOI] [PMC free article] [PubMed] [Google Scholar]
- 17.Justin R, Chen B. Characterisation and drug release performance of biodegradable chitosan–graphene oxide nanocomposites. Carbohydr Polym. 2014;103:70–80. doi: 10.1016/j.carbpol.2013.12.012. [DOI] [PubMed] [Google Scholar]
- 18.Maity AR, Chakraborty A, Mondal A, Jana NR. Carbohydrate coated, folate functionalized colloidal graphene as a nanocarrier for both hydrophobic and hydrophilic drugs. Nanoscale. 2014;6:2752–2758. doi: 10.1039/c3nr05431d. [DOI] [PubMed] [Google Scholar]
- 19.Weaver CL, LaRosa JM, Luo X, Cui XT. Electrically controlled drug delivery from graphene oxide nanocomposite films. ACS Nano. 2014;8:1834–1843. doi: 10.1021/nn406223e. [DOI] [PMC free article] [PubMed] [Google Scholar]
- 20.Zhang Y, Nayak TR, Hong H, Cai W. Graphene: a versatile nanoplatform for biomedical applications. Nanoscale. 2012;4:3833–3842. doi: 10.1039/c2nr31040f. [DOI] [PMC free article] [PubMed] [Google Scholar]
- 21.Goenka S, Sant V, Sant S. Graphene-based nanomaterials for drug delivery and tissue engineering. J Control Release. 2014;173:75–88. doi: 10.1016/j.jconrel.2013.10.017. [DOI] [PubMed] [Google Scholar]
- 22.Rana VK, Choi MC, Kong JY, Kim GY, Kim MJ, Kim SH, et al. Synthesis and drug-delivery behavior of chitosan-functionalized graphene oxide hybrid nanosheets. Macromol Mater Eng. 2011;296:131–140. doi: 10.1002/mame.201000307. [DOI] [Google Scholar]
- 23.Shi P, Ye N. Investigation of the adsorption mechanism and preconcentration of sulfonamides using a porphyrin-functionalized Fe3O4-graphene oxide nanocomposite. Talanta. 2015;143:219–225. doi: 10.1016/j.talanta.2015.05.013. [DOI] [PubMed] [Google Scholar]
- 24.Dorniani D, Hussein MZB, Kura AU, Fakurazi S, Shaari AH, Ahmad Z. Preparation of Fe3O4 magnetic nanoparticles coated with gallic acid for drug delivery. Int J Nanomedicine. 2012;7:5745–5756. doi: 10.2147/IJN.S35746. [DOI] [PMC free article] [PubMed] [Google Scholar]
- 25.Chanwitheesuk A, Teerawutgulrag A, Kilburn JD, Rakariyatham N. Antimicrobial gallic acid from Caesalpinia mimosoides Lamk. Food Chem. 2007;100:1044–1048. doi: 10.1016/j.foodchem.2005.11.008. [DOI] [Google Scholar]
- 26.Ghotbi MY, bin Hussein MZ. Gallate–Zn–Al-layered double hydroxide as an intercalated compound with new controlled release formulation of anticarcinogenic agent. J Phys Chem Solids. 2010;71:1565–1570. doi: 10.1016/j.jpcs.2010.08.003. [DOI] [Google Scholar]
- 27.Zuo Y, Chen H, Deng Y. Simultaneous determination of catechins, caffeine and gallic acids in green, Oolong, black and pu-erh teas using HPLC with a photodiode array detector. Talanta. 2002;57:307–316. doi: 10.1016/S0039-9140(02)00030-9. [DOI] [PubMed] [Google Scholar]
- 28.Strlič M, Radovič T, Kolar J, Pihlar B. Anti- and prooxidative properties of gallic acid in fenton-type systems. J Agric Food Chem. 2002;50:6313–6317. doi: 10.1021/jf025636j. [DOI] [PubMed] [Google Scholar]
- 29.Dorniani D, Kura AU, Hussein-Al-Ali SH, Bin Hussein MZ, Fakurazi S, Shaari AH, Ahmad Z. In vitro sustained release study of gallic acid coated with magnetite-PEG and magnetite-PVA for drug delivery system. Sci World J. 2014;2014:416354. doi: 10.1155/2014/416354. [DOI] [PMC free article] [PubMed] [Google Scholar]
- 30.Marcano DC, Kosynkin DV, Berlin JM, Sinitskii A, Sun Z, Slesarev A, et al. Improved synthesis of graphene oxide. ACS Nano. 2010;4:4806–4814. doi: 10.1021/nn1006368. [DOI] [PubMed] [Google Scholar]
- 31.Dorniani D, Kura AU, Hussein MZB, Fakurazi S, Shaari AH, Ahmad Z. Controlled-release formulation of perindopril erbumine loaded PEG-coated magnetite nanoparticles for biomedical applications. J Mater Sci. 2014;49:8487–8497. doi: 10.1007/s10853-014-8559-7. [DOI] [Google Scholar]
- 32.Saifullah B, Hussein MZ, Hussein-Al-Ali SH, Arulselvan P, Fakurazi S. Sustained release formulation of an anti-tuberculosis drug based on para-amino salicylic acid-zinc layered hydroxide nanocomposite. Chem Cent J. 2013;7:1–11. doi: 10.1186/1752-153X-7-1. [DOI] [PMC free article] [PubMed] [Google Scholar]
- 33.Dorniani D, Kura AU, Hussein-Al-Ali SH, Hussein MZ, Fakurazi S, Shaari AH, Ahmad Z. Release behavior and toxicity profiles towards leukemia (WEHI-3B) cell lines of 6-mercaptopurine-PEG-coated magnetite nanoparticles delivery system. Sci World J. 2014;2014:972501. doi: 10.1155/2014/972501. [DOI] [PMC free article] [PubMed] [Google Scholar]
- 34.Mahkam M, Rafi AA, Faraji L, Zakerzadeh E. Preparation of poly (methacrylic acid)–graphene oxide nanocomposite as a pH-sensitive drug carrier through in-situ copolymerization of methacrylic acid with polymerizable graphene. Polym-Plast Technol Eng. 2015;54:916–922. doi: 10.1080/03602559.2014.961081. [DOI] [Google Scholar]
- 35.Thakur S, Karak N. Green reduction of graphene oxide by aqueous phytoextracts. Carbon. 2012;50:5331–5339. doi: 10.1016/j.carbon.2012.07.023. [DOI] [Google Scholar]
- 36.Tong X, Wang H, Wang G, Wan L, Ren Z, Bai J, Bai J. Controllable synthesis of graphene sheets with different numbers of layers and effect of the number of graphene layers on the specific capacity of anode material in lithium-ion batteries. J Solid State Chem. 2011;184:982–989. doi: 10.1016/j.jssc.2011.03.004. [DOI] [Google Scholar]
- 37.Fu C, Zhao G, Zhang H, Li S. Evaluation and characterization of reduced graphene oxide nanosheets as anode materials for lithium-ion batteries. Int J Electrochem Sci. 2013;8:6269–6280. [Google Scholar]
- 38.Ma J, Yang M, Yu F, Zheng J. Water-enhanced removal of ciprofloxacin from water by porous graphene hydrogel. Sci Rep. 2015;5:13578. doi: 10.1038/srep13578. [DOI] [PMC free article] [PubMed] [Google Scholar]
- 39.Liu B, Zhu X, Zeng J, Zhao J. Preparation and physicochemical characterization of the supramolecular inclusion complex of naringin dihydrochalcone and hydroxypropyl-β-cyclodextrin. Food Res Int. 2013;54:691–696. doi: 10.1016/j.foodres.2013.08.007. [DOI] [Google Scholar]
- 40.Verma S, Mungse HP, Kumar N, Choudhary S, Jain SL, Sain B, Khatri OP. Graphene oxide: an efficient and reusable carbocatalyst for aza-Michael addition of amines to activated alkenes. Chem Commun. 2011;47:12673–12675. doi: 10.1039/c1cc15230k. [DOI] [PubMed] [Google Scholar]
- 41.Kuila T, Bose S, Khanra P, Kim NH, Rhee KY, Lee JH. Characterization and properties of in situ emulsion polymerized poly (methyl methacrylate)/graphene nanocomposites. Compos A: Appl Sci Manuf. 2011;42:1856–1861. doi: 10.1016/j.compositesa.2011.08.014. [DOI] [Google Scholar]
- 42.Mohammed-Ziegler I, Billes F. Vibrational spectroscopic calculations on pyrogallol and gallic acid. J Mol Struct (THEOCHEM) 2002;618:259–265. doi: 10.1016/S0166-1280(02)00547-X. [DOI] [Google Scholar]
- 43.Xu Z, Zeng H. Decomposition processes of organic-anion-pillared clays CoaMgbAl (OH)c(TA)d.n H2O. J Phys Chem B. 2000;104:10206–10214. doi: 10.1021/jp001963n. [DOI] [Google Scholar]
- 44.Zhou M, Zhai Y, Dong S. Electrochemical sensing and biosensing platform based on chemically reduced graphene oxide. Anal Chem. 2009;81:5603–5613. doi: 10.1021/ac900136z. [DOI] [PubMed] [Google Scholar]
- 45.Krishnamoorthy K, Veerapandian M, Mohan R, Kim S-J. Investigation of Raman and photoluminescence studies of reduced graphene oxide sheets. Appl Phys A. 2012;106:501–506. doi: 10.1007/s00339-011-6720-6. [DOI] [Google Scholar]
- 46.Dresselhaus MS, Jorio A, Hofmann M, Dresselhaus G, Saito R. Perspectives on carbon nanotubes and graphene Raman spectroscopy. Nano Lett. 2010;10:751–758. doi: 10.1021/nl904286r. [DOI] [PubMed] [Google Scholar]
- 47.Gurunathan S, Han JW, Dayem AA, Eppakayala V, Kim J-H. Oxidative stress-mediated antibacterial activity of graphene oxide and reduced graphene oxide in Pseudomonas aeruginosa. Int J Nanomedicine. 2012;7:5901–5914. doi: 10.2147/IJN.S37397. [DOI] [PMC free article] [PubMed] [Google Scholar]
- 48.Perumbilavil S, Sankar P, Rose TP, Philip R. White light Z-scan measurements of ultrafast optical nonlinearity in reduced graphene oxide nanosheets in the 400–700 nm region. Appl Phys Lett. 2015;107:051104. doi: 10.1063/1.4928124. [DOI] [Google Scholar]
- 49.Dresselhaus MS, Dresselhaus G, Saito R, Jorio A. Raman spectroscopy of carbon nanotubes. Phys Rep. 2005;409:47–99. doi: 10.1016/j.physrep.2004.10.006. [DOI] [Google Scholar]
- 50.Zhang H, Zou K, Sun H, Duan X. A magnetic organic–inorganic composite: synthesis and characterization of magnetic 5-aminosalicylic acid intercalated layered double hydroxides. J Solid State Chem. 2005;178:3485–3493. doi: 10.1016/j.jssc.2005.09.008. [DOI] [Google Scholar]
- 51.Huang X, Brazel CS. On the importance and mechanisms of burst release in matrix-controlled drug delivery systems. J Control Release. 2001;73:121–136. doi: 10.1016/S0168-3659(01)00248-6. [DOI] [PubMed] [Google Scholar]
- 52.Zhang H, Zou K, Guo S, Duan X. Nanostructural drug-inorganic clay composites: structure, thermal property and in vitro release of captopril-intercalated Mg–Al-layered double hydroxides. J Solid State Chem. 2006;179:1792–1801. doi: 10.1016/j.jssc.2006.03.019. [DOI] [Google Scholar]
- 53.Hussein-Al-Ali SH, El Zowalaty ME, Kura AU, Geilich B, Fakurazi S, Webster TJ, Hussein MZ. Antimicrobial and controlled release studies of a novel nystatin conjugated iron oxide nanocomposite. BioMed Res Int. 2014;2014:651831. doi: 10.1155/2014/651831. [DOI] [PMC free article] [PubMed] [Google Scholar]
- 54.Barahuie F, Hussein MZ, Gani SA, Fakurazi S, Zainal Z. Anticancer nanodelivery system with controlled release property based on protocatechuate-zinc layered hydroxide nanohybrid. Int J Nanomedicine. 2014;9:3137–3149. doi: 10.2147/IJN.S59541. [DOI] [PMC free article] [PubMed] [Google Scholar]


