

Abstract
Objective
It is essential to develop predictive algorithms for Amyotrophic Lateral Sclerosis (ALS) disease progression to allow for efficient clinical trials and patient care. The best existing predictive models rely on several months of baseline data and have only been validated in clinical trial research datasets. We asked whether a model developed using clinical research patient data could be applied to the broader ALS population typically seen at a tertiary care ALS clinic.
Methods
Based on the PRO‐ACT ALS database, we developed random forest (RF), pre‐slope, and generalized linear (GLM) models to test whether accurate, unbiased models could be created using only baseline data. Secondly, we tested whether a model could be validated with a clinical patient dataset to demonstrate broader applicability.
Results
We found that a random forest model using only baseline data could accurately predict disease progression for a clinical trial research dataset as well as a population of patients being treated at a tertiary care clinic. The RF Model outperformed a pre‐slope model and was similar to a GLM model in terms of root mean square deviation at early time points. At later time points, the RF Model was far superior to either model. Finally, we found that only the RF Model was unbiased and was less subject to overfitting than either of the other two models when applied to a clinic population.
Interpretation
We conclude that the RF Model delivers superior predictions of ALS disease progression.
Introduction
Amyotrophic lateral sclerosis (ALS) is a devastating neurodegenerative disease affecting motor neuron populations of the cerebral cortex, brainstem, and spinal cord, leading to progressive disability and death from respiratory failure. ALS is a highly heterogeneous disease demonstrating varied clinical phenotypes and rates of disease progression. Though average survival is 3–5 years after onset, survival is markedly variable ranging from several months to over a decade. Because of this heterogeneity, ALS clinical trials are inefficient, requiring large numbers of participants to adequately power an efficacy study. In addition, this heterogeneity is a barrier to clinical care because patients, caregivers, and physicians are unable to adequately anticipate the timing of future needs.1, 2
With this dire need for ALS prediction tools in mind, a crowdsourcing competition, the DREAM‐Phil Bowen ALS Prediction Prize4Life Challenge, was launched in 2012 where competitors developed algorithms for the prediction of disease progression using a standardized, anonymized pooled database from phase 2 and 3 clinical trials.3, 4, 5 In this Challenge, competitors were asked to use 3 months of individual patient‐level clinical trial information to predict the patient's disease progression over the subsequent 9 months. The two best algorithms from the crowdsourcing competition utilized nonlinear, nonparametric methods and were able to significantly outperform a method designed by the Challenge organizers as well as predictions by ALS clinicians.6 It was suggested that the incorporation of these predictive algorithms into future clinical trial designs could reduce the required number of patients by at least 20%.6 While impressive, these algorithms are not necessarily applicable in a clinical setting for several reasons. It has been shown that clinical trial patients are generally higher functioning and more homogeneous than patients from a typical tertiary care clinic setting.2 Furthermore, patients enrolled in ALS clinical trials tend to be younger, more likely to be male, and are half as likely to have bulbar onset disease.7, 8 Thus, ALS patients enrolled in clinical research trials are likely to exhibit slower disease progression with less severe symptoms as compared to a typical clinic population. Additionally, patients who are not enrolled in clinical trials are unlikely to have extensive longitudinal data collection over a 3‐month period for use in predictive algorithms. Therefore, it is unclear that existing predictive algorithms are relevant in a broader clinical setting.
We hypothesized that the same nonlinear, nonparametric modeling techniques that were previously effective in ALS predictive models for clinical research populations 6 could be developed with only baseline data as predictor variables and validated in a tertiary clinic dataset, demonstrating usefulness in a broader setting and applicability to a clinical patient care setting.
Methods
Training and validation data
Data used in training the predictive models for this article were obtained from the PRO‐ACT Database.9 PRO‐ACT contains records from over 10,700 ALS patients who participated in 23 phase II/III clinical trials. A majority of these records were obtained prior to implementation of the revised ALSFRS scale (ALSFRS‐R).10 To set a minimum data‐completeness threshold and to retain more contemporary records, only the 3742 patients with complete forced vital capacity (FVC) records and ALSFRS‐R scores were used for model training and internal validation. An internal validation cohort of 353 patients from the PRO‐ACT database was selected randomly from the 3742 eligible records and was used for internal validation and bias estimation. The remaining 3389 records were used for training.
Test data
Data from 630 patients who were treated at the Emory University ALS clinic between 1998 and 2012 were used as the external, test dataset.11 All patients in the external dataset had multiple entries beginning from their first visit to the clinic. The median intervisit time between first and second visit was 121 days, and generally included the full ALSFRS‐R questionnaire, FVC, and vital signs. A goal of this study was to assess the performance and characteristics of models generated using patient features collected during a typical clinic visit.
Predictor variables
A panel of 21 predictor variables was compiled from baseline visit data for the clinic patients (Table 1). These data points consisted of static variables (e.g., gender and height) and temporally sensitive variables, such as FVC, weight, and ALSFRS‐R score. Dimension reduction and variable selection techniques were followed according to standard practice.5, 6 Variables were cleaned and standardized between the PRO‐ACT and Emory Clinic datasets, and descriptive statistics were generated to assess the degree of similarity between the training and test datasets (Table 1).
Table 1.
Patient characteristics
| Clinic data | PRO‐ACT data | P Value | PRO‐ACT data | Clinic data | |
|---|---|---|---|---|---|
| Variable | Mean (± SD) | Mean (± SD) | Range Min – Max | Patients Outside Range | |
| Age | 51.5 ± (32.3) | 55.8 ± (11.3) | P < 0.01** | 18–82 | 56 |
| Height (cm) | 172 ± (11) | 171 ± (9.9) | P < 0.05* | 131–205 | 2 |
| Weight (kg) | 79 ± (16.8) | 78 ± (15.9) | ns | 40–138.1 | 5 |
| Diastolic BP | 79 ± (8.3) | 80 ± (10) | P < 0.01** | 50–118 | 1 |
| Systolic BP | 131 ± (15.4) | 130 ± (16) | ns | 88–216 | 1 |
| Pulse | 77 ± (9.9) | 75 ± (11.8) | P < 0.01** | 41–135 | 0 |
| Baseline FVC (L) | 3.23 ± (1.26) | 3.44 ± (1.04) | P < 0.001*** | 0.02–7.37 | 0 |
| Time Since Diagnosis (d) | 239 ± (827) | 234 ± (226) | ns | 1666–131 | 28 |
| Time Since Symptom Onset (d) | 824 ± (1185) | 578 ± (322) | P < 0.001*** | 2173–70 | 49 |
| Gender (F:M) | 0.39:0.61 | 0.37:0.63 | ns | NA | 0 |
| Bulbar Onset (%) | 25% | 17% | P < 0.001*** | NA | 0 |
| Baseline ALSFRS‐R Slope (pts/d) | −0.029 ± (0.039) | −0.022 ± (0.017) | P < 0.001*** | −0.19–0 | 3 |
| Baseline ALSFRS‐R | 35.5 ± (8.2) | 37.8 ± (5.4) | P < 0.001*** | 16–48 | 17 |
| Baseline Trunk Sub‐score | 5.5 ± (2.1) | 5.7 ± (1.8) | P < 0.01** | 0–8 | 0 |
| Baseline Bulbar Sub‐score | 9.4 ± (2.7) | 10.2 ± (2.2) | P < 0.001*** | 0–12 | 0 |
| Baseline Respiratory Sub‐score | 10.5 ± (2.3) | 11.4 ± (1.2) | P < 0.001*** | 0–12 | 0 |
| Baseline Fine Motor Sub‐score | 5.6 ± (2.3) | 5.8 ± (2) | P < 0.01** | 0–8 | 0 |
| Baseline Gross Motor Sub‐score | 4.6 ± (2.4) | 4.8 ± (2.2) | ns | 0–8 | 0 |
| Riluzole Use (%) | 30% | 82% | P < 0.001*** | NA | 0 |
| ALSFRS‐R at 1 year | 27 ± (10) | 28.5 ± (10) | P < 0.05* | 0–48 | 0 |
FVC, forced vital capacity; *P < 0.05; **P < 0.01; ***P < 0.001.
Models
A nonlinear, nonparametric random forest (RF)12 algorithm was trained using the PRO‐ACT dataset 9 and the “randomForest” R package13 (Fig. 1). A preliminary model was trained using 21 available predictor variables from the baseline visit, and the relative contribution of each variable to reducing model accuracy was determined by quantifying the error rate for each variable (Table 2).14 A second RF model using only those variables that contributed more than a 2% reduction in model error was retrained and used for further testing on the clinic population (Table 2, upper non‐gray area). This variable reduction step was included to reduce the chance of model overfitting. The final model consisted of 13 predictor variables. Performance of the random forest model was compared to the pre‐slope model and a parametric generalized linear (GLM) model.
Figure 1.
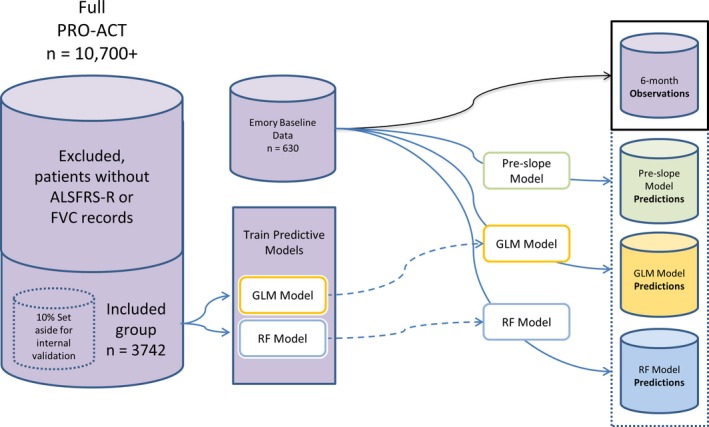
Model Development Schematic. Schematic showing the relationship between the PRO‐ACT database, the Emory Clinic data, and the three models developed for testing.
Table 2.
Random forest variable importance of preliminary model
| Variable | Importance |
|---|---|
| Time from Baseline | 26.57% |
| Baseline ALSFRS‐R | 23.19% |
| Baseline ALSFRS slope | 13.74% |
| Baseline Trunk Sub‐score | 6.17% |
| Time Since Symptom Onset | 3.66% |
| Baseline FVC | 2.89% |
| Baseline Fine Motor Sub‐score | 2.80% |
| Time Since Diagnosis | 2.64% |
| Age | 2.40% |
| Baseline Bulbar Sub‐score | 2.33% |
| Systolic BP | 2.10% |
| Baseline Gross Motor Sub‐score | 2.07% |
| Weight | 2.05% |
| Pulse | 1.90% |
| Height | 1.85% |
| Diastolic BP | 1.56% |
| Baseline Respiratory Sub‐score | 0.98% |
| Limb Onset | 0.29% |
| Bulbar Onset | 0.29% |
| Gender | 0.27% |
| Riluzole Use | 0.26% |
FVC, forced vital capacity.
This table shows the variable importance list for a preliminary 21 variable model. To reduce the possibility of overfitting, variables whose importance was less than 2.00% were deleted from the final 13 variable model that was used in all the analyses.
The pre‐slope model is a nonparametric linear model that is often used in a clinical or research setting (Fig. 1). It did not use the PRO‐ACT data, but rather it was calculated for every patient using a presumed perfect ALSFRS‐R score the day before time of onset and the score at baseline; all patients had a y intercept of 48. This model is not based on any assumptions about population‐level disease characteristics, rather, it is based on calculating a patient's ALSFRS‐R slope over time by assuming full functionality prior to the first onset of symptoms and extrapolating a future score based on the presumed linear trajectory of ALSFRS‐R progression.
The parametric generalized linear (GLM) model was developed using PRO‐ACT patient data and the “LM” function in the base R package15 (Fig. 1). The model was fit using four variables, including the time since baseline, time from symptom onset to baseline, the ALSFRS‐R score at baseline, and the slope of the ALSFRS‐R score at baseline (calculated using a score of 48 the day prior to the day of symptom onset). These four variables were selected based on the four most important noncollinear variables revealed by the variable importance list generated from the RF Model (Table 2):
where,
ALSFRSRi,T is the predicted ALSFRS‐R score for patient i at time T.
T is the time since baseline.
t is the time from symptom onset to baseline.
ALSFRSR0 is the ALSFRS‐R score at baseline.
m ALSFRSR0 is the slope of the ALSFRS‐R score at baseline.
ε is ~N(0, 5.9022).
Model evaluation
The performance of the models was assessed qualitatively using visual checks and quantitatively by assessing the error between predicted and observed ALSFRS‐R scores via root mean square deviation (RMSD).16 Estimation of model bias was performed by calculation of mean prediction error via bootstrap resampling.17
Model validation
Internal model validation was performed using the randomly selected internal validation cohort of PRO‐ACT patients not used in model training. Predictions were generated for patients directly (pre‐slope model) or using the internal validation cohort (GLM and RF models), and overall model performance was qualitatively assessed by plotting predicted versus observed scores as well as quantitative assessment of model error via descriptive statistics and bootstrap analysis.
Model testing on clinic data
7The proposed use of the models would be to generate actionable predictions about disease progression for individual patients. Features collected at the first clinic visit were used to predict ALSFRS‐R scores at regular intervals between 2 and 36 months. After predictions were generated, prediction accuracy was assessed using observations for patients who visited the clinic within 45 days of the predicted time points. More rigorous assessment of model behavior was then performed at the 6‐month time point.
Bootstrap analysis of mean error
The population means and confidence intervals of prediction errors for the models were assessed by bootstrap analysis of mean prediction error. Prediction error from the population of patient predictions was sampled from the dataset with replacement and was used to calculate a mean prediction error. This process was repeated 5000 times to establish distributions and 95% confidence intervals of mean errors. A mean error of zero within the confidence interval of the distribution was the threshold for determining model bias.17
Computational details
All computations were performed using the R statistical computing system (version 3.1.0)15 and the R base packages and add‐on packages randomForest,13 plyr,18 and ggplot2.19 The data are available to registered PRO‐ACT users.9
Results
Comparison of tertiary clinic and research datasets
The clinical and demographic differences between research patients who enroll in clinical trials and in patients from the general population have been described in detail (Table 1). To establish the degree of discontinuity between the datasets, the mean and distributions of each patient attribute was tested and found to be significantly different for 13 of the 17 continuous variables and for 2 out of 3 proportional distributions (Table 1), confirming earlier reports of the substantial differences between research and clinic populations.2, 7, 8, 11, 20, 21 In particular, significant differences between the two populations are observed for most of the features that would be included as independent variables for a parametric predictive model.
In addition to the distribution differences, there were a number of patients in the clinic dataset who had attribute values that were not represented in the range of values included in the PRO‐ACT data base (Table 1, columns 5 and 6). The variable with the largest number of outliers was age, with 56 clinic patients either being younger or older than the minimum and maximum ages represented in PRO‐ACT. Patients who had baseline attributes not represented in PRO‐ACT were not included in subsequent analyses as none of the models developed were assumed to be applicable to patients without representation in the training dataset. The final clinic dataset contained 508 unique patients with multiple records.
An initial consideration for a predictive model was the use of longitudinal information provided during a run‐in period to generate predictor variables. In particular, changes in FVC and ALSFRS‐R during a several‐month run in have proven valuable in predicting future disease progression.6 However, an important distinction between the longitudinal data in PRO‐ACT and the clinic data is the interval between observations. The median interval between the first and second visits in the PRO‐ACT database is 28 days and the median interval in the Emory clinic data is 121 days. The aim of this study is to validate actionable predictive models for use in the clinic. By regarding the median intervisit interval in the Emory dataset as a reasonable proxy for the general clinic population, it would follow that a model requiring two visits relatively close in time would have limited utility. In order to train and test a model with maximal practical utility, all models were developed using information gathered only at the first visit. This first clinic visit was designated as the baseline visit.
Internal validation and initial assessment of model performance
Initial assessment of model error for the GLM and RF models was analyzed via root mean squared deviation (RMSD)16 on a randomly sampled subset of PRO‐ACT patients that were set aside and not used in model training (i.e., an internal validation set) (Table 3). This value allows for quantitative assessment of model accuracy and served as the baseline measure of model performance. The GLM and RF models had similar RMSDs for 6 month predictions (4.68 and 4.70, respectively, Table 3) indicating that both types of models were capable of achieving similar fits to the internal validation data at this early time point. When the models were applied to the clinic datasets, they both exhibited increased error, with the GLM model error increasing 16.4% to 5.45 and the RMSD of the RF model increasing less dramatically to 5.28 (12.3%). Both models performed substantially better at 6 months than the commonly used pre‐slope model (RMSD = 6.68). Homoscedasticity of model error across predicted scores was tested using the Breusch–Pagan test,22 which confirmed homoscedasticity for all three model predictions across the spectrum of observed ALSFRS‐R scores. The homoscedasticity result (as opposed to heteroscedasticity) indicates that the variance in predicted ALSFRS‐R scores is not significantly different for observed ALSFRS‐R scores for any of these models. Interestingly, the absolute prediction error between the GLM and RF models is significantly different when applied to the clinic population (P = 0.004, mean of differences = −1.01, paired t‐test), but is not different when tested on the internal validation data (P = 0.0537). The lower RMSD and significantly reduced model error of the RF model when compared against the GLM model provides initial evidence that the RF model is less prone to overfitting. Taken together, these results indicate that the overall prediction accuracy and model performance of the three models was high enough to support further analysis, and that a model trained using the research patient data contained in the PRO‐ACT data base can be applied to making predictions for tertiary ALS clinic patients. In fact, such models can achieve superior predictive accuracy compared to the pre‐slope model, a currently used predictive tool.
Table 3.
Model performance at 6 months
| Pre‐slope Model | GLM Model | RF Model | |
|---|---|---|---|
| Validation RMSD | NA | 4.68 | 4.70 |
| Clinic RMSD (% change) | 6.68 | 5.45 (16.4%) | 5.28 (12.3%) |
| Heteroscedasticity | NS | NS | NS |
GLM, generalized linear models; RMSD, root mean square deviation.
Longitudinal RMSD evaluation
Evaluating the longitudinal predictive component of models developed to predict ALS disease progression is of particular interest because of the chronic progressive nature of the disease. To evaluate model stability over the range of relevant times for which predictions might be of use, RMSD was assessed for nonduplicated patient observations within 6‐month windows ranging from 6 to 36 months following the initial baseline visit. All three models demonstrated an increase in error over time, with the pre‐slope model showing the highest initial error and most rapid increase in error with time (Fig. 2, red line). The GLM (Fig. 2, green line) and RF (Fig. 2, black line) Models had very similar RMSDs at 6 and 12 months but the RF Model showed increased temporal stability at 18 months and beyond with a 33% lower RMSD at the 36‐month prediction window (RF RMSD = 7.9, GLM RMSD = 12.1). The performance of the RF model across all time points makes it the preferred model for near‐ and long‐term applications. Since most follow‐up visits occur within 6 months of an initial clinic visit, we reasoned that a clinician may want a tool that can assist in advising patients in the near‐term. For this reason, subsequent analyses focused on model performance within the 6‐month window.
Figure 2.
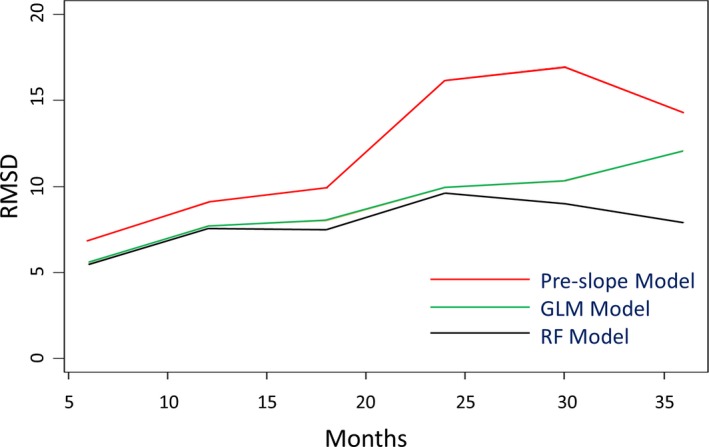
Root‐Mean‐Square Deviation over Time. Plots of root‐mean square deviation (RMSD) at 2‐month intervals for the RF model (black), GLM model (green), and pre‐slope model (red). RMSD was calculated for single patient records within each time window. RF, random forest.
Six‐month scatterplot analysis of model performance
A reasonable proxy for the spectrum of ALS disease states is the range of the 48‐point ALSFRS‐R scale. To investigate model performance across this scale at 6 months, we plotted the predicted score as a function of the observed score for all time points containing ALSFRS‐R records (Fig. 3 A–C). The goodness of fit of observed score as a function of predicted score for the RF Model demonstrated a high degree of agreement, with a slope of 0.942, an R 2 = 0.582, and an intercept of −0.227 (Fig. 3C). The GLM Model (Fig. 3B) had slightly poorer performance with a fitted slope of 0.86, an R 2 = 0.57, and an intercept of 4.34. As was observed with the RMSD, the goodness of fit with the pre‐slope model was substantially lower by comparison with a fitted slope of 0.63, an R 2 = 0.53, and an intercept of 11.2 (Fig. 3A).
Figure 3.
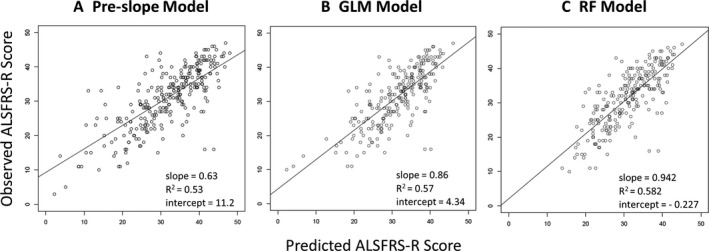
Model Performance at 6 Months. Plots of observed ALSFRS‐R score as a function of predicted score for the pre‐slope, GLM and RF models (A, B, C, respectively). Plotting the predictions with observed ALSFRS‐R score on the y‐axis allows a visual indication of predicted accuracy along the spectrum of disease states. In addition to indications of heteroscedasticity along the spectrum of disease states, it is possible to evaluate global bias such as the tendency to underestimate ALSFRS‐R for patients with particularly low scores. RF, random forest.
Six‐month bootstrap analysis of mean prediction errors of clinic models
Bootstrapping is a metric where random samples are taken from a test set with replacement to calculate an estimated mean error, and this process is repeated many times as a way to estimate the distribution characteristics of much larger populations than are actually available. We used bootstrap sampling to estimate the distribution of the mean error between predicted and observed scores for each of the three models (Fig. 4). Bootstrap resampling of model error was used to test the hypothesis that a nonlinear nonparametric predictive model (RF Model) will exhibit less bias than a parametric generalized linear model (GLM) when predicting disease progression for a clinic population. A model is determined to be significantly biased if a bootstrapped mean error of zero does not fall within the 95% confidence interval of the bootstrap sample.17
Figure 4.

Bootstrap Mean Prediction Error. Box and whisker plot of prediction error assessed at 6 months via bootstrap resampling. Mean prediction error was assessed via bootstrap resampling to gain insight into model bias. Mean error (solid horizontal line), standard deviation (box border), and 95% confidence interval (whisker) for the pre‐slope, GLM, and RF models. RF, random forest.
The bootstrap estimated mean error of the pre‐slope model within the 6‐month time window had a negative value of −0.627 ± 0.224, indicating that using the pre‐slope method to estimate disease progression in the clinic population had a significant tendency to underestimate disease progression. Conversely, the GLM Model error had a positive estimated value of 0.573 ± 0.24 indicating a significant tendency to overestimate disease progression at 6 months. The RF Model error was estimated to be −0.22 ± 0.224, demonstrating that the RF Model was capable of generating predictions with the lowest mean error and least bias (Fig. 4). In fact, the 95% confidence interval of the mean error for the RF Model included the value of zero, indicating that the slight negative tendency to underestimate disease progression was not significant. These results suggest that of the three models tested, only the RF model was capable of providing nonbiased predictions for ALS patients in a tertiary care setting.
Discussion
This study supports our hypothesis that a RF algorithm, a nonparametric, nonlinear machine learning‐based modeling technique, using only baseline data as predictor variables can accommodate sources of bias and is capable of reliably generating predictions for patients with ALS in a clinic setting. The RF method outperformed the more conventional pre‐slope and GLM prediction methods. An important consideration in any predictive model is the risk of model overfitting. The phenomenon of overfitting is ascribed to a model attributing correlative significance to random associations in the data, also known as spurious correlation. In the case of disparate datasets such as a clinical trial research population represented in PRO‐ACT and a population from a tertiary care clinic, there is increased risk that overfitting could contribute significantly to model error. The choice for mitigating this risk was to reduce the set of predictive features used in the model based on the relative contributions of all available features. By selecting only those features capable of accounting for more than 2% of relative model error in the training dataset, we reduced the likelihood of spurious correlation. The observation that the increase in RMSD for the RF Model when the model was applied to the clinic dataset was lower than the increase observed in the GLM Model supported this decision.
Initial evaluation of the three models suggested that the RF model had a more stable RMSD across the span of prediction windows, with the most notable improvement seen at the 36‐month mark. The increased stability of the RF model could be of particular use when planning for clinical trials of longer duration or attempting predictions for distant clinical outcomes in a patient‐care setting.
A closer analysis of model error at the 6‐month window provides additional insight into the differences among the three models. Initial evidence of model bias is provided by the line of best fit when observed ALSFRS‐R scores are plotted as a function of predictions for each model. With a fitted slope closest to 1.0 and an intercept of −0.227, the RF predictions demonstrated the least biased correlation with observed scores of the three models. This observation was further supported by plotting the bootstrap resampled mean prediction error for the same data. Both the GLM and the pre‐slope models showed significant bias compared to the RF model. Interestingly, the sign of the bias was reversed in the GLM and pre‐slope models. Since the pre‐slope model is nonparametric, the potential sources of bias are limited. Presumably, the tendency of the pre‐slope model to overestimate disease progression is evidence of a flattening of disease course that causes the rate of ALSFRS‐R on average to deviate from a linear trajectory. The bias in the GLM model likely has a number of potential sources, including the significant differences between the PRO‐ACT and clinic datasets among the distributions of the independent variables used in the model. Other potential sources of bias include differences in standard of care between the training and test data. Interestingly, the bootstrap estimate of mean error was negative for the RF model and positive for the GLM Model, indicating that the bias common to both models is secondary to the less quantifiable sources of error within each model.
An objective of the initial crowdsourcing Challenge was to stimulate research into ALS disease progression. Indeed, in addition to the publication describing the winning models,6 there have been several additional publications describing the development of predictive ALS disease progression models using PRO‐ACT.23, 24 However, the usefulness of predictive models is defined by the applications that rely on them. In the case of PRO‐ACT, considerable effort has been put into leveraging the database to aid in clinical trial development and analysis. This communication seeks to add to the utility of the PRO‐ACT database by demonstrating that a machine learning‐based, nonlinear, nonparametric model using only baseline data as predictor variables can be developed using the clinical trials research data, and be applied to a tertiary care clinic population. The application of models developed using the PRO‐ACT database to data in the clinic setting may prove to be a useful tool for comparison with smaller clinic‐based datasets. Currently, studies with clinic data have been limited to models built on data from a single clinic. Examples of single‐clinic database studies include analyses of ALS heritability,25 survival,26 antecedent disease,27 coordinated care,28 and cognition.29
Accurate anticipation of a patient's ALS disease trajectory, as defined by future changes in the ALSFRS‐R score, will likely facilitate informed decision‐making and foster better standards of clinical care. While the disease course of ALS is known to be highly heterogeneous, there is recent evidence from a retrospective analysis that patients with stereotypical outcomes demonstrate a pattern in their disease progression.30 In particular, evidence suggested that disease progression rates after disease onset have a pattern that encompasses both linear and nonlinear components, and further that these patterns are affected by multiple, as‐yet undescribed factors. The results of our study demonstrate that a nonlinear, nonparametric predictive model is capable of predicting progression rates in an unbiased manner. Interestingly, a noted benefit to the use of a machine learning‐based predictive model such as random forest is that it has been shown to uncover higher order variable interactions such as the ones suggested to affect disease progression rates by Proudfoot et al.30 Further application of machine learning methods toward uncovering these interactions and articulating patterns of disease progression represents an interesting course of further investigation.
An awareness of disease course can help in the planning for resource allocations and anticipate timing for when the patient will require additional interventions.31 A lack of familiarity with ALS disease trajectory has recently been cited as an impediment to end‐of‐life discussions and a barrier to palliative care access, a situation that can result in added stress at a time of severe crisis.32, 33 Carreiro et al. 34 have recently developed a constrained hierarchical clustering model that predicts respiratory insufficiency. Ultimately, improvements to individualized care plans that include predicted disease trajectories will maximize patient and family quality of life.
While the ability to accurately predict a future ALSFRS‐R score has some immediate utility for patients and clinicians, we anticipate that a more useful decision aid will encompass a number of disease attributes to provide a more comprehensive estimation of disease progression. As an example, incorporating actionable predictions about mortality risk would increase the utility of a decision aid considerably. As a chronic, degenerative disease, the ultimate outcome of an ALS diagnosis is death. The model tested in this publication does not factor mortality into the predictions generated, nor is the anticipation of mortality used as a metric to test model performance. It will be important to fully vet and incorporate a survival model into any future tool or application based on a predictive model. Additionally, it is possible to extrapolate information about the occurrence of key events in disease progression such as the loss of lower limb mobility or the need for supplemental feeding as surrogates for time‐to‐wheelchair and need for a PEG tube, respectively. Using these events as outcomes upon which to train predictive models is another potential avenue for deriving value that can be applied toward meaningful improvements in care, treatment, and planning for patients and caregivers. An important factor in considering an eventual clinical application is to investigate ways of providing this information to clinicians or patients in a way that is readily understandable and most likely to be useful.
These results indicate that a machine learning‐based predictive model generated using existing patient records is sufficient to predict the average progression of a patient population and could make for a suitable decision aid in clinics. Based on these findings, we suggest that additional improvements to a predictive model could readily be achieved by inclusion of additional outcomes and progression data from a clinic population as well as clinical trial participants in the training datasets. The continual addition of contemporary datasets for model training will remain critical to maintaining models that can account for updates to standard of care and encompass the range of patient attributes present in the broader ALS patient community. The approach used here should serve as a model for the development of predictive models in additional neurologic diseases.
Author Contributions
AAT, CF, MK, JDG, and DLE conceived and designed the study. AAT and MP collected and harmonized the data. AAT conducted the data analyses. NZ, MK, JDG, and DLE implemented and coordinated the study. LW and NZ assisted with interpretation of results. CF and JDG assisted with interpretation of clinical relevance. AAT, CF, JDG, and DLE wrote the manuscript with review and feedback from MP, LW, NZ, and MK.
Conflict of Interest
None declared.
Acknowledgment
This work was partially supported by a grant (D.L.E.) from the ALS Association (16‐IIP‐254).
References
- 1. Robberecht W, Philips T. The changing scene of amyotrophic lateral sclerosis. Nat Rev Neurosci 2013;14:248–264. [DOI] [PubMed] [Google Scholar]
- 2. Fournier C, Glass JD. Modeling the course of amyotrophic lateral sclerosis. Nat Biotechnol 2015;33:45–47. doi: 10.1038/nbt.3118. [DOI] [PubMed] [Google Scholar]
- 3. Atassi N, Berry J, Shui A, et al. The PRO‐ACT database: design, initial analyses, and predictive features. Neurology 2014;83:1719–1725. doi: 10.1212/WNL.0000000000000951. [DOI] [PMC free article] [PubMed] [Google Scholar]
- 4. PRO‐ACT . A Guide to the DREAM Phil Bowen ALS Prediction Prize4Life Challenge. Available at: https://nctu.partners.org/ProACT/Home/ALSPrize. (accessed March 2016).
- 5. Zach N, Ennist DL, Taylor AA, et al. Being PRO‐ACTive ‐ What can a clinical trial database reveal about ALS? Neurotheraputics 2015;12:417–423. doi: 10.1007/s13311‐015‐0336‐z. [DOI] [PMC free article] [PubMed] [Google Scholar]
- 6. Küffner R, Zach N, Norel R, et al., et al. Crowdsourced analysis of clinical trial data to predict amyotrophic lateral sclerosis progression. Nat Biotechnol 2015;33:51–57. doi: 10.1038/nbt.3051. [DOI] [PubMed] [Google Scholar]
- 7. Kiernan MC, Vucic S, Cheah BC, et al. Amyotrophic lateral sclerosis. Lancet 2011;377:942–955. [DOI] [PubMed] [Google Scholar]
- 8. Beghi E, Chio A, Couratier P, et al. The epidemiology and treatment of ALS: focus on the heterogeneity of the disease and critical appraisal of clinical trials. Amyotroph Lateral Scler 2011;12:1–10. doi: 10.3109/17482968.2010.502940. [DOI] [PMC free article] [PubMed] [Google Scholar]
- 9. PRO‐ACT . Pooled Resource Open‐Access ALS Clinical Trials Database. Available at https://nctu.partners.org/ProACT/(accessed December 2015).
- 10. Cedarbaum JM, Stambler N, Malta E, et al., et al. The ALSFRS‐R: a revised ALS functional rating scale that incorporates assessments of respiratory function. BDNF ALS Study Group (Phase III). J Neurol Sci 1999;169:13–21. [DOI] [PubMed] [Google Scholar]
- 11. Traxinger K, Kelly C, Johnson BA, et al. Prognosis and epidemiology of amyotrophic lateral sclerosis: analysis of a clinic population, 1997–2011. Neurol Clin Pract 2013;3:313–320. doi: 10.1212/CPJ.0b013e3182a1b8ab. [DOI] [PMC free article] [PubMed] [Google Scholar]
- 12. Breiman L. Random Forests. Mach Learn J 2001;45:5–32. doi: 10.1023/A:1010933404324. [Google Scholar]
- 13. Liaw A, Wiener M. Classification and regression by randomForest. R News 2002;2:18–22. [Google Scholar]
- 14. Hastie T, Tibshirani R, Friedman JD. 2009. The elements of statistical learning: data mining, inference, and prediction, 2nd ed. springer series in statistics. p309 & ff. http://statweb.stanford.edu/~tibs/ElemStatLearn/. (accessed April 2016).
- 15. R Core Team . R. A language and environment for statistical computing. R Foundation for Statistical Computing. Vienna, Austria. Available at http://www.R-project.org/. (accessed April 2016).
- 16. Hyndman RJ, Koehler AB. Another look at measures of forecast accuracy. Int J Forecasting 2006;22:679–688. doi: 10.1016/j.ijforecast.2006.03.001. [Google Scholar]
- 17. Hastie T, Tibshirani R, Friedman JD. 2009. The Elements of Statistical Learning: Data Mining, Inference, and Prediction, 2nd ed. Springer Series in Statistics. P249 & ff. Available at http://statweb.stanford.edu/~tibs/ElemStatLearn/. (accessed April 2016).
- 18. Wickham H. The split‐apply‐combine strategy for data analysis. J Stat Software 2011;40:1–29. [Google Scholar]
- 19. Wickham H. ggplot2: elegant graphics for data analysis. New York, NY, USA: Springer, 2009. [Google Scholar]
- 20. Robinson R. ALS trial patients don't reflect the general als population: a true treatment effect may be elusive. Neurology Today 2011;11:30–36. doi: 10.1097/01.NT.0000399186.71898.55. [Google Scholar]
- 21. Logroscino G, Traynor BJ, Hardiman O, et al. Descriptive epidemiology of amyotrophic lateral sclerosis: New evidence and unsolved issues. J Neurol Neurosurg Psychiatry 2008;79:6–11. [DOI] [PubMed] [Google Scholar]
- 22. Breusch TS, Pagan AR. A Simple test for heteroskedasticity and random coefficient variation. Econometrica 1979;47:1287–1294. [Google Scholar]
- 23. Gomeni R, Fava M. Pooled resource open‐access als clinical trials consortium. Amyotroph Lateral Scler Frontotemporal Degener 2014;15:119–129. doi: 10.3109/21678421.2013.838970. [DOI] [PubMed] [Google Scholar]
- 24. Hothorn T, Jung HH. RandomForest4Life: a random forest for predicting ALS disease progression. Amyotroph Lateral Scler Frontotemporal Degener 2014;15:444–452. doi: 10.3109/21678421.2014.893361. [DOI] [PubMed] [Google Scholar]
- 25. Wingo TS, Cutler DJ, Yarab N, et al. The heritability of amyotrophic lateral sclerosis in a clinically ascertained United States research registry. PLoS ONE. 2011;6:e27985. doi: 10.1371/journal.pone.0027985. [DOI] [PMC free article] [PubMed] [Google Scholar]
- 26. Gordon PH, Salachas F, Bruneteau G, et al. Improving survival in a large French ALS center cohort. J Neurol 2012;259:1788–1792. doi: 10.1007/s00415‐011‐6403‐4. [DOI] [PubMed] [Google Scholar]
- 27. Mitchell CS, Hollinger SK, Goswami SD, et al. Antecedent disease is less prevalent in amyotrophic lateral sclerosis. Neurodegener Dis 2015;15:109–113. doi: 10.1159/000369812. [DOI] [PMC free article] [PubMed] [Google Scholar]
- 28. Cordesse V, Sidorok F, Schimmel P, et al. Coordinated care affects hospitalization and prognosis in amyotrophic lateral sclerosis: a cohort study. BMC Health Serv Res 2015;15:134. doi: 10.1186/s12913‐015‐0810‐7. [DOI] [PMC free article] [PubMed] [Google Scholar]
- 29. Hu WT, Shelnutt M, Wilson A, et al. Behavior matters–cognitive predictors of survival in amyotrophic lateral sclerosis. PLoS ONE 2013;8:e57584. doi: 10.1371/journal.pone.0057584. [DOI] [PMC free article] [PubMed] [Google Scholar]
- 30. Proudfoot M, Jones A, Talbot K, et al. The ALSFRS as an outcome measure in therapeutic trials and its relationship to symptom onset. Amyotroph Lateral Scler Frontotemporal Degener 2016;17:414–25. doi: 10.3109/21678421.2016.1140786. [DOI] [PMC free article] [PubMed] [Google Scholar]
- 31. Bromberg MB, Brownell AA, Forshew DA, et al. A timeline for predicting durable medical equipment needs and interventions for amyotrophic lateral sclerosis patients. Amyotroph Lateral Scler Frontotemporal Degener 2010;11:110–115. doi: 10.3109/17482960902835970. [DOI] [PubMed] [Google Scholar]
- 32. Connolly S, Galvin M, Hardiman O. End‐of‐life management in patients with amyotrophic lateral sclerosis. Lancet Neurol 2015;14:435–442. doi: 10.1016/S1474‐4422(14)70221‐2. [DOI] [PubMed] [Google Scholar]
- 33. Kiernan MC. Palliative care in amyotrophic lateral sclerosis. Lancet Neurol 2015;14:347–348. doi: 10.1016/S1474‐4422(14)70289‐3. [DOI] [PubMed] [Google Scholar]
- 34. Carreiro AV, Amaral PM, Pinto S, et al. Prognostic models based on patient snapshots and time windows: predicting disease progression to assisted ventilation in Amyotrophic Lateral Sclerosis. J Biomed Inform 2015;58:133–144. doi: 10.1016/j.jbi.2015.09.021. [DOI] [PubMed] [Google Scholar]